Monitoring-based assessment of environmental pollution in regions of the Russian Federation
-
Ekaterina A. Zhadanovskaya
 ,
Sergey A. Gromov
,
Sergey A. Gromov

Abstract
The article assesses the environmental pollution level in urban areas of the Russian Federation regions. Environmental monitoring data were used as data sources. For each Russian region the environmental pollution level was considered as the sum of pollution indices for the basic environmental media: air, surface water and soil. It allowed ranking regions and grouped them into categories (from extremely high polluted to extremely low ones). The air pollution monitoring network in cities and industrial centres does not cover all regions of the country, leading to undetermined air pollution level in 12 of 85 regions and thus to underestimated environmental pollution level there. The paper proposes to use the monitoring network data of the snow cover chemistry for the air pollution assessment in problematic regions and more accurate calculation of the environmental pollution level in them. Based on the air monitoring data for 2018 we revealed regions with high and extremely high levels of air pollution, their list was added after analyzing the snow cover chemistry data. As a result, the total assessment of environmental pollution was recalculated upward.
Introduction
The environmental pollution assessment of different regions is one of the important problems not only in Russia but in many industrial countries. The environmental pollution caused by human activities leads to decreasing the environmental quality especially in urban areas. To control and evaluate such processes, it is necessary to develop an environmental pollution index involving the pollution assessment results of three basic environmental media such as air, water and soil.
The Russian Federation consists of 85 regions (constituent entities) that differ in size, industrial development, population density, climate conditions and other factors influencing the pollution dispersal and environmental health within the region. The environmental pollution assessment at the regional scale faces the problem of poor data. Some statistical data implicitly indicating the environmental pollution are provided by the Russian Federal State Statistic Service and free available on the website https://eng.rosstat.gov.ru/Publications. The amounts of air pollutant emissions, wastewater discharges into surface water bodies, the number of illegal landfills or disposal municipal solid waste are mainly used as the basic components for the composite indices of the environmental quality/pollution [1, 2]. The similar datasets underlie the calculation of the state regional indicator “Environmental quality” approved by the Government Decree in 2021 and calculated by the Ministry of Natural Resources and Environment of the Russian Federation as the arithmetic mean of four dimensionless parameters indicating air and water pollution, reforestation and waste disposal.
Pollution monitoring data are rarely used in assessing and mapping the environmental health situation in the Russian Federation. The only attempt to determine the level of environmental pollution for each Russian region using the national monitoring results was made more than 10 years ago [3]. Unfortunately, the research has not been further elaborated.
The present study uses the same concept as above. The national monitoring data by the Federal Service for Hydrometeorology and Environmental Monitoring underlie the environmental pollution assessment of regions. The national monitoring system consists of 15 subsystems including monitoring of air, soil, subsoil, water bodies, forests and fauna, hydrobiological monitoring, etc. We propose to consider the environmental pollution index (EPI) as a sum of normalized pollution indices for air, surface water and soil.
Materials and methods
Air pollution index of the region is calculated with formula (1):
where m is the number of cities in region r;
Values of the weighted factor
| Air pollution level in a city | µi |
|---|---|
| No data | 0 |
| Low | 0.125 |
| Medium | 0.375 |
| High | 0.625 |
| Extremely high | 1 |
Based on monitoring data the assessments of air pollution level in Russian cities are annually published in the Yearbook “Air pollution in cities of Russia” on the website http://voeikovmgo.ru/. The air pollution monitoring network consists of about 670 monitoring stations located in cities and industrial centres and covers 77 of 85 regions of Russia. The level of urban air pollution evaluates with a set of parameters. The main of them is an integrated Index of Atmospheric Pollution calculated as a combination of average annual concentrations of five priority pollutants within a city. It reflects the degree of chronic long-term air pollution and indicates the level of air pollution in a city. The last one varies from low to extremely high (see the first column of Table 1). Cities are annually graded and ranked with the Index. In 2018 the air pollution level was determined for 246 Russian cities and industrial centres located in 73 regions; the number of pollutants measured was 55 [4]. We also used the official statistical data published in the Russian Statistical Yearbook [5] and the bulletin “Population of the Russian Federation by municipalities” [6] as a source of population data.
Water pollution index is calculated with formula (2):
where
The surface water pollution monitoring network consists of about 1800 monitoring sites established in more than 1000 waterbodies (main and small rivers, lakes, reservoirs, etc.) and covers all regions of Russia. The monitoring sites are located in urban areas. Their number varies from one to four depending on the city area. The high pollution is identified if the sample pollutant concentration represents from 3 to 5-fold increase over the maximum permissible concentration of the 1st–2nd hazard category substances and 10–50-fold – of the 3rd–4th ones. The extremely high pollution means that the concentration value exceeds the maximum HP threshold. The HP and EHP data are collected into the ad hoc database developed in the Yu.A. Izrael Institute of Global Climate and Ecology (IGCE) and updated monthly. In 2018 the HP and EHP events were registered 2112 and 631 times, respectively, for 30 pollutants and 6 water quality parameters in 52 regions.
The ground surface area exposed to chronic cumulative industrial and transport pollution in and around cities or industrial centers of a region is considered as the soil pollution index of the region. Contaminated areas were calculated on the basis of satellite data analysis during the snowmelt when the snow cover shading around settlements allows to determine the boundaries of 2-fold background exceeding [7, 8].
Taking into account the source-data features, hereinafter, we consider only the urban areas while analyzing the pollution level at the regional scale.
EPI calculation requires the same dimension for all pollution indices. To provide this, we have aligned the range of each index with 5-point scale (1 being the lowest and 5 being the highest pollution level; 0 point means the absence or insufficient data for the estimation). In this regard, all Russian regions were ranked with the pollution index for each environmental medium and then clustered with the k-means method into 5 groups [9, 10] with the assignment of correspondent points. EPI is calculated as a sum of points for air, water and soil. We consider that the pollution level of the region is assigned to be extremely high if EPI is equal or more than 12, high – for the EPI range from 9 to 11, medium – from 7 to 8, low – from 5 to 6, extremely low – from 1 to 4. The detailed description of the EPI concept and foundation is presented in the monograph “Environmental pollution in Russian Regions at the beginning of the XXI century” [11].
It should be noted that Russian regions significantly differ in their geographical sizes. The two largest regions of 2.3 and 3 million sq. km in the Asian part of Russia (Krasnoyarsk Territory and Republic of Sakha (Yakutia), respectively) were divided into parts to separate densely populated areas from sparsely populated ones. Three cities with the federal status, including Moscow and St. Petersburg, were combined with corresponding regions within which they are located. Thus, we estimated the environmental pollution level for 85 regions but only 80 of them match to the constituent entities.
The analysis of air pollution monitoring network showed that the air pollution level cannot be determined for 12 regions. In 10 of them there are no air monitoring stations. In 2 regions, there is insufficient data for the calculation of air pollution level in cities, and hence the regional air pollution index. For this reason, snow cover chemistry (SCC) can serve as an important source of air pollution information. Measurements of atmospheric pollution deposition by chemical analysis of the snowpack is suitable in regions where the snow remains on the ground for several months at sub-zero temperatures [12]. The location of Russia in the northern part of Eurasia (mainly north of the 50th parallel) enforces these conditions except of the southern part of the European Russia.
To expand the geographical coverage when determining the regional level of air pollution, we used the monitoring results of SCC. The SCC network included 520 monitoring sites (background, regional and urban) in 2018. The urban and regional sites are located in 57 regions including 6 regions with undetermined air pollution level mentioned above. There are no any snow cover monitoring sites in 12 regions located in the North-Caucasus and Southern Federal Districts due to non-permanent snow cover. Sampling of snow cover is carried out once a year during the period of maximal snow accumulation. The major ion concentrations and pH are measured in snow water samples in order to estimate the deposition flux of pollutants for the particular area during the cold (snowy) season. A comparison of major ion concentrations in the snowpack and monthly precipitation samples indicated that little of the major ions have escaped from the snowpack [12].
Since the present study focuses only on man-made air pollution in urban areas, for each region the total fall-out pollutants’ deposition was calculated as a sum of sulfur, nitrogen and calcium fluxes expressed in terms of mole per sq. km per month. Concentrations of sulfate (
Results and discussion
The spatial distribution of air pollution levels obtained as cluster analysis results is shown in Fig. 1. For 6 regions (Republics of Mari El and Altai, the northern part of Republic of Sakha (Yakutia), the central part of Krasnoyarsk Territory, Chukotka and Nenets Autonomous Areas) the air pollution level is a clustering result of air pollutant deposition fluxes calculated on the SCC data.
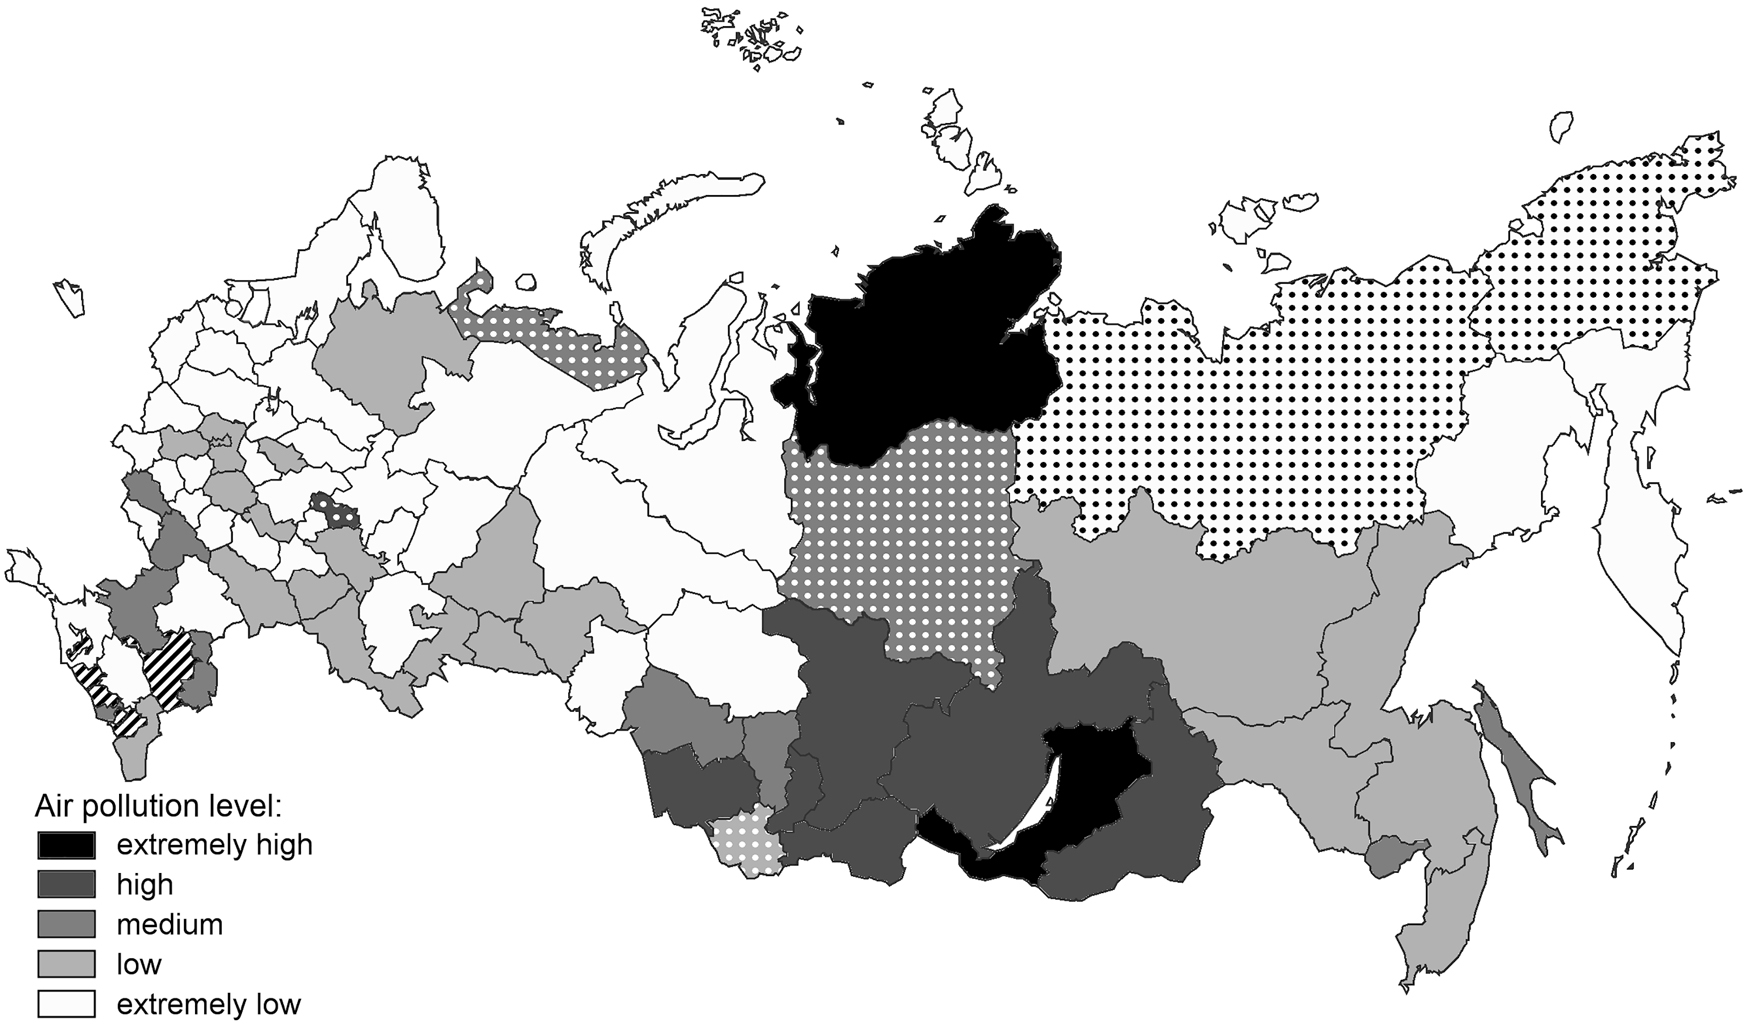
Monitoring-based regional assessment of air pollution in urban areas of the Russian Federation in 2018. In dotted regions the air pollution level was calculated on the basis of snow cover chemistry data; striped regions are the areas with absence of any air pollution monitoring data.
The most air-polluted regions are located in the Asian part of Russia. They concentrated in the south of the Eastern Siberia except of the northern part of Krasnoyarsk Territory where Norilsk being the big center of non-ferrous metal industry dominantly influences on the regional air pollution. In the south the Siberian anticyclone controls the weather conditions in the cold period. It forms such adverse weather effects which lead to the near-surface accumulation of air pollutants resulting in the poor air quality in cities. In contrast, regions of the European Russia mainly have low or extremely low air pollution level.
If we consider the environment as a system of air, water and soil and assess the environmental pollution level with the EPI, the list and distribution map of the highly-polluted regions is significantly changing (Fig. 2). These regions are mostly industrial and highly urbanized. In general, the visual results correspond to the historical development of regions and settlement pattern.
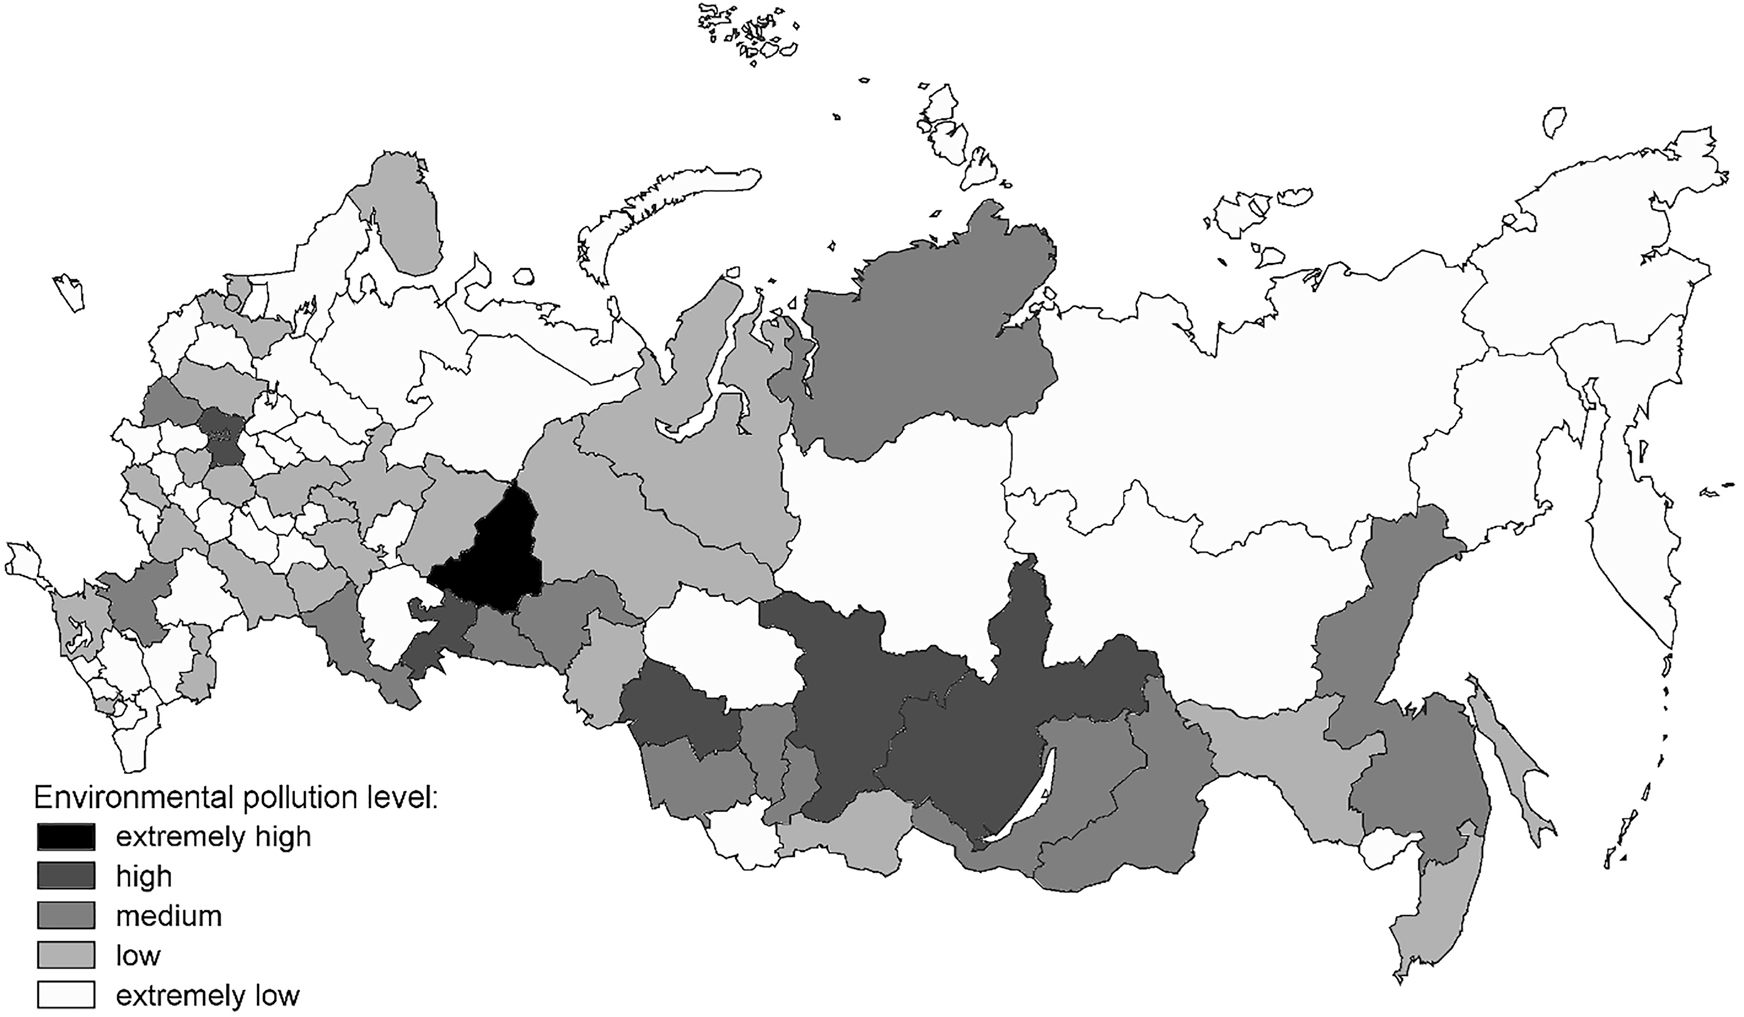
Monitoring-based regional assessment of environmental pollution in urban areas of the Russian Federation in 2018.
Conclusions
In this study we demonstrated how the monitoring data might be used for the assessment of the regional pollution level both in the case of a particular environmental medium and for the environment as a whole. These assessments can be done periodically, annually in our case thereby providing the temporal dynamics of pollution levels and revealing the efficiency of the federal environmental protection programs and mitigation measures taken for each region.
The results of the calculations for 2018 highlighted the regions with adverse environmental conditions, which require the strengthening of measures for environmental protection.
Article note:
Snow cover, atmospheric precipitation, aerosols: chemistry and climate: reports of the III Baikal international scientific conference endorsed by IUPAC (March 23–27, 2020).
Funding source: Basic Research Program for the State Academies of Sciences (partially)
Award Identifier / Grant number: 0148-2019-0009
Funding source: Research Project “Development and improvement of methods and technologies for integrated background monitoring and comprehensive assessment of the environmental state and pollution in the Russian Federation including their dynamics (based on the joint results of RosHydroMet’s monitoring networks)”
Award Identifier / Grant number: АААА-А20-120020490070-3
-
Research funding: This study was carried out in the framework of the Research Project АААА-А20-120020490070-3 “Development and improvement of methods and technologies for integrated background monitoring and comprehensive assessment of the environmental state and pollution in the Russian Federation including their dynamics (based on the joint results of RosHydroMet’s monitoring networks)” and partially under the Basic Research Program for the State Academies of Sciences No. 0148-2019-0009.
References
[1] V. R. Bityukova, M. S. Borovikov. IOP Conf. Ser. Earth Environ. Sci. 107, 012051 (2018), https://doi.org/10.1088/1755-1315/107/1/012051.Search in Google Scholar
[2] V. R. Bityukova, N. S. Kasimov. Geofizika 29, 53 (2012).Search in Google Scholar
[3] G. M. Chernogaeva, A. S. Zelenov. Izv. RAS. Geogr. Ser. 4, 86 (2009).Search in Google Scholar
[4] A. F. Anufrieva, M. S. Zagaynova, T. P. Ivleva, T. N. Liubushkina, I. V. Smirnova. Air Pollution in Cities of Russia: Yearbook, RosHydroMet, Saint Petersburg (2019). ISBN 978-5-9500883-8-4. In Russian.Search in Google Scholar
[5] Russian Statistical Yearbook: Stat. Book, A. Surinov (Ed.), Rosstat, Moscow (2018).Search in Google Scholar
[6] Population of the Russian Federation by municipalities (2019), https://rosstat.gov.ru/storage/mediabank/mun_obr2019_348634.rar (accessed Dec 11, 2019). In Russian.Search in Google Scholar
[7] V. F. Usachev, V. G. Prokacheva. Polluted lands throuth the Russian regions. Hydrographic aspect, Nedra, Saint Petersburg (2004). ISBN 5-94089-028-8. In Russian.Search in Google Scholar
[8] V. G. Prokacheva, V. F. Usachev. Russ. Meteorol. Hydrol. 38, 206 (2013), https://doi.org/10.3103/s1068373913030102.Search in Google Scholar
[9] P. Berkhin. In Grouping Multidimensional Data, J. Kogan, C. Nicholas, M. Teboulle (Eds.), рр. 25–71, Springer, Berlin, Heidelberg (2006).10.1007/3-540-28349-8_2Search in Google Scholar
[10] I. H. Witten, E. Frank. Data Mining: Practical Machine Learning Tools and Techniques, Morgan Kaufmann Publishers, San Francisco, 2nd ed. (2005).Search in Google Scholar
[11] G. M. Chernogaeva, E. A. Zhadanovskaya, L. R. Zhuravleva, Yu. A. Malevanov. Environmental Pollution in Russian Regions at the Beginning of the XXI Century, Polygraph-Plus, Moscow (2019). ISBN 978-5-906644-48-0. In Russian.Search in Google Scholar
[12] H. B. Ross, L. Granat. Tellus B Chem. Phys. Meteorol. 38, 27 (1986), https://doi.org/10.3402/tellusb.v38i1.15063.Search in Google Scholar
© 2022 IUPAC & De Gruyter. This work is licensed under a Creative Commons Attribution-NonCommercial-NoDerivatives 4.0 International License. For more information, please visit: http://creativecommons.org/licenses/by-nc-nd/4.0/
Articles in the same Issue
- Frontmatter
- In this issue
- Preface
- Foreword to the special issue dedicated to the 3rd Baikal International IUPAC Conference on chemistry of snow cover, atmospheric precipitation, aerosols and climate
- Conference papers
- Chemical composition of atmospheric particulate matter in the winter season as indicator of environment quality within urban areas
- Snow samples from settlements of the Murmansk region-genotoxic effects in Drosophila germ cells
- Comparative assessment of fluorine, sodium, and lithium distributions in snow cover in Siberia
- Elemental composition of dust aerosols near cement plants based on the study of samples of the solid phase of the snow cover
- Results of AAS-measurements of atmospheric deposition of copper and lead in the snow cover of Almaty agglomeration
- Climatology of transport and deposition of atmospheric substances of different intensity on the southern Primorye territory by using the meteorological reanalysis data and observations at EANET monitoring station
- Composition of rainfall in the coastal zone of the Kaliningrad region of the Russian Federation (based on data from 2019)
- Chemical and algological composition of the snow cover at the mouth of the Onega river (White Sea basin)
- Assessment of the quality of atmospheric air in woodlands of natural areas based on the intensity analysis of the process of dry deposition of impurities on an artificial underlying surface
- Methodological aspects of snow cover sampling for chemical analysis
- Organic carbon in atmospheric precipitation in the urbanized territory of the South of Western Siberia, Russia
- Monitoring-based assessment of environmental pollution in regions of the Russian Federation
- Estimated acceptable critical load values for the ecosystem at the Russian Far East using EANET monitoring data
- IUPAC Technical Report
- Seabed mining and blue growth: exploring the potential of marine mineral deposits as a sustainable source of rare earth elements (MaREEs) (IUPAC Technical Report)