Estimated acceptable critical load values for the ecosystem at the Russian Far East using EANET monitoring data
-
Anastasiya A. Rychkova


Abstract
Natural ecosystems have become at risk due to the accelerating industrial and technological development over the past century accompanied by increasing pollutant emissions into the atmosphere. It realized mostly by means of matter overloads into nature areas caused by deposition of pollutants, especially sulfur and nitrogen oxides, which can significantly affect to change ecosystem state and on substance migration. The Critical Loads method is used to assess the sustainability of ecosystems exposed to atmospheric deposition. The corresponding maximum intake of sulfur and nitrogen is estimated based on the scheme of the stationary mass balance of ions in soil solutions. The critical loads were calculated for estimating the risk threshold of acid deposition for the ecosystem of the Russian Far East using the results of regular monitoring at the EANET Primorskaya station.
Critical load (CL) is defined as “a quantitative estimate of an exposure to one or more pollutants below which significant harmful effects on specified sensitive elements of the environment do not occur according to present knowledge” (Nilsson and Grennfelt [1]). The value of CL does not represent the degree of qualitative changes and disruption of functioning of the ecosystem, it quantifies the acceptable (“environmentally safe”) value of the impact, presented in this approach as the input of pollutants to ecosystems. The target media for such investigation depends on, from one side, type of the ecosystems, and from other side, the sensitive component which changes might cause a degradation of production, or biodiversity, or whole ecosystem state. Generally CLs are classified for the inland aquatic and terrestrial ecosystems. The first is evaluated the acidity of the natural surface waters based on application of the Steady State Water Chemistry (SSWC) Method [2]. The other one is evaluated the changes of soil properties including soil solution composition, microbiota activities, negative agents for roots, etc. by improved modelling approaches using steady-state mass balance methods [3].
The equations used for calculations of the CL value include a quantitative assessment of the maximum possible set of parameters characterizing both the cycle of matter in ecosystems and geochemical indicators. Using soil as the target reactive medium the fluxes of chemical compounds from the atmosphere, undersoil bedrocks, oxidation and reduction processes by biota and through vegetation life cycles are aggregated into simplified chemical reaction pool for estimation of key parameter values to evaluate whether sustainability of ecosystem is assumed or not. This method is recommended as the basic approach for critical loads calculations by the Coordination Centre for Effects (CCE, International Cooperative Programme on Modelling and Mapping [4]) and is successfully applied in many countries.
The values of critical loads can be derived from monitoring data analysis and field experiments (so-called empirical critical loads), as well as by applying mathematical methods for calculating the values of critical loads using biogeochemical steady-state mass balance models or simplified dynamic approach.
Depending on the nature of the impact on the components of the environment and the resulting negative effects, nitrogen and sulfur compounds (pollutants) are divided into the following groups:
contributing acidification of ecosystems – sulfur and nitrogen oxides (SO2, SO4 2−, NO3 −, NO2);
contributing eutrophication of ecosystems – nitrogen compounds (NOx, NH4 +).
Several parameters that characterize the stability of ecosystems in relation to these groups of pollutants are successively calculated to obtain the values of the critical loads of sulfur and nitrogen:
the maximum sulfur load (CLmax (S)), it defines the acceptable parameters of the input of acidifying compounds in ecosystems, providing that the alkali-acid conditions in soils do not fall below the critical (threshold) concentration established for the corresponding plant community.
the minimum nitrogen load (CLmin (N)), it characterizes the lowest level of nitrogen input, which provides the protection of the productivity of the considered ecosystems.
load for “nutrient” nitrogen (CLnutr (N)), it allows to quantify the input of nitrogen which does not cause an excess of this element in ecosystems (eutrophication). This prevents the possibility of changes in the species composition and diversity of communities.
the maximum nitrogen load (CLmax (N)), it determines the acceptable parameters of nitrogen oxides input to ecosystems, providing that the acidity level does not fall below the critical level and, at the same time, the supply of nutrients to the soil is being favourable for biota [5].
The estimation of CL for experimental areas is carried out using characteristics of ecosystems and values of their derived indicators, such as: type and soil texture, type of vegetation, average annual temperature, rock weathering, uptake and immobilization of elements, etc., applying the methodology based on the usage of the ion balance equation in soil solution [6].
In our work, the calculation of the CL was carried out using the data of monitoring of environmental pollution obtained from the station “Primorskaya” of the international EANET network [7]. EANET is the Acid Deposition Monitoring Network in East Asia, a coordinated monitoring network under the umbrella of intergovernmental agreement of 13 countries. One of the main goals of the EANET is to provide the common understanding on the acid deposition state and related regional environmental pollution over the East Asia region [8]. The instrumental monitoring covers atmospheric air pollutant and depositions, surface water (inland aquatic) chemistry, soil property tracing and vegetation conditions. All countries perform a unified measurement program at the sets of network sites of both atmospheric and ecological monitoring. The obtained data are related the acidified compounds in air and aerosols, wet deposition (with precipitation) and surface waters as well as in soil matters and solutions. The combination and common evaluation of data sets could provide the year-to-year information for assessment of acidified element cycling dynamics and impact of atmospheric deposition on natural ecosystems in comparison with resistant properties of target media (surface waters or soils).
In Russia the observations under the coupled monitoring programmes of the acidified compounds (mainly, of sulfur and nitrogen) in the atmosphere and related environment media were organized in 2002 in the southern part of Primorsky Krai on the basis of the 1st category Hydrological station of the Primorsky Territorial Administration for Hydrometeorological and Environmental Monitoring [9] (43°37′45′′ N, 132°14′13′′ E, 85 m height above sea level) in the village of Kamenushka, Ussuriysky district and forest sites. For the purpose of our study we have used the monitoring data on wet deposition of dissolved main chemical compounds obtained at the atmospheric monitoring station and results of soil properties survey at the small river catchment in its vicinity.
To determine the maximum critical load for sulfur, we use the following equation:
where: Сt is the hydrothermic coefficient; ANCle(crit) is acceptable leaching with soil-ground runoff; BCwe and BCup are weathering and uptake of base cations respectively; BCdep is deposition of base cations.
Hydrothermic coefficient characterizes the period of the year with temperatures above 5 °C. 5 °C is the average daily air temperature at which the soil begins to warm up. Below this value, there is no significant percolation of precipitation through soil. Hydrothermic coefficient is calculated as the ratio of the sum of temperatures above 5 °С (is given in Climate Atlas [10]) to the total annual sum of temperatures:
where: 3.5 °С is average annual air temperature on the territory of the ecosystem.
Acceptable leaching with soil-ground runoff (ANCle(crit)); weathering (BCwe) and uptake (BCup) of base cations are calculated with the use of data characterizing the properties of normal soils. Brown forest soils (cambisols) are typical normal ones for the ecosystem under study. The parameters for this type of soil are presented in Table 1.
Parameters used to calculate the values of critical loads of sulfur and nitrogen in an ecosystem located on the territory of the typical normal soils [6].
| Normal soils | Wr | D | C/N | K1 (if 14 ≤ C/N ≤ 20) | K2 | Nu* | Kgibb |
|---|---|---|---|---|---|---|---|
| Brown forest | 1750 | 0.5 | 16.67 | 0.3 | 2 | 1.62 | 250 |
| Unit of measurement | eq/ha/year/m | m | – | – | – | eq/ha/year | m6/eq2 |
We use next formula to calculate the weathering of base cations [11]:
where: Wr determines the ability of the soil to weathering – chemical weathering of soil minerals (eq/ha/year/m), and D – thickness of the soil layer, (m). Then, using eq. (2), we obtain:
To calculate the acceptable leaching with soil-ground runoff we use the following formula:
where: Q is the difference between precipitation and evapotranspiration. The average annual precipitation for this area is 740 mm [10], and the average annual evapotranspiration is 487 mm, as we can see on the world map in Fig. 1.
![Fig. 1:
Annual evapotranspiration on the territory of the ecosystem under study [12].](/document/doi/10.1515/pac-2021-0316/asset/graphic/j_pac-2021-0316_fig_001.jpg)
Annual evapotranspiration on the territory of the ecosystem under study [12].
So, the difference demonstrates the prevailing atmospheric water input:
To calculate the acceptable leaching we also need Gibbs constant (Kgibb), which is 250 m6/eq2 according to Table 1, and [H] (crit) – critical (threshold) value of acidity. We take value 0.03 g eq/m3 for deciduous forests [5]. Using eq. (3), we get:
Data on depositions of base cations (BCdep) were derived from long-term observations at Primorskaya station [13].
Summing up the deposition of Ca2+, Mg2+, K+, Na+, we obtain the value 5.8 [eq/ha/year].
So, the derived values for calculation of the maximum sulfur load are presented in Table 2.
Derived values for calculation of the maximum sulfur load (all parameters except Ct are given in eq/ha/year).
| Parameters | Сt | BCwe | ANCle(crit) | BCdep | BCup |
|---|---|---|---|---|---|
| Values | 1.56 | 875 | −9.3 | 5.8 | 0.97 |
Thus, using (1), we obtain:
То get the minimum nitrogen load we use the following equation:
where: Ni* is the immobilization of nitrogen from atmospheric deposition; Nu* is the nitrogen uptake by soil (we use the value from Table 1, equal to 1.62 eq/ha/year). For the immobilization of nitrogen deposition, we will carry out the calculation according to the formula presented below:
where: Ntd is the total nitrogen deposition from the atmosphere, according to the deposition estimates obtained earlier [9], Ntd is 7.424 eq/ha/year; coefficients K1, K2 are used for appropriate C/N ratios in the active soil layer, they are equal to 0.3 and 2, respectively, according to Table 1. Сt we have calculated earlier. Then, using eq. (5):
Summing up Ni* and Nu* (eq. (4)) we get the value of the minimum nitrogen load, it is 3.36 [eq/ha/year].
The maximum nitrogen load are evaluated through approach of the similarity of effects provided by S uptake plus some positive role of accepted N and can be calculated using the following equation (in assuming the whole absence of sulfur compound flux from the atmosphere):
In a presence of sulfur deposition the total CL should take into account the combination of both element substances entering the soil (see Fig. 2). Values of the maximum sulfur load and the minimum nitrogen load were derived above, so applying formula (5) we get:
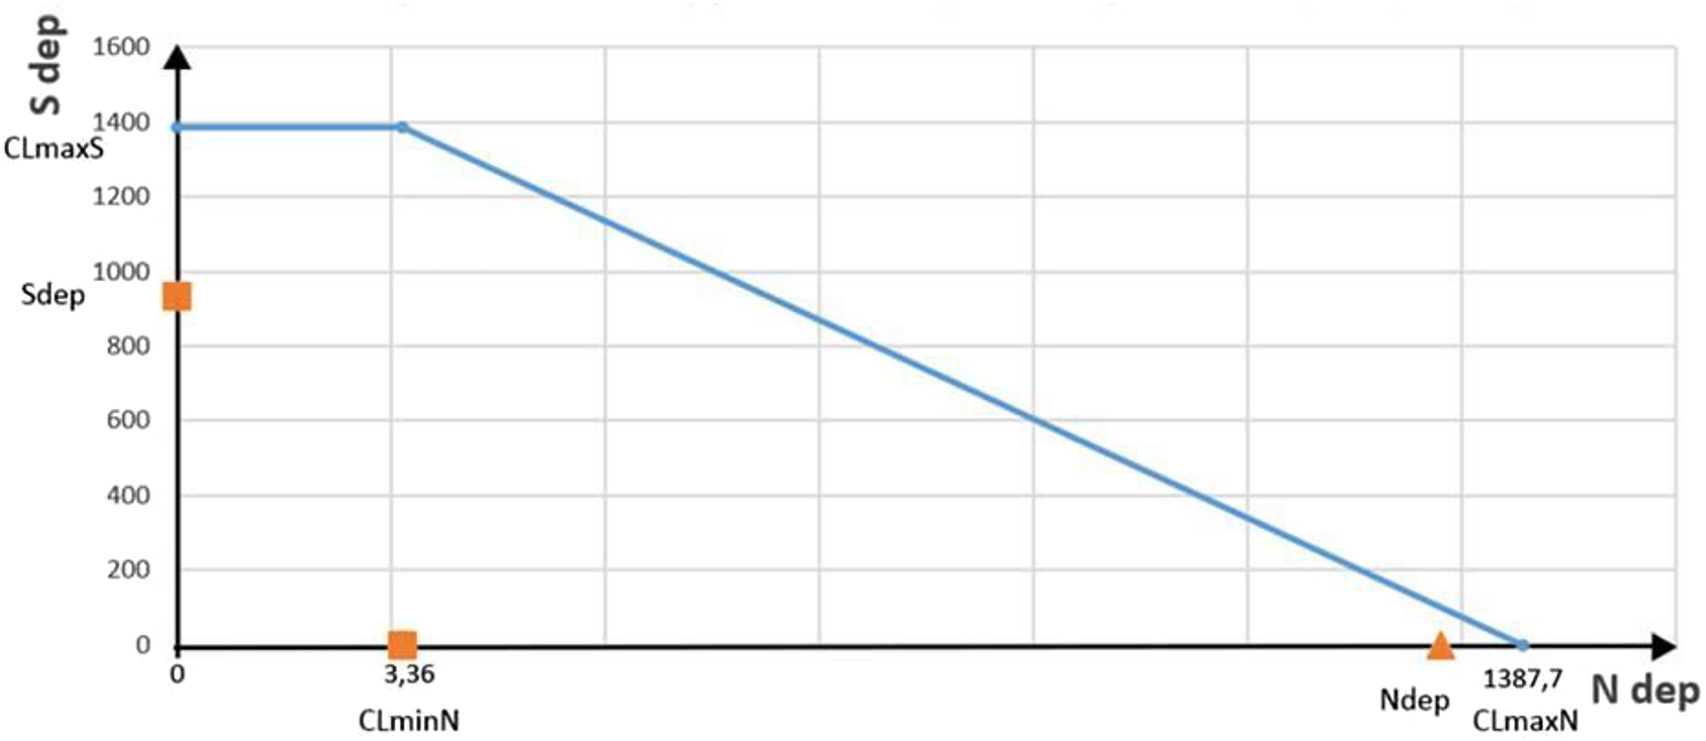
Relationship between depositions and critical loads of sulfur and nitrogen, eq/ha/year.
Now we can compare the calculated critical loads with the deposition data at Primorskaya station. Values of sulfur and nitrogen deposition were derived from long-term observations at Primorskaya station [8]. Total sulfur deposition (Sdep) is 932.79 eq/ha/year, total nitrogen deposition (Ndep) is 896.8 eq/ha/year.
Fig. 2 illustrates the relationship between depositions and critical loads of sulfur and nitrogen.
As shown in Fig. 2, the deposition does not exceed the critical loads, so the ecosystem is at sustainable state to atmospheric pollution with sulfur and nitrogen compounds, despite the level of acid deposition is significant according to the monitoring results.
As a result, the values of critical loads were determined in a first approximation to assess the acceptable level of the impact of the atmospheric deposition of sulfur and nitrogen compounds on the terrestrial ecosystem of the Far East. The obtained values of the CL levels correspond to representative ranges for the south of the forest zone and the forest-steppe zone of the European part of Russia [14]; nevertheless, these estimates require clarification, in particular, it would be better to use more experimental values if it is available.
This first result of relatively rough estimation provides the simplified evaluation of the quantitative level of effect for the part of region under the transport and agricultural development with a considerable surplus of impact due to transboundary air pollution from the countries to the west and southwest. Natural ecosystems of deciduous (and long term restoring cedar) forests might be at risk due to rain acidification or eutrophication. More estimation of CL in terms of extension through region and time periods could provide a geo-basis for assessment of sustainability of the natural environment in comparison of monitoring data and long term forecasts of acid depositions.
This study was carried out in the framework of the Research Project АААА-А20-120013190049-4 “Development of methods and technologies for monitoring of environmental pollution under the influence of transboundary pollutants transport (UNECE: EMEP, ICP IM) and acid deposition in East Asia (EANET)”. The part of data was obtained and performed under the research theme of the Plan of Basic Scientific Research of the State Academies of Sciences No. 0148-2019-0009, Task IG RAS AAAA-A19-119022190172-5 (FMGE-2019-0004).
Article note:
Snow cover, atmospheric precipitation, aerosols: chemistry and climate: reports of the III Baikal international scientific conference endorsed by IUPAC (March 23–27, 2020).
References
[1] J. Nilsson, P. Grennfelt (Eds.), Critical Loads for Sulphur and Nitrogen, UNECE/Nordic Council Workshop Report, Nordic Council of Ministers, Copenhagen (1988).Search in Google Scholar
[2] A. Henriksen. Water Air Soil Pollut. 85, 2437 (1995), https://doi.org/10.1007/bf01186199.Search in Google Scholar
[3] G. J. Reinds, M. Posch, J. Aherne, M. Forsius. In Critical Loads and Dynamic Risk Assessments: Nitrogen, Acidity and Metals in Terrestrial and Aquatic Ecosystems, W. de Vries, J.-P. Hettelingh, M. Posch (Eds.), pp. 403–417, Springer Netherlands, Dordrecht (2015).10.1007/978-94-017-9508-1_15Search in Google Scholar
[4] M. Posch, P. A. M. de Smet, J. P. Hettelingh, R. J. Downing. In Calculation and Mapping of Critical Thresholds in Europe: Status Report 1995, p. 197, RIVM/CCE, Bilthoven, The Netherlands (1995).Search in Google Scholar
[5] I. I. Tolpeshta. In Methodological Approaches to the Calculation of Critical Loads of Nitrogen and Sulfur Compounds on Ecosystems, Aquarius Ltd, Tula (2014).Search in Google Scholar
[6] V. N. Bashkin. The use of soil-biogeochemical parameters in calculating critical loads of acidity on ecosystems of East Asia, Geogr. Nat. Resour. 22 (2007).Search in Google Scholar
[7] EANET Site Information – Primorskaya Russia. Available: https://www.eanet.asia/location/primorskaya/.Search in Google Scholar
[8] Towards Clean Air for Sustainable Future in East Asia through Collaborative Activities. Fourth Report for Policy Makers. Secretariat for the EANET/UNEP Asia and Pacific Office and Network Center for the EANET, Japan, 2016.Search in Google Scholar
[9] The 1st Category Hydrological Station of the Primorsky Territorial Administration for Hydrometeorological and Environmental Monitoring. Available: http://www.primgidromet.ru/about/karta_seti/primorskaya.Search in Google Scholar
[10] A. N. Afonin, Y. S. Li, K. L. Lipiyaynen, V. Y. Tsepelev. In Economic Plants and their Diseases, Pests and Weeds [Online], A. N. Afonin, S. L. Greene, N. I. Dzyubenko, A. N. Frolov (Eds.) (2008), Available: http://www.agroatlas.ru/en/content/Climatic_maps/Sum_t/Sum_t5/index.html.Search in Google Scholar
[11] V. N. Bashkin, A. S. Kurbatova, D. S. Savin. Methodological Framework for Assessing Critical Loads of Pollutants on Urban Ecosystems, Available: https://gosthelp.ru/text/Metodologicheskieosnovyoc.html.Search in Google Scholar
[12] Average Annual Evapotranspiration on the World Map – ArcGIS. Available: http://www.arcgis.com/apps/OnePane/main/index.html?appid=b1a0c03f04994a36b93271b0c39e6c0f.Search in Google Scholar
[13] Y. A. Bujvolov, S. G. Paramonov, V. Y. Vertyankina, S. A. Gromov, E. S. Konkova, A. M. Trifonova-Yakovleva, B. V. Pastukhov, A. V. Srybnyj. Long-Term State of Pollution of Natural Environments at Stations of the Comprehensive Background Monitoring of the CIS Countries. Review of the Background State of the Environment on the Territory of the CIS Countries in 2015, pp. 96–173, Yu. A. Izrael Institute of Global Climate and Ecology, Moscow (2017).Search in Google Scholar
[14] E. S. Zhigacheva, S. A. Gromov. In All-Russian Scientific-Practical Conference “Modern Trends and Prospects of Development of Hydro-Meteorology in Russia”, pp. 141–145, Irkutsk State University, Irkutsk (2020).Search in Google Scholar
© 2022 IUPAC & De Gruyter. This work is licensed under a Creative Commons Attribution-NonCommercial-NoDerivatives 4.0 International License. For more information, please visit: http://creativecommons.org/licenses/by-nc-nd/4.0/
Articles in the same Issue
- Frontmatter
- In this issue
- Preface
- Foreword to the special issue dedicated to the 3rd Baikal International IUPAC Conference on chemistry of snow cover, atmospheric precipitation, aerosols and climate
- Conference papers
- Chemical composition of atmospheric particulate matter in the winter season as indicator of environment quality within urban areas
- Snow samples from settlements of the Murmansk region-genotoxic effects in Drosophila germ cells
- Comparative assessment of fluorine, sodium, and lithium distributions in snow cover in Siberia
- Elemental composition of dust aerosols near cement plants based on the study of samples of the solid phase of the snow cover
- Results of AAS-measurements of atmospheric deposition of copper and lead in the snow cover of Almaty agglomeration
- Climatology of transport and deposition of atmospheric substances of different intensity on the southern Primorye territory by using the meteorological reanalysis data and observations at EANET monitoring station
- Composition of rainfall in the coastal zone of the Kaliningrad region of the Russian Federation (based on data from 2019)
- Chemical and algological composition of the snow cover at the mouth of the Onega river (White Sea basin)
- Assessment of the quality of atmospheric air in woodlands of natural areas based on the intensity analysis of the process of dry deposition of impurities on an artificial underlying surface
- Methodological aspects of snow cover sampling for chemical analysis
- Organic carbon in atmospheric precipitation in the urbanized territory of the South of Western Siberia, Russia
- Monitoring-based assessment of environmental pollution in regions of the Russian Federation
- Estimated acceptable critical load values for the ecosystem at the Russian Far East using EANET monitoring data
- IUPAC Technical Report
- Seabed mining and blue growth: exploring the potential of marine mineral deposits as a sustainable source of rare earth elements (MaREEs) (IUPAC Technical Report)