Feasibility of multifunction calibration of H+-responsive glass electrodes in seawater (IUPAC Technical Report)
-
Daniela Stoica
 ,
Paola Fisicaro
,
Paola Fisicaro


Abstract
Seawater pH values are of the highest relevance in marine chemistry studies, not only through being acidity indicators but also due to the control provided by H+(aq) over the various simultaneous equilibria occurring in seawater. Although the concept of
1 Introduction
Measurement of pH and the study of hydron transfer reactions in seawater are critical areas of marine chemistry, requiring a proper metrological approach.
Natural seawaters can be looked upon as multi-electrolyte solutions with typically high ionic strengths (Im ≈ 0.67 mol kg−1). Moreover, ion concentrations of the dissolved salts strongly influence the pH value, by changing both H+ concentration due to simultaneous equilibria (e.g., association with SO42−) and activity coefficients due to the complexity of the saline matrix.
The most common and fastest way of measuring pH in routine analysis is the classical potentiometric method. Glass electrodes are sensitive to H+. An electrochemical potential difference between the electrode surface and the sample solution is measured potentiometrically against a reference electrode of constant potential, also called an electrode of second kind, typically a silver–silver chloride electrode:
The potential difference which occurs in the cell varies linearly with pH according to the analytical law that relates the measured potential, Ecell, with the activity, a, of the ion H+,
Here, k′ is the coefficient of
The cell potential is described by Ecell = (Eref + Elj) − Eg.el, where Eref represents the reference electrode potential, Elj is the liquid junction potential between the electrolytes of the two half-cells, and Eg.el is the glass electrode potential.
Buffer solutions recommended for calibration of pH instruments cover only pH measurements in dilute solutions (ionic strength, Im ≤ 0.1 mol kg−1 H2O) [2]. Such certified reference buffers are widely available, and practitioners tend to use them for all-purpose measurements, i.e., even when they are not fit for the purpose of the measurement. Since seawater has a high ionic strength and ocean water pH varies worldwide in a very narrow range, instruments with well-adapted calibration strategies need to be used if exemplar pH data are to be obtained. The development of a rigorous calibration methodology is based on the availability of appropriate buffers in a matrix having a composition representative of the real samples. In such a way, the residual liquid junction potential appearing when standard solutions used for calibration are replaced by the tested real solution is minimized, thus reducing the uncertainty of pH measurement results.
Assignment of reference pH values to dilute (Im ≤ 0.1 mol kg−1) primary standard solutions relies on the measurement of Harned cell potentials, in conjunction with the Nernst equation and chloride ion activity coefficients,
Despite the importance of pH, conceptually defined as
The pHT measurement option using UV–Vis spectrophotometry with m-cresol purple indicator has gained support as an alternative measurement procedure which, contrary to potentiometry which simply senses H+ (when electrodes have been properly selected in order to avoid interferences and mixed responses), senses both H+ and
For the sake of harmonisation of seawater acidity measurements and to ensure the quality of results, it is urgent to clarify which are the recommended methods and procedures, thus avoiding the current unfortunate situation of confusion among oceanographers, chemists, and other experts and practitioners on which parameter is being considered, measured, reported, etc.
The Guide to Best Practices for Ocean CO2 measurements [12] contains a reference procedure, SOP6a, describing the method to be used for the potentiometric determination of the pH of seawater on the total hydrogen ion concentration pH scale. However, the cited document recommends using in-house prepared Tris–Tris·HCl buffer solutions, and a measurement precision (i.e., not a total measurement uncertainty) that can reach 0.003 in pHT is mentioned. Other studies [13] have been done using spectrophotometric calibration of electrodes but without an uncertainty statement. According to VIM [14], the metrological traceability is defined as a “Property of a measurement result whereby the result can be related to a reference through a documented unbroken chain of calibrations, each contributing to the measurement uncertainty.” It is thus clear that in the absence of a traceability chain, a complete uncertainty budget cannot be evaluated. That is why, for example, in the IOC/UNESCO Sustainable Development Goal Indicators, Methodology for 14.3.1 related to “Average marine acidity (pH) measured at agreed suite of representative sampling stations” [15] such measurements were identified as having an undefined quality but nevertheless considered useful in the identification of coastal ocean acidification hot spots and prioritizing future monitoring plans [16].
This work presents a study which aims to demonstrate the feasibility of using potentiometry to determine pHT values by transposing the method applied for aqueous dilute media including an uncertainty budget evaluation. The proposed practice will contribute to establish comparability for the potentiometric assignment of both pH and pHT values in the routine analysis of seawater samples by calculating the conversion factors between the different scales and also the equivalence of pHT measurement results obtained with different techniques. The study is based on the use of high-order Tris–Tris·HCl reference buffer solutions prepared in a seawater background [8] and traceable to the Laboratoire de Métrologie et d’Essais (LNE) pHT standard measurement procedure.
The assignment of such pH and pHT values to reference buffer standards falls in the mission and scope of action of National Metrology Institutes, NMIs, which can certify the buffers for these kinds of quantities and make them available to the users who can then easily perform calibration of the pH meter setups in terms of the acidity parameter of their choice, E vs. pH or pHT.
2 Experimental
2.1 Reagents and solution preparation
In the present study, in order to allow a multi-point calibration for potentiometric measurements, three Tris–Tris·HCl buffers of different molality ratios, prepared in an artificial seawater matrix, were characterized by the pH primary method, covering a range of pH close to the expected values of seawater (7.8 to 8.3) [17]. These solutions were prepared in an artificial seawater (ASW) background representative of practical salinity [18], Sp = 35. A slightly different ASW formulation was used with respect to the reference solutions available from SCRIPPS [8]. According to K. Pratt [17] who focuses on an 0.04 equimolal Tris–Tris·HCl buffer solution, this difference modifies the pHT value by 0.002 only.
Saline buffer solutions were prepared gravimetrically from stock solutions (see Table 1) with ultrapure water. Estimated conventional mass was corrected for buoyancy to estimate the real mass.
Details on stock solutions used to prepare the buffer solutions.
| Stock solution | Compound | Amount content/mol in 1 kg of stock solution | Remarks |
|---|---|---|---|
| 1 | KCl | 0.049 56 | Mass fraction of KCl based on halide content equals (99.877 ± 0.036) % |
| CaCl2 | 0.050 45 | Because of the hygroscopicity of solid salts, CaCl2 was added from stock solutions with an amount content of (0.510 66 ± 0.000 21) mol in 1 kg of solution | |
| MgCl2 | 0.2585 | Because of the hygroscopicity of solid salt, MgCl2 was added from stock solutions with an amount content of (2.054 79 ± 0.000 77) mol in 1 kg of solution | |
| 2 | NaCl | 1.666 | Mass fraction of salt based on halide content equals (99.916 ± 0.037) % |
| 3 | Na2SO4 | 0.4117 | Mass fraction of salt based on anion content equals (100.003 ± 0.027) % |
| 4 | HCl | 0.105 16 | Hydrochloric acid solution was prepared from commercial 30 % HCl solution purchased from Merck |
| Amount content of chloride estimated by titrimetry with an uncertainty of 0.14 % | |||
| 5 | Tris* | 0.6558 | NIST SRM 723e |
-
*Tris, 2-amino-2-(hydroxymethyl)propane-1,3-diol.
The various salts, sodium chloride, potassium chloride, magnesium chloride, calcium chloride, and sodium sulfate, were purchased from VWR and characterized by coulometry. Tris(hydroxymethyl)methylamine was purchased from NIST (SRM723e).
The composition of the artificial seawater matrix is given in Table 2 together with the target value for the three buffers used for this study.
Reference calibration buffer solutions in the artificial seawater background composition. The total molality of Tris is 0.08 mol kg−1. The molality of sodium chloride corresponds to m − mHCl, where m = 0.426 64 mol kg−1. The chloride molality,
| Buffer | m Tris:mTris.HClm/mol kg−1 | Molality m/mol kg−1 | m Cl/mol kg−1 | |||||
|---|---|---|---|---|---|---|---|---|
| HCl | NaCl | KCl | MgCl2 | CaCl2 | Na2SO4 | |||
| Target | Fixed value | 0.426 64 – mHCl | 0.010 58 | 0.055 16 | 0.010 77 | 0.029 26 | ||
| Buffer 1 | 0.035:0.045 | 0.034 99 | 0.3915 | 0.010 60 | 0.055 27 | 0.010 79 | 0.0292 | 0.5692 ± 0.0010 |
| Buffer 2 | 0.04:0.04 | 0.040 00 | 0.3866 | 0.010 58 | 0.055 18 | 0.010 77 | 0.0293 | 0.5691 ± 0.0010 |
| Buffer 3 | 0.06:0.03 | 0.060 00 | 0.3666 | 0.010 58 | 0.055 16 | 0.010 77 | 0.0293 | 0.5691 ± 0.0010 |
Minor deviations from target composition can be noticed for some individual components of artificial seawater but this does not significantly affect the molality of chlorides in the final buffer solution, which has an estimated expanded uncertainty (k = 2) of 1 × 10⁻³ mol kg−1 H2O.
2.2 Calibration procedure
The calibration method described by the IUPAC [2] can be adapted to the desired quality of the measured value, i.e., the aimed target uncertainty. A two-point calibration with buffer solutions bracketing the pH value of the analyzed solution is generally adopted, enabling obtaining pH data with an uncertainty (k = 2) of 0.02 to 0.03 in pH.
A Metrohm 867 pH Module and a new combination of pH glass electrodes, two Unitrode and two Primatrode electrodes, were used in conducting potentiometric measurements at (25 ± 0.05) °C. The two types of electrodes differ by the nature of their diaphragm that allows a slow constant flow of the reference electrolyte solution into the sample, thus affecting the liquid junctions (interface that, for the establishment of the electrical circuit for measuring the potential of the electrochemical cell, allows electrolytic contact commonly between a saturated solution of KCl from the interior of the reference electrode and the solution to be analyzed). According to the manufacturer, Unitrode electrodes have a fixed ground-joint diaphragm [flow rate for c(KCl) = 3 mol L−1 between 3 and 30 μL h−1], enabling them to be insensitive to contamination, whereas Primatrode electrodes have a ceramic diaphragm (flow rate for c(KCl) = 3 mol L−1 between 3 and 10 μL h−1), thus a recommended usage in clear aqueous solutions.
The temperature of 25 °C is one of standardized conditions for spectrophotometric pHT measurements and would enable obtaining equivalence between the two routine methods employed to obtained pHT values, i.e., potentiometry and spectrophotometry.
In order to check the electrode’s performance, prior to pH measurements, each electrode was calibrated using three diluted standard buffer solutions traceable to SI (nominal pH 4, 7, and 10). The calibration parameters were also calculated manually using the operating principle of the pH meter. Thus, for each electrode, the measured potentials, E, were plotted as a function of the standard pH values used for calibration. Excellent agreement between the calculated and displayed calibration parameters (slope and pH(0)) was obtained. For all electrodes, the practical slopes were within 1 % with respect to the theoretical Nernst slope, indicating that the electrodes have a Nernstian behavior and the quality required to initiate measurements. Furthermore, pH values were assigned using the determined calibration parameters (i.e., without resorting the pH meter’s internal system software).
When measuring in unknown samples, the magnitude of the liquid junction potential cannot be quantified, and a rigorous bottom-up uncertainty budget cannot be established using the GUM approach. Hence, the uncertainty of pH and pHT measurements was estimated based on the guidance proposed in the ISO 5725-2 document [19] that recommends using trueness, repeatability, and intermediate precision to calculate the uncertainty of a measured value. For this purpose, a standard buffer solution different from that used for calibration, namely of pH 9, was used.
The same methodology, i.e., a two-point bracketing calibration procedure and one intermediate point as the control, was applied to perform pH and pHT measurements of saline Tris–Tris·HCl buffer solutions. Accuracy was estimated based on the potentiometric measurements performed at the primary level with a Harned cell.
3 Results and discussion
Three Tris–Tris·HCl buffer solutions were prepared in artificial seawater, Sp = 35. These buffers were characterized in terms of pH and pHT using a primary pH system.
The pH values were calculated based on the experimentally measured acidity function and the Pitzer-modeled activity coefficient of chloride, represented in Eq. (2) by the first and second terms of the right side.
The free molalities of H+,
pHT values were experimentally determined using the protocol described in the literature [17, 21], Eq. (3):
where Ecell is the potential of the Harned cell for the buffer, corrected to p(H2) = 1 atm (101.325 kPa), the partial pressure of hydrogen gas used in electrochemistry in preference to 100 kPa; R and F are the gas and Faraday constants, respectively. E0* represents the standard potential of the Ag/AgCl electrode in pure ASW of the same nominal salinity. E0* differs from the well-known E0 defined as the standard potential of the Ag|AgCl electrode in pure water media and used for primary pH determinations.
Table 3 presents the primary pH and pHT values reported with assigned overall expanded uncertainty (k = 2, for a confidence level of approximately 95 %) that includes contributions from the characterization, long-term stability, and homogeneity of buffer solutions. For primary pH, the uncertainty contribution related to characterization neglects contribution coming from the activity coefficient of chloride.
Primary pH and pHT values with associated expanded uncertainty, U (k = 2). These three buffers were used in two sets of experiments.
| Buffer | Certified value | |
|---|---|---|
| pH | pHT | |
| Buffer 1 | 7.837 ± 0.005 | 7.622 ± 0.005 |
| Buffer 2 | 8.313 ± 0.005 | 8.101 ± 0.005 |
| Buffer 3 | 8.425 ± 0.005 | 8.209 ± 0.005 |
The three Tris–Tris HCl buffers were treated as unknown samples and their pH was determined at 25 °C with different combination electrodes (Unitrode and Primatrode) after three-point calibration with classical buffer solutions of low ionic strength (nominal pH 4, 7, and 10).This experiment is representative of the current practice in use, in the absence of quality control standards for seawater pH measurements.
Buffers 1 and 3 were used to calibrate the combination glass electrode setup, whereas Buffer 2 was treated as an unknown sample.
The expanded uncertainty (k = 2) assigned to the measured pH values was estimated based on the global approach with the ISO 5725-2 document [19] using a pH 9 standard buffer solution as QA/QC. The different sources of uncertainty together with their estimation are given in Table 4. Intermediate precision [14] was issued from measurements performed on three series of three measurements.
Sources of uncertainty for pH measurements with Unitrode 1 based on the ISO 5725-2 approach, in which p corresponds to the number of series and N corresponds to the number of measurements for each series. Ei represents the result within each series, E is the reference value, sW is variance of inter-series repeatability, and sr is variance of intra-series repeatability.
| Formula | Value | Contribution to the overall uncertainty budget (%) | |
|---|---|---|---|
| Standard | Based on standard uncertainty of the standard solution according to the certificate | 2.5 × 10⁻⁵ | 10.5 |
| Trueness |
|
5 × 10⁻⁵ | 20.9 |
| Intermediate precision |
|
1.5 × 10⁻⁴ | 65.1 |
| Resolution (number of digits displayed by the pH meter) |
|
8 × 10⁻⁶ | 3.5 |
| Overall estimation | – | 2.4 × 10⁻⁴ | – |
| Expanded uncertainty, U (k = 2) | 0.03 | ||
Table 5 presents a summary of the pH values obtained for the three saline buffer solutions and their associated expanded uncertainty obtained in the first set of experiments.
pH value results for Tris–Tris·HCl in artificial seawater buffer solutions, treated as unknown samples, at 25 °C, with associated expanded uncertainty, U (k = 2).
| Buffer | Certified pH value | pH Unitrode 1 | pH Unitrode 2 | pH Primatrode 1 | pH Primatrode 2 |
|---|---|---|---|---|---|
| Buffer 1 | 7.837 ± 0.005 | 7.72 ± 0.03 | 7.74 ± 0.05 | 7.71 ± 0.02 | 7.75 ± 0.01 |
| Buffer 2 | 8.313 ± 0.005 | 8.20 ± 0.03 | 8.22 ± 0.05 | 8.20 ± 0.02 | 8.24 ± 0.01 |
| Buffer 3 | 8.425 ± 0.005 | 8.32 ± 0.03 | 8.33 ± 0.05 | 8.30 ± 0.02 | 8.35 ± 0.01 |
The primary certified pH values were further compared with the results obtained using usual commercially available buffers with low ionic strength. This comparison revealed a difference greater than 0.1 pH, which is in good agreement with other published studies [22].
All pH values obtained with the pH meter are lower than the certified pH values, this difference being significantly greater than the expanded uncertainty. The existence of such a bias may come from an inappropriate calibration protocol and can be accounted for as a systematic error, due to the different ionic strengths affecting the liquid junction potential. Indeed, for calibration, several IUPAC documents recommend using buffer solutions that match the analyzed sample in terms of composition and ionic strength. However, when this is not possible, the users have two possibilities: (A) to integrate this bias into the result by performing the necessary correction or (B) to add it as a contribution to the overall uncertainty budget. The first option, (A), seams easier to apply, but in order to guarantee good data quality, several requirements must be satisfied:
ensure that the correction covers the range of seawater pH. To make this evaluation, measurements with solutions of different pH values need to be carried out.
choose a certified reference material representative of the seawater media and possibly traceable to SI [23], in order to ensure the SI traceability of the final pH results.
the operated correction has its own uncertainty that must be assessed and included in the overall pH uncertainty budget. The main sources contributing to the correction uncertainty would come from the standard solutions used to determine the correction, the reproducibility of measurement results, and the dispersion of the correction factors associated to their fluctuation in a studied pH range.
Table 6 summarizes the corrections to be applied for pH results in the seawater matrix and their associated expanded uncertainty (k = 2) for each studied glass electrode. The uncertainty of corrections is calculated with Eq. (4) and considers the uncertainty of the standard solution used to assess the value of correction and the repeatability obtained as standard deviation of the measured pH values.
Corrections to be applied for pH results in the seawater matrix with their associated expanded uncertainty (k = 2) for each studied combined glass electrode.
| Buffer | ΔpH Unitrode 1 | ΔpH Unitrode 2 | ΔpH Primatrode 1 | ΔpH Primatrode 2 |
|---|---|---|---|---|
| Buffer 1 | 0.12 ± 0.03 | 0.10 ± 0.05 | 0.13 ± 0.02 | 0.09 ± 0.01 |
| Buffer 2 | 0.11 ± 0.03 | 0.10 ± 0.05 | 0.11 ± 0.02 | 0.07 ± 0.01 |
| Buffer 3 | 0.11 ± 0.03 | 0.10 ± 0.05 | 0.13 ± 0.02 | 0.08 ± 0.01 |
Table 6 shows that for each studied electrode, the bias is constant within the studied range of pH between 7.8 and 8.4 and cannot be neglected as it is larger than the expanded uncertainty.
The second option, (B), applied mostly when the systematic errors are not completely understood or known, leading to much higher uncertainty, up to 0.2 pH, which is not fit for the intended purpose in several applications. The integration of the bias into the overall uncertainty budget could be done using the approaches described in different references [24], [25], [26].
A more rigorous approach would be to directly calibrate the pH meter with standard saline buffers, as recommended by the IUPAC. This was demonstrated with the second set of experiments.
Buffer 1 and Buffer 3 have been used to perform two-point calibration manually, first using pH and, then, pHT values. Figure 1 presents the measured potential values for dilute buffers and saline buffers recorded to establish the calibration curves for the Unitrode 1 electrode.

Example of calibration curves for pH and pHT potentiometric measurements with Unitrode 1. The symbols are used for (•) pH calibration with commercial dilute buffers, (○) pH calibration with Tris–Tris·HCl saline buffers and (□) pHT calibration with saline Tris–Tris·HCl buffers. A zoomed version of the calibration curves is represented at the right-hand side of the figure.
The calibration slopes determined using this protocol showed that all the electrodes exhibit Nernstian behavior. To test the calibration efficiency, Buffer 2 solution was used as an unknown sample for pH and pHT measurements.
Table 7 presents both pH and pHT results obtained for Buffer 2 using the four electrodes and the associated expanded uncertainties calculated using the ISO 5725-2 document [19]. It shows excellent agreement between the values obtained with the combination electrodes for the reference primary values, which confirms that the selection of saline buffers to calibrate the pH electrode enables minimization of the systematic errors coming from liquid junctions. It has to be pointed out that measurements in the synthetic seawater matrix exhibit a good reproducibility, better than 0.002, and similar to the values attained for classical dilute buffers.
pH and pHT results of Tris–Tris·HCl Buffer 2 with the associated expanded uncertainty, U (k = 2), based on ISO 5725-2.
| Certified value | Buffer 2 | ||||
|---|---|---|---|---|---|
| Unitrode 1 | Unitrode 2 | Primatrode 1 | Primatrode 2 | ||
| pH | 8.313 ± 0.005 | 8.31 ± 0.01 | 8.32 ± 0.01 | 8.32 ± 0.01 | 8.32 ± 0.01 |
| pHT | 8.101 ± 0.005 | 8.10 ± 0.01 | 8.10 ± 0.01 | 8.09 ± 0.01 | 8.10 ± 0.01 |
The consistency of the pHT value with the reference primary pHT value for this buffer documents the possibility to use the potentiometric method for direct determination of this quantity.
In 1988, an IUPAC recommendation [27] was published aiming at ensuring that measurements of different quantities used to assess seawater acidity, namely pH and pHT, are comparable. Thus, it was recommended to calculate a parameter, fH′, relating pH to pHT, Eq. (5), that takes into account the systematic errors introduced by calibration with a low-ionic strength buffer solution.
In the present study, the dependency of the conversion factor between the acidity scales fH′ to the electrode was evaluated.
Measurement results are sensitive to the type of liquid junction. The liquid junction potential is influenced by different factors, including the ionic strength (reflected by the difference of ionic strengths between reference buffer solutions and samples), geometry, and type of junction. Thus, the conversion factor should be calculated for each electrode, and based on the methodology proposed in the present work, a protocol can be relatively easily implemented for quality control of routine measurements.
Table 8 presents the fH′ calculated based on the measurements done with the four combined glass electrodes and considering pH values obtained after calibration with saline buffers. The obtained values are represented graphically in Fig. 2.
f H′ values obtained by calibrating the combined glass electrodes used in this study with saline buffers together with their expanded uncertainty (k = 2).
| Electrode | f H′ |
|---|---|
| Unitrode 1 | 0.62 ± 0.02 |
| Unitrode 2 | 0.60 ± 0.02 |
| Primatrode 1 | 0.59 ± 0.02 |
| Primatrode 2 | 0.60 ± 0.02 |
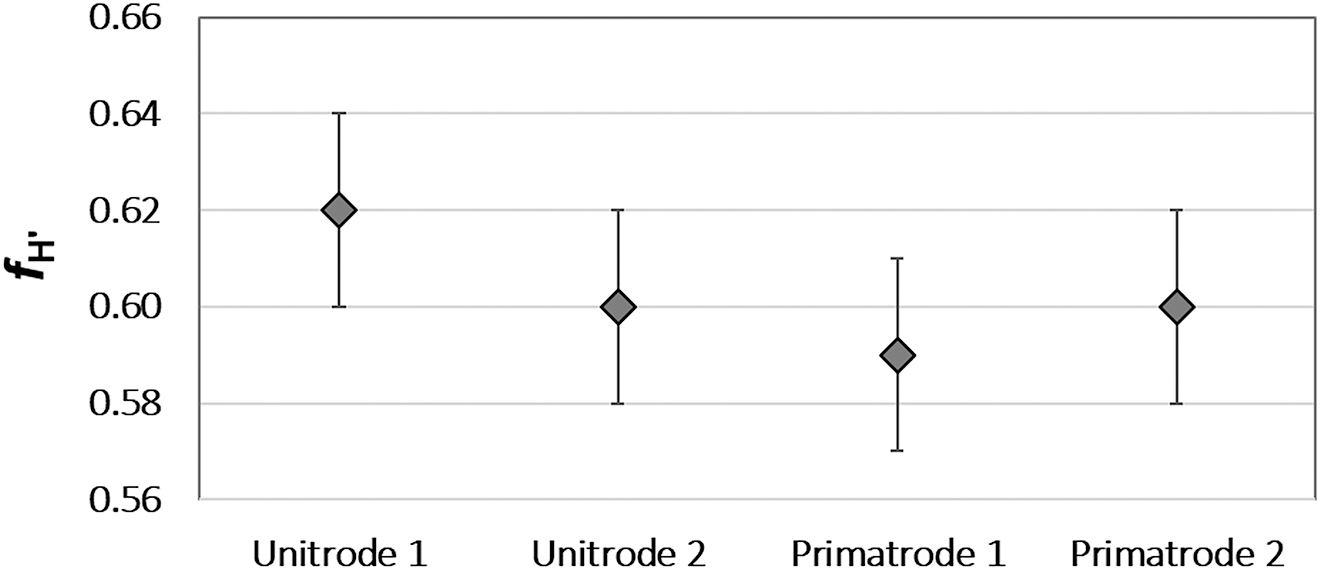
f H′ values obtained by calibrating the combined glass electrodes used in this study with saline buffers. Error bars are expanded uncertainties (k = 2).
Table 8 and Fig. 2 show that fH′ values obtained for the tested electrodes are not statistically different. Both pH and pHT values are reported with uncertainties explained inter-alia by the control of the liquid junction, by perfectly matching the salinity of solutions used to standardize the electrodes to the salinity of the sample. The present study was conducted with new well-behaved electrodes. Quality of results is expected to decrease if aged electrodes and electrodes with different types of liquid junctions are used.
4 Conclusions
pH is one of the master variables that characterize seawater, used as an indicator of ocean acidification. Nevertheless, measurement of pH is still of major concern due, on one side, to the lack of recommended commercial buffer solutions to establish fit for purpose calibration for routine measurements and, on the other one, as a consequence of the proliferation of values pertaining to different measurands and different measurement procedures, often without clear identification.
The calibration with saline buffers characterized in terms of pH and ionic strength has not been a generalized practice so far because there is not yet such a recommendation supported on data and due to the lack of commercially available suitable calibrants. Also, the often indiscriminate use of different kinds of quantities for “pH” as well as potentiometric and spectrophotometric measuring methods and procedures has been hindering the traceability of values, hence making comparability of results in space and time impossible. The results of this study aim at overcoming these existing limitations.
For reliable QA/QC purposes, the availability of reference Tris–Tris HCl buffers in artificial seawater, of three different molality ratios, with assigned primary pH and pHT values, provides the means for an adequate multi-point calibration approach to be used for pH meter setups, namely potentiometric devices equipped with quality assured, well-behaved glass electrodes. Conversion factors between the mentioned kinds of quantities can be applied to measurement results, thus solving the issues of comparability. Results with uncertainties of the same order of magnitude as those assessed for measurements in dilute solutions are reached.
Membership of sponsoring bodies
The membership of Division V (Analytical) at present is
President: Zoltán Mester; Past President: Jan Labuda; Vice President: Érico Marlon de Moraes Flores; Secretary: Takae Takeuchi; Titular Members: Medhat A. Al-Ghobashy, Derek Craston, Attila Felinger, Irene Rodriguez Meizoso, Sandra Rondinini, David Shaw. Associate Members: Jiri Barek, M. Filomena Camões, Petra Krystek, Hasuck Kim, Ilya Kuselman, M. Clara Magalhães, Tatiana A. Maryutina; National Representatives: Boguslaw Buszewski, Mustafa Culha, D. Brynn Hibbert, Hongmei Li, Wandee Luesaiwong, Serigne Amadou Ndiaye, Mariela Pistón Pedreira, Frank Vanhaecke, Winfield Earle Waghorne, Susanne Kristina Wiedmer.
Funding source: Fundação para a Ciência e a Tecnologia, FCT
Award Identifier / Grant number: UIDB/00100/2020
Funding source: International Union of Pure and Applied Chemistry
Award Identifier / Grant number: https://iupac.org/project/2013-013-1-500
Acknowledgments
The authors from LNE wish to acknowledge JPI Ocean, especially members of European Marine Sensor Calibration Network Calibration, for supporting the present study. The authors from FCUL wish to acknowledge FCT, the Portuguese Funding Institution, Fundação para a Ciência e a Tecnologia, for supporting their research, namely through project UID/QUI/00100/2019.
-
Research funding: This work was funded by Fundação para a Ciência e a Tecnologia, FCT (UIDB/00100/2020) and International Union of Pure and Applied Chemistry (project 2013-013-1-500).
References
[1] R. Bates. Determination of pH – Theory and Practice, New York: John Wiley & Sons Inc (1964).Suche in Google Scholar
[2] R. P. Buck, S. Rondinini, A. K. Covington, F. G. K. Baucke, C. M. A. Brett, M. F. Camões, M. J. T. Milton, T. Mussini, R. Naumann, K. W. Pratt, P. Spitzer, G. S. Wilson. Pure Appl. Chem.74, 2169 (2002), https://doi.org/10.1351/pac200274112169.Suche in Google Scholar
[3] F. Camões, B. Anes, H. Martins, C. Oliveira, P. Fisicaro, D. Stoica, P. Spitzer. J. Electroanal. Chem.764, 88 (2016), https://doi.org/10.1016/j.jelechem.2016.01.014.Suche in Google Scholar
[4] B. Anes, R. J. N. Bettencourt da Silva, H. F. P. Martins, C. S. Oliveira, M. F. Camões. Accred Qual. Assur.21, 1 (2016), https://doi.org/10.1007/s00769-015-1163-y.Suche in Google Scholar
[5] R. G. Bates. Chem. Rev.42, 1 (1948), https://doi.org/10.1021/cr60131a001.Suche in Google Scholar PubMed
[6] M. F. Camões, A. K. Covington. Anal. Chem.46, 1547 (1974), https://doi.org/10.1021/ac60347a003.Suche in Google Scholar
[7] I. Hansson. Deep Sea Res. Oceanogr. Abstr.20, 479 (1973), https://doi.org/10.1016/0011-7471(73)90101-0.Suche in Google Scholar
[8] T. A. DelValls, A. G. Dickson. Deep Sea Res. Part I Oceanogr. Res. Pap.45, 1541 (1998), https://doi.org/10.1016/s0967-0637(98)00019-3.Suche in Google Scholar
[9] P. J. Brewer, D. Panagoulia, R.J.C. Brown, A. Tromans, A. Reyes, M. Arce, A. Vospelova, M. Rozikova, W. Pratt, T. Asakai, P.T. Jakobsen, M. F. Camões, C.S. Oliveira, I. Godinho, P. Spitzer, B. Sander, M. Mariassy, L. Vyskocil, P. Fisicaro, D. Stoica, E. Uysal. Meas.: J. Int. Meas. Confed.66, 131 (2015).10.1016/j.measurement.2015.01.029Suche in Google Scholar
[10] A. G. Dickson, M. F. Camões, P. Spitzer, P. Fisicaro, D. Stoica, R. Pawlowicz, R. Feistel. Metrologia53, R26 (2015), https://doi.org/10.1088/0026-1394/53/1/r26.Suche in Google Scholar
[11] G. M. Marion, F. J. Millero, M. F. Camões, P. Spitzer, R. Feistel, C. T. A. Chen. Mar. Chem.126, 89 (2011), https://doi.org/10.1016/j.marchem.2011.04.002.Suche in Google Scholar
[12] A. G. Dickson, C. L. Sabine, J. R. Christian. PICES Spec. Publ. 3,3, 191 (2007).Suche in Google Scholar
[13] R. A. Easley, R. H. Byrne. Environ. Sci. Technol.46, 5018 (2012), https://doi.org/10.1021/es300491s.Suche in Google Scholar PubMed PubMed Central
[14] JCGM – Joint Committee for Guides in Metrology. International Vocabulary of Metrology – Basic and General Concepts and Associated Terms (VIM) Paris, (2012).Suche in Google Scholar
[15] K. Isensee. Update on SDG 14.3.1 Indicator and the Methodology, Paris: IOC-UNESCO (2018).Suche in Google Scholar
[16] J. Barbière, K. Isensee. Update on IOC Custodianshipship Role in Relation to SDG 14 Indicators, Paris (2018).Suche in Google Scholar
[17] K. W. Pratt. Mar. Chem.162, 89 (2014), https://doi.org/10.1016/j.marchem.2014.03.003.Suche in Google Scholar
[18] IOC, SCOR, IAPSO. Intergov. Oceanogr. Comm. Manuals Guide. No. 56, 196, UNESCO, (2010).Suche in Google Scholar
[19] ISO 5725-2:2019. Accuracy (Trueness and Precision) of Measurement Methods and Results – Part 2: Basic Method for the Determination of Repeatability and Reproducibility of a Standard Measurement Method ISO GENOVA, (2019).Suche in Google Scholar
[20] A. G. Dickson, D. J. Wesolowski, D. A. Palmer, R. E. Mesmer. J. Phys. Chem.94, 7978 (1990), https://doi.org/10.1021/j100383a042.Suche in Google Scholar
[21] J. D. Müller, G. Rehder. Front. Mar. Sci.5, 177 (2018), https://doi.org/10.3389/fmars.2018.00177.Suche in Google Scholar
[22] B. Anes, R. J. N. Bettencourt da Silva, C. Oliveira, M. F. Camões. Talanta193, 118 (2019), https://doi.org/10.1016/j.talanta.2018.09.075.Suche in Google Scholar PubMed
[23] M. F. Camões, B. Anes. Water7, 8 (2015), https://doi.org/10.3390/w7084247.Suche in Google Scholar
[24] G. E. O’Donnell, D. B. Hibbert. Analyst130, 721 (2005), https://doi.org/10.1039/b418126n.Suche in Google Scholar
[25] I. H. Lira, W. Wöger. Meas. Sci. Technol.9, 1010 (1998), https://doi.org/10.1088/0957-0233/9/6/019.Suche in Google Scholar
[26] K. Klauenberg, G. Wübbeler, C. Elster. Meas. Sci. Rev.19, 204 (2019), https://doi.org/10.2478/msr-2019-0026.Suche in Google Scholar
[27] A. K. Covington, M. Whitfield. Pure Appl. Chem.60, 865 (1988), https://doi.org/10.1351/pac198860060865.Suche in Google Scholar
© 2021 IUPAC & De Gruyter. This work is licensed under a Creative Commons Attribution-NonCommercial-NoDerivatives 4.0 International License.
This work is licensed under the Creative Commons Attribution-NonCommercial-NoDerivatives 4.0 International License.
Artikel in diesem Heft
- Frontmatter
- In this issue
- Preface
- Emerging technologies for a more sustainable future
- Invited papers
- Liquid gating technology
- Organocatalysis emerging as a technology
- Aggregation-induced emission (AIE): emerging technology based on aggregate science
- Future directions of environmental chemistry
- Future directions of catalytic chemistry
- Future directions of chemical theory and computation
- Future directions of material chemistry and energy chemistry
- Research frontiers of chemical detection and measurements
- The future directions of synthetic chemistry
- Research fronts of Chemical Biology
- IUPAC Technical Report
- Feasibility of multifunction calibration of H+-responsive glass electrodes in seawater (IUPAC Technical Report)