Stereophotography and spatial surface reconstruction using scanning electron microscopy images
-
Simonas Kareiva
 ,
Algirdas Selskis
,
Algirdas Selskis

Abstract
Three-dimensional reconstruction technique to fully characterize structural performance of solid materials is suggested. The three-dimensional sample data out of the SEM images taken from different angles were extrapolated, measured and interpreted. In stereometry, the technique of three dimensional SEM imaging is fairly straightforward. Selected specimen area is photographed using SEM imaging tools from two different angles. Tilting is performed using standard SEM manipulation tools. In some cases, the specimen must be rotated to such a position, in which the tilting is done on visual ordinate axis. The resulting images are combined in pairs using any three-dimensional anaglyph software available to produce an anaglyph image, which, in turn, can be analyzed using standard 3D glasses. To achieve finer results, extrapolation of spatial data was done from three or more sample images using visual reconstruction software applications. This technique for recovering spatial data from the SEM pictures (structure-from-motion) is the VisualSFM software, which is an application for spatial reconstruction using structure from sample motion. Using VisualSFM, the images are analyzed for matching points and the camera angle is guessed for each image. Any number of additional viewports can be added to VisualSFM software. Based on this input, a surface is reconstructed where the matching points intersect and a colour value is assigned. The software produces a cloud of points, which has to be processed externally. Freely available software, such as MeshLab can be used to join the point cloud to a mesh and, as a second step of reconstruction, apply surface properties to the mesh polygons. The gold particles were selected as model material for the spatial 3D surface reconstruction.
Introduction
The process of morphological characterization of a specimen using scanning electron microscopy (SEM) generally produces a magnified specimen image which is built out of the ejected electron beam raster scan data and the initial position of the beam. The scanning electron microscope provides large depth-of-focus and high-contrast images at a large variability in magnification. Nevertheless, the resulting image is literally a two-dimensional intensity distribution array and usually does not carry any additional specimen-related metadata, except for the observational circumstances. Extracting spatial data from the two-dimensional images can be difficult, so to achieve this, the specimen must be handled in a special way and, also, the produced micrographs must be digitally processed afterwards [1–3].
In materials science, various techniques for three-dimensional reconstruction of microstructures have been applied successfully for decades, such as X-ray and electron tomography [4–6]. X-ray computed microtomography, sometimes combined with micro-X-ray fluorescence technique and often used in medicine and material characterization as a non-invasive method for visualizing the three-dimensional structure of various objects [7]. It was demonstrated, that optical coherence tomography allows rapid evaluation of coating surface morphological properties and three dimensional images could be reconstructed [8]. The unique capabilities of ultrashort pulse femtosecond lasers have been integrated with a focused ion beam platform to create a new system for rapid 3D materials analysis [9]. Consequently, the combination of integrated focused ion beam-scanning electron microscope (FIB-SEM) serial sectioning and imaging techniques with image analysis was recently used for quantitative three-dimensional characterization of different materials [10–13].
Electron microscopy has made a great impact on structure determination, however, only TEM showed a strong potential for structural studies of nano-crystals, interfaces, phase boundaries and their surfaces [14, 15]. On the other hand, SEM stereoscopic technique was also used to determine the three dimensional surface structures [16, 17]. It is very well known, that stereoscopy simulates human vision by combining two pictures of a specimen from two slightly different angles. The depth of the produced stereoscopic images (anaglyphs) depends on the chosen angle where 2.5, 5 or 10 degrees [18] is usually enough to produce a sufficient depth perception to the viewer. The success of this technique highly depends on the microscope type and its instrumental precision. Stereo photography requires precise compucentric tilting of the observed sample, so that during the tilt, image focal points are preserved in the microscope viewport [19]. This is difficult to achieve for some SEM models, where the accuracy is linearly decreased, as the magnification increases. However, if the tilt is precisely compucentric, anaglyphs of magnification up to 50 000 times can be easily produced. Otherwise, the SEM operator must manually apply the compensation of the shift that happens during the tilt.
The aim of this study is to extrapolate, measure and interpret 3-dimensional sample data out of the SEM images, taken from different angles. It is expected that during this study, the employed algorithms of visual reconstruction should be modified with respect to the difference of properties of an electron beam and visible light, photon behaviour, so that they are fit for microscopic surface analysis. The gold particles, which could be used for variety of modern applications [20–22] were selected as model materials for the spatial 3D surface reconstruction. Moreover, the Au nanoparticles usually consists of crystallites having strictly definite size and shape [23, 24]. Moreover, the morphology and crystallinity of gold nanoparticles could be easy ordered using a continuous wave infrared laser [25]. For the comparison, SEM stereoscopic technique was also used to determine the three dimensional surface structures.
Experimental section
The approach by combining two pictures of a specimen from two slightly different angles was used for the reconstruction of 3D SEM images using stereoscopic technique. Combination of two SEM images into an anaglyph was done with freely available software AnaMaker [26]. LC-3D shutter glasses for viewing the 3D images were used. Extrapolation of spatial data was done from three or more sample images using visual reconstruction software applications. The gold particles (Agar Scientific Ltd.) were investigated in this study. The gold on carbon calibration specimens have been specifically produced to enable the high resolution capabilities of SEM to be assessed. Hitachi TM3000 and Helios NanoLab 650 scanning electron microscopes were used to obtain SEM images.
Results and discussion
Figure 1 depicts SEM images of gold particles investigated in this study and obtained by two different electron microscopes. At first glance at Au SEM images, gold seems to consist of differently shaped particles. Additionally, the microstructure of the gold sample is also composed by a number of different size (0.2–3 μm) grains. Evidently, that two SEM images of the same Au sample obtained at similar magnification but using two different microscopes could be characterized slightly in different manner. The SEM image presented in Fig. 1 at top let us conclude that gold sample consists of irregular shape particles. However, the SEM image presented in Fig. 1 at bottom shows that most of the Au particles are plate-like crystallites having triangular or hexagonal shape. Moreover, a regular distribution of round-shaped particles could be observed on the surface. Their sizes are around 400–500 nm.
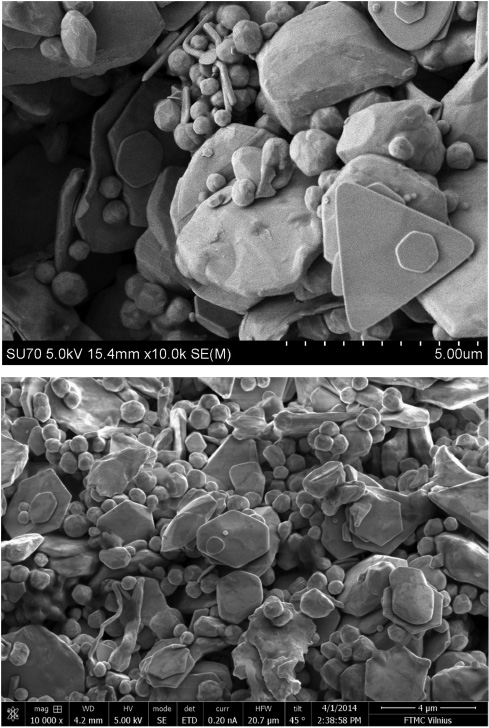
SEM micrographs of Au sample obtained by two different scanning electron microscopes.
The situation is slightly ambiguous when SEM micrographs are obtained at different magnifications using the same microscope as well. SEM micrographs of Au sample obtained at different magnifications using the same scanning electron microscope are shown in Fig. 2. As seen, the surface microstructure could be described more properly only if several SEM micrographs obtained at different magnifications are analysed.
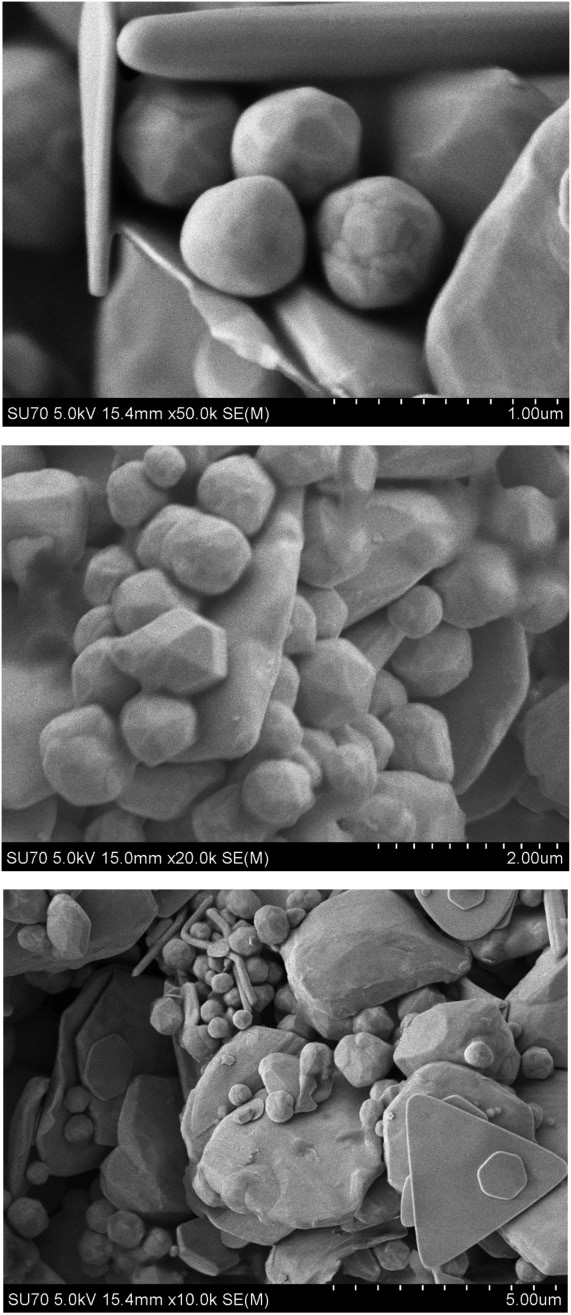
SEM micrographs of Au sample obtained at different magnifications using the same scanning electron microscope.
An example of anaglyphs created with AnaMaker are shown in Fig. 3. In this case, to analyze the surface microstructure the 3D glasses should be used. The stereoscopic SEM images of Au particles reveals the formation of plate-like particles along with spherical particles. Moreover, these spherical particles are much smaller in comparison with plate-like particles.
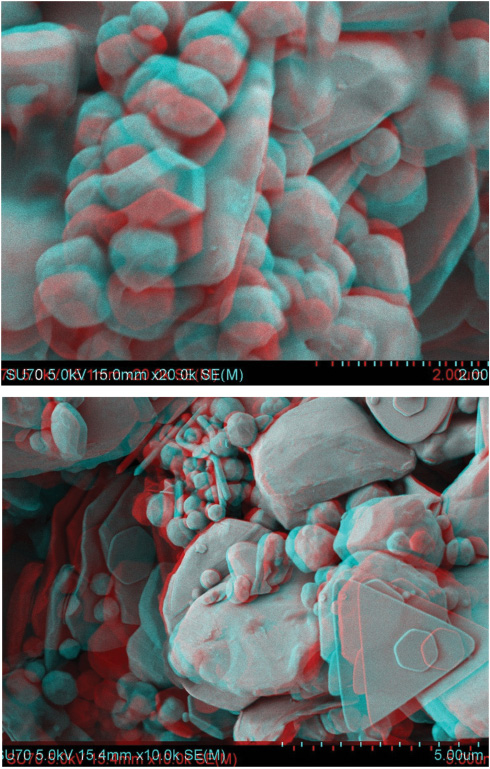
Stereoscopic SEM images of Au particles.
Apparently, Au particles make a very heterogeneous surface. It is obvious that surface roughness of the Au sample could be estimated from 3D SEM image. However, this technique requires that images for both eyes should be taken with some precision, at least to keep the analysed sample in the centre.
Another technique for recovering spatial data from the SEM pictures (structure-from-motion) is spatial reconstruction. Currently proposed solution is the VisualSFM software, which is an application for spatial reconstruction using structure from sample motion [27]. The method and recommendations for the use of above applications specifically to SEM images is developed solely by the authors of this work. Using VisualSFM, the images are analyzed for matching points and the camera angle is guessed for each image. This produces results similar to those displayed in Fig. 4.
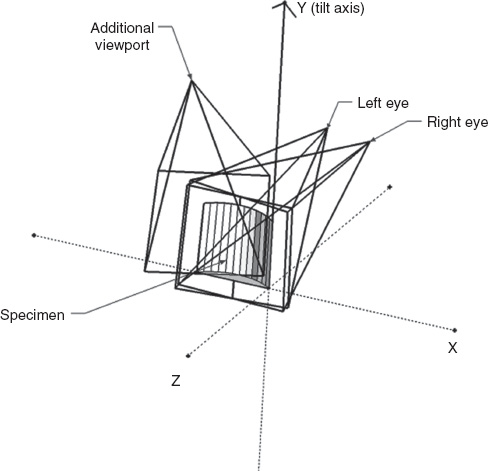
Positions of viewports could be added to VisualSFM software.
Any number of additional viewports can be added to VisualSFM software. The 3D images of the same Au particles were reconstructed from 12 SEM micrographs (Fig. 5).
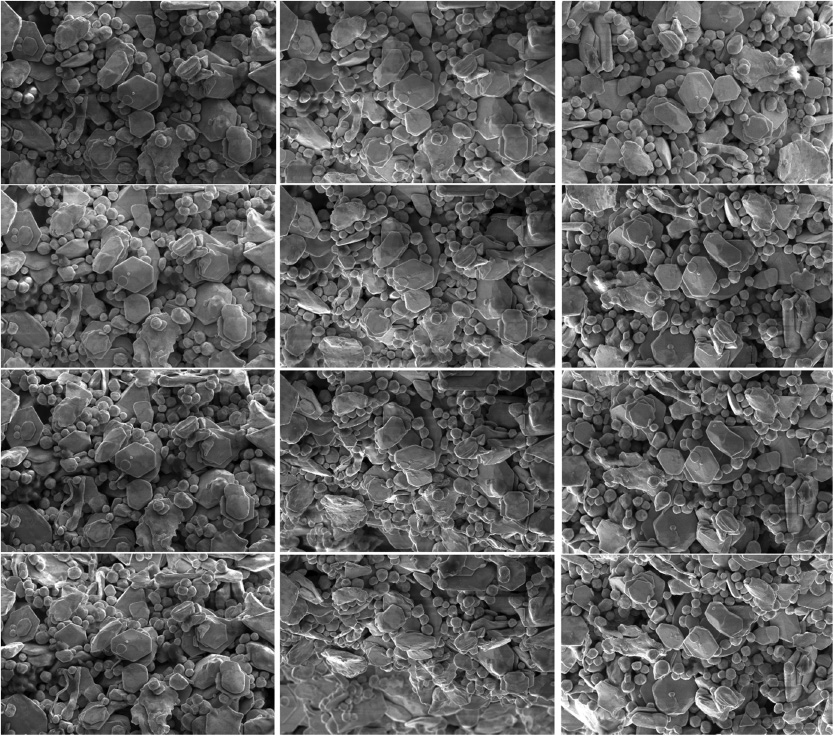
SEM micrographs of Au sample used for the reconstruction of 3D images.
The reconstructed images using spatial reconstruction are obtained using several intermediate steps. The structural reconstruction produces a digital point cloud. The Ball pivoting algorithm was used to join nearest points into triangular faces so that a mesh and next, a surface is produced. The 3D gold surface reconstruction steps, from point cloud, to mesh and surface are presented in Figs. 6–8, respectively. The software produces a cloud of points (Fig. 6), which has to be processed externally. Freely available software, such as MeshLab can be used to join the point cloud to a mesh (Fig. 7) and, as a second step of reconstruction, apply surface properties to the mesh polygons (Fig. 8). As shown in Fig. 8, a dense microstructure that is composed of angular particles was observed in gold sample.
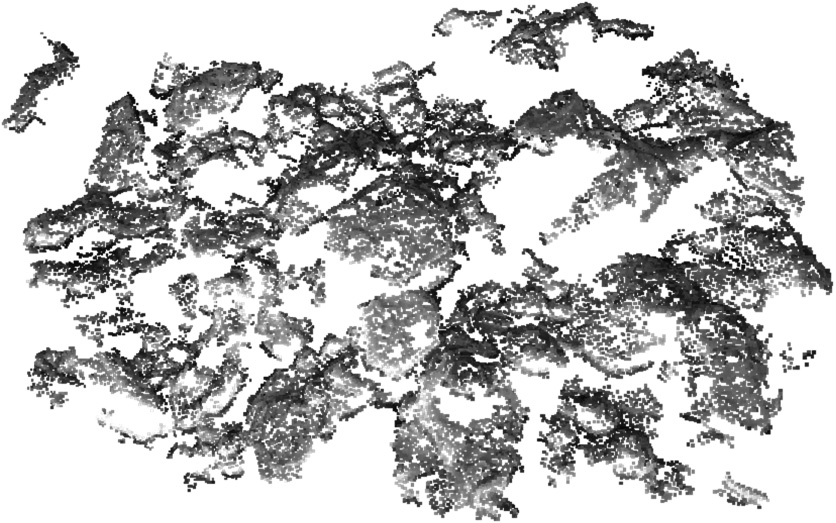
3D gold surface point cloud reconstruction step.
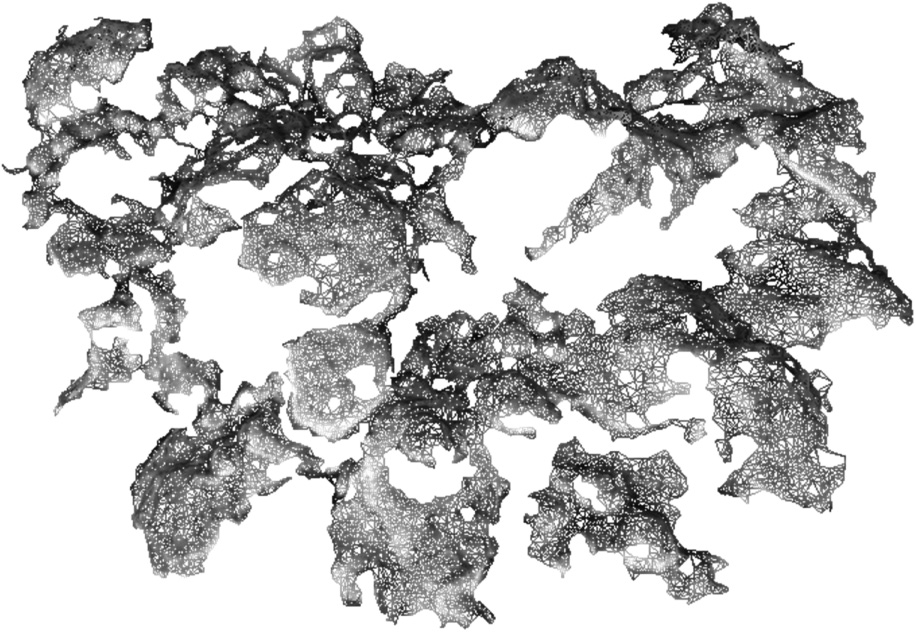
3D gold surface mesh reconstruction step.
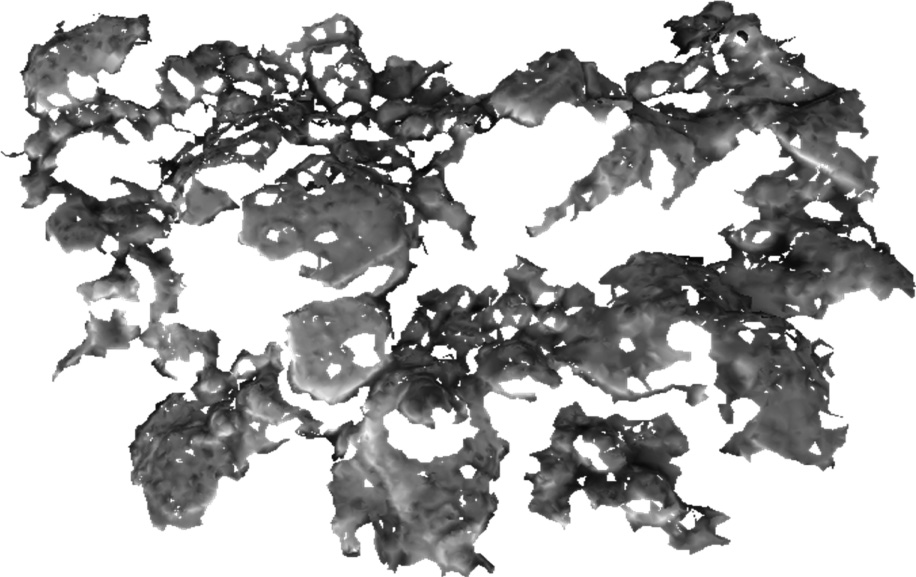
3D gold surface reconstruction step.
The overall quality of the results for the described reconstruction technique depends on several factors, such as image contrast, homogeneity, angle and shadow variation. The best results are achieved when the sample is photographed by several, from 10 to 15 semi-random viewports, in steps of approximately 2.5 degrees. The examples of different attempts to obtain 3D images of gold surface using spatial reconstruction approach are presented in Fig. 9. The size and shape of the true particles could be precisely determined using 3D display and animation.
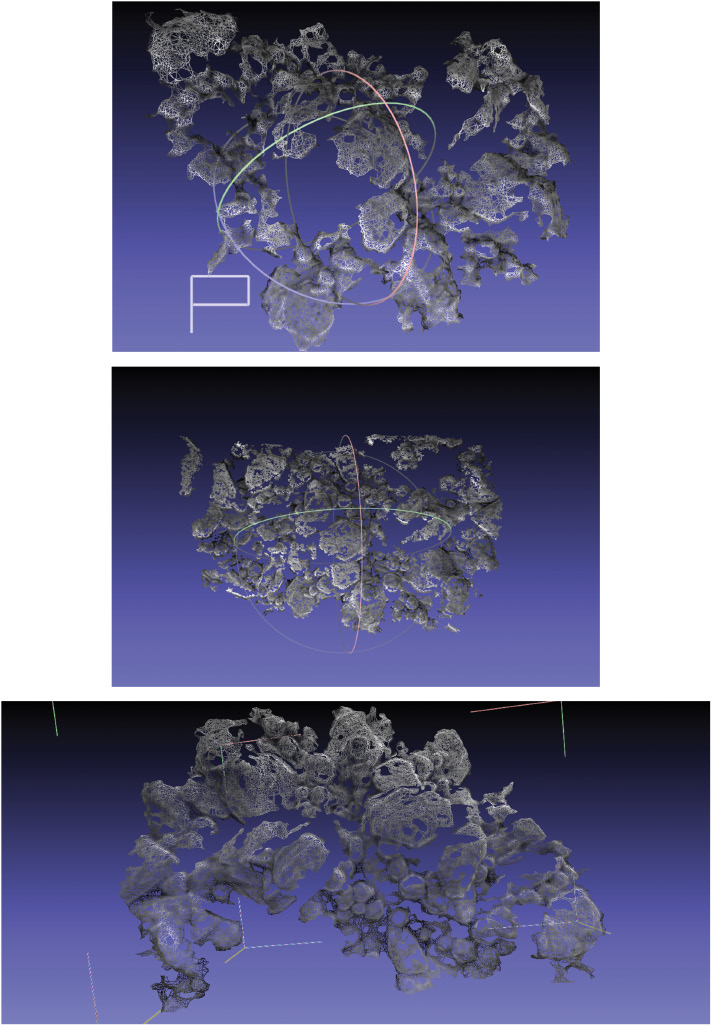
Examples of different attempts to obtain 3D images of gold surface using spatial reconstruction approach.
Conclusions
A novel SEM method to obtain 3D structural information of the surface of solid materials has been developed. The gold particles were selected as standard material for the spatial 3D surface reconstruction. The SEM micrographs indicated that gold sample was composed of particles (0.2–3 μm) having triangular, hexagonal or spherical shape. The stereoscopic SEM images of Au particles revealed, however, the formation of plate-like particles along with spherical particles. In this case, however, the 3D glasses should be used to characterize the surface microstructure. The 3D image of the same Au particles reconstructed from SEM micrographs using spatial reconstruction indicated development of weaker areas and a higher degree of heterogeneity in local microstructure. The two methods in question usually produce different results which depend on the amount and quality of input data. Whereas the stereoscopic method usually employs only two images of the specimen, full 3D reconstruction requires more input data and therefore the quality of results is proportional to the heterogeneity of the sample and to the number of input images (both of which define the number of possible reconstruction matching points). The overall quality of the results for the described reconstruction technique seems to be dependent on several factors, such as image contrast, homogeneity, angle and shadow variation. The best results were achieved when the sample was photographed from 10 to 15 semi-random viewports.
Article note
A collection of invited papers based on presentations at the 11th Conference on Solid State Chemistry (SSC-2014), Trencianske Teplice, Slovakia, 6–11 July 2014.
References
[1] E. P. da Rocha, J. A. de Castro. Mater. Res.-Ibero-Am. J. Mater.17, 47 (2014).Suche in Google Scholar
[2] M. P. Echlin, A. Mottura, M. Wang, P. J. Mignone, D. P. Riley, G. V. Franks, T. M. Pollock. Acta Mater.64, 307 (2014).Suche in Google Scholar
[3] H. Pirgazi, S. Ghodrat, L. A. I. Kestens. Mater. Charact.90, 13 (2014).Suche in Google Scholar
[4] G. Mobus, B. J. Inkson. Mater. Today10, 18 (2007).10.1016/S1369-7021(07)70304-8Suche in Google Scholar
[5] Q. Wan, H. D. Zhao, C. Zou. ISIJ Int.54, 511 (2014).Suche in Google Scholar
[6] G. Mobus. Eur. Microsc. Anal.3, 15 (2003).10.1016/S0010-2180(02)00428-5Suche in Google Scholar
[7] Y. Z. Liu, D. K. Schreiber, A. K. Petford-Long, K. Z. Gao. Mater. Charact.72, 104 (2012).Suche in Google Scholar
[8] D. M. Koller, G. Hannesschlager, M. Leitner, J. G. Khinast. Eur. J. Pharm. Sci.44, 142 (2011).Suche in Google Scholar
[9] M. P. Echlin, A. Mottura, C. J. Torbet, T. M. Pollock. Rev. Sci. Instrum.83, 023701 (2012).Suche in Google Scholar
[10] R. Singh, A. R. Akhgar, P. C. Sui, K. J. Lange, N. Djilali. J. Electrochem. Soc.161, F415 (2014).10.1149/2.036404jesSuche in Google Scholar
[11] N. Vivet, S. Chupin, E. Estrade, A. Richard, S. Bonnamy, D. Rochais, E. Bruneton. J. Power Sources.196, 9989 (2011).Suche in Google Scholar
[12] J. C. Lin, W. Heeschen, J. Reffner, J. Hook. Microsc. Microanal.18, 266 (2012).Suche in Google Scholar
[13] M. Ender, J. Joos, T. Carraro, E. Ivers-Tiffee. J. Electrochem. Soc.159, A972 (2012).10.1149/2.033207jesSuche in Google Scholar
[14] M. Syha, A. Trenkle, B. Lodermann, A. Graff, W. Ludwig, D. Weygand, P. Gumbsch. J. Appl. Crystallogr.46, 1145 (2013).Suche in Google Scholar
[15] T. Willhammar, Y. F. Yun, X. D. Zou. Adv. Funct. Mater.24, 182 (2014).Suche in Google Scholar
[16] O. P. Mills, W. I. Rose. Geosphere.6, 805 (2010).Suche in Google Scholar
[17] A. Mohammadkhani, M. Malboubi, C. Anthony, K. Jiang. Microelectr. Eng.88, 2687 (2011).Suche in Google Scholar
[18] P. Hortola. Micron.40, 409 (2009).10.1016/j.micron.2008.09.008Suche in Google Scholar PubMed
[19] R. Kempers, P. Ahem, A. J. Robinson, A. M. Lyons. Comput. Struct.92–93, 216 (2012).Suche in Google Scholar
[20] F. Barabe, P. Levesque, B. Sow, G. Bellavance, G. Betournay, L. Barriault. Pure Appl. Chem.85, 1161 (2013).Suche in Google Scholar
[21] G. H. Kim, S. Ramesh, J. H. Kim, D. Jung, H. S. Kim. J. Nanosci. Nanotechnol.14, 7495 (2014).Suche in Google Scholar
[22] A. Makaraviciute, T. Ruzgas, A. Ramanavicius, A. Ramanaviciene. Analyt. Methods.6, 2134 (2014).Suche in Google Scholar
[23] A. K. Das, C. R. Raj. Electrochim. Acta.107, 592 (2013).Suche in Google Scholar
[24] P. Abdulkin, T. L. Precht, B. R. Knappett, H. E. Skelton, D. A. Jefferson, A. E. H. Wheatley. Part. Part. Syst. Char.31, 571 (2014).Suche in Google Scholar
[25] X. Chen, Y. T. Chen, J. Dai, M. Yan, D. Zhao, Q. Li, M. Qiu. Nanoscale. 6, 1756 (2014).Suche in Google Scholar
[26] T. Sekitani. 3D Software: Anaglyph Maker. http://www.stereoeye.jp/software/index_e.html (2001).Suche in Google Scholar
[27] C. C. Wu. International Conference on 3D Vision (3DV 2013). University of Washington, Seattle, USA, June 29–July 01, 127 (2013).Suche in Google Scholar
©2015 IUPAC & De Gruyter
Artikel in diesem Heft
- Frontmatter
- Preface
- 11th Conference on Solid State Chemistry (SSC 2014)
- Conference papers
- Electrical properties of hydroxyapatite
- Chemical solution deposition of functional ceramic coatings using ink-jet printing
- Viscosity of Se–Te glass-forming system
- Ionic conductivity study of LiI-Ga2S3-GeS2 chalcogenide glasses using a random-walk approach
- Investigation of nucleation and growth phenomena during the thermal and light induced spin transition in the [Fe(1-bpp)2][BF4]2 complex
- Self-trapping of charge polarized states in four-dot molecular quantum cellular automata: bi-electronic tetrameric mixed-valence species
- Stereophotography and spatial surface reconstruction using scanning electron microscopy images
- Electromagnetic radiation as a spin crossover stimulus
- Instrumental characterization of geological materials and their synthetic analogs
- IUPAC Recommendations
- Nomenclature and graphic representations for chemically modified polymers (IUPAC Recommendations 2014)
- IUPAC Technical Report
- Reference correlations for the viscosity and thermal conductivity of fluids over an extended range of conditions: hexane in the vapor, liquid, and supercritical regions (IUPAC Technical Report)