Joint multi-omics screening of neutrophil-related biomarkers for lung adenocarcinoma
-
Yunfeng Li


Abstract
Objectives
Neutrophils play a crucial part in the proliferation, migration, and invasion of a variety of cancers. Multi-omics approach was applied to explore the role of neutrophils in lung adenocarcinoma (LUAD) and their influence on LUAD progression was characterized.
Methods
The Cancer Genome Atlas Program (TCGA) database was accessed to obtain relevant data, based on which neutrophil subsets were identified after cell clustering and annotation using FindNeighbors and FindClusters. Monocle2 was utilized for Pseudotime analysis. Transcription factor (TF) prediction analysis was performed by applying pySCENIC. Hub genes identified by WGCNA were intersected with the genes screened by Cox regression to select key genes for LUAD. In addition, the expression and potential biological functions of the screened genes in LUAD were verified by conducting quantitative reverse transcription polymerase chain reaction (qRT-PCR), wound healing, and transwell assays.
Results
This study identified four neutrophil subsets, namely, Neu0, Neu1, Neu2, and Neu3. Pseudotime results revealed that the cells had five states, and cell communication analysis demonstrated a correlation between neutrophils and tumor cells. WGCNA analysis screened 381 hub genes, which were further compressed to 15 key genes. In vitro experiments validated the potential of the top five genes (P2RY13, CYTIP, ZYX, KLRB1, and HMOX1) to serve as biomarkers for LUAD. Knocking down HMOX1 effectively inhibited LUAD cell invasion and migration. Analysis of the prognostic models showed that the RiskScore and nomogram had strong prediction capabilities. Drug sensitivity analysis predicted vincristine as a potential drug for LUAD.
Conclusions
This study identified five neutrophil-related biomarkers (P2RY13, CYTIP, ZYX, KLRB1, and HMOX1) for LUAD. Importantly, HMOX1 affected LUAD cell invasion and migration. The present findings improved the current understanding of the pathogenesis of LUAD.
Introduction
Lung cancer is a leading cause of cancer-correlated deaths, accounting for around 1.8 million death cases each year and roughly 18.7 % of all cancer deaths worldwide [1]. As a major subtype of non-small cell lung cancer (NSCLC), LUAD has a high metastatic potential [2], 3]. Surgical resection, immunotherapy, and targeted gene therapy are the main options for treating LUAD [4]. Though patients at an early stage could achieve favorable outcomes after standard surgery, a lack of typical clinical symptoms at the early stage causes approximately 75 % of LUAD patients to be diagnosed at an advanced or metastatic stage [5]. Hence, identifying specific biomarkers could greatly contribute to the detection and treatment of LUAD.
The tumor microenvironment (TME) is primarily composed of an extracellular matrix, vascular network, and various cellular components [6] that could profoundly influence tumor cell growth, invasion, and metastasis. A study has shown that TME infiltration is involved in the response and resistance of immunotherapy in different cancer types and affects patient prognosis [7]. Neutrophils are the most abundant type of white blood cells in the blood, serving as the first line of defense against foreign pathogens [8]. Neutrophils also play an indispensable role in the TME. Research demonstrated that a higher concentration of neutrophils in tumor tissue is linked to a worse prognosis in comparison to patients with a low density of neutrophils [9]. At present, the role of neutrophils in lung cancer still remains controversial. Carus et al. found that the density of CD66b + neutrophils had no significant relationship with recurrence-free survival or overall survival in NSCLC [10]. However, Rakaee et al. confirmed the density of CD66b + neutrophils as an independent negative indicator for the prognosis of LUAD patients [11]. These findings suggested the heterogeneity of neutrophils and an urgent need to analyze their functions and mechanisms in LUAD.
Single-cell RNA sequencing (scRNA-seq) could be used to analyze the expressions of genes within individual cells [12], [13], [14]. Compared to traditional gene expression analysis techniques, higher resolution and accuracy of scRNA-seq analysis in unbiased evaluation of cellular heterogeneity greatly facilitate the screening of novel cell states and populations and the elucidation of dynamic cellular transitions during cell development and differentiation [15]. Moreover, scRNA-seq could not only identify crucial gene mutations and monitor rare cellular mutations during tumorigenesis and tumor progression at different time points [16], but also more precisely predicts drug responses and disease progression [17].
This study utilized the scRNA-seq in combination with WGCNA analysis and survival analysis to develop prognostic models to explore the relationship between neutrophils and LUAD. Accurate biomarkers for LUAD were discovered, aiming to advance the early diagnosis of LUAD and offer novel insights for improving the prognosis of LUAD patients.
Materials and methods
Data acquisition
Gene Expression Omnibus (GEO, https://www.ncbi.nlm.nih.gov/geo/) [18] and TCGA (https://portal.gdc.cancer.gov/) databases were accessed to source related data. The scRNA-seq dataset GSE253013 with four tumor samples and three datasets (GSE50081, GSE37745, and GSE31210) containing the expression profiles and corresponding survival information were downloaded from GEO database. All the samples included in analyses had valid survival times between 0 and 10 year(s) and a clear survival status. Corresponding platform files were downloaded to convert probes to gene names after eliminating data with ambiguous or one-to-many correspondences. When multiple probes were mapped to the same gene, their average expression value was computed. Subsequently, GSE50081, GSE37745, and GSE31210 with a sample number of 126, 90, and 225, respectively, were integrated into one dataset. The TCGA database, a source of clinical phenotype data of LUAD, was similarly processed as above, and a total of 491 tumor samples were obtained for subsequent analyses.
Single-cell clustering, dimensionality reduction, and cell annotation
Data filtering and quality control were used to extract high-quality single-cell data. Under stringent filtering criteria, each gene was required to be expressed in at least 3 cells and each cell expressed a minimum of 250 genes. Subsequently, the correlation between unique molecular identifiers (UMIs)/mRNA ratio and mitochondrial gene content was evaluated to prevent significant impacts of mitochondrial gene expression on the overall analysis of cellular transcriptomes. The proportion of mitochondrial and rRNA genes in each cell was quantified by the PercentageFeatureSet function [19] in the ‘Seurat’ R package (version 5.0.3), ensuring that cells expressed gene numbers between 500 and 5,000 genes with less than 10 % mitochondrial gene content and non-normal cells were excluded. To enhance the purity and accuracy of the dataset, the ‘DoubletFinder’ R package (version 2.0.4) [20] was applied to identify and remove double cells. Next, data from the four samples in GSE253013 were standardized using the SCTransform function in the ‘Seurat’ package (version 5.0.3) [19], and batch effects were removed using the Harmony algorithm [21].
Principal component analysis (PCA) with the RunPCA function [19] and the uniform manifold approximation and projection (UMAP) algorithm were employed to reduce dimensionality at dim=40. Based on the low-dimensional data, cell similarities were calculated by the FindNeighbors function [19], after which the cells were clustered using the FindClusters function [19] at resolution=0.3. Applying the ‘singleR’ package in R (version 1.10.0), a total of 24 cellular subpopulations were annotated using a combination of classical marker genes reported by a previous study [22].
Then, marker genes were identified using the FindAllMarkers function [19] under logic=0.35, Minpct=0.35, and a corrected p<0.05. Differences in cell composition across samples were compared by quantifying distinct cell types in each sample. Myeloid cells were subjected to the same dimensionality reduction and clustering analysis for a more detailed classification of subpopulations. Dimensionality reduction and clustering were also performed to further subdivide neutrophils for analyzing their heterogeneity.
Subpopulation analysis of neutrophils
Malignant cells were distinguished from normal cells by the ‘inferCNV’ package in R (version 1.14.2) [23], with normal immune cells and mesenchymal cells as references. Cell populations that were significantly different from the reference cells were defined as malignant. Next, the ‘monocle2’ package (version 2.26.0) was employed for pseudotime analysis to reveal the developmental trajectory and subpopulation characteristics of neutrophils, followed by developing a cell communication network using the ‘CellChat’ package (version 1.1.3) [24]. Finally, the regulatory role of transcription factors (TFs) in neutrophil subpopulation was predicted by pySCENIC (version 0.12.1) [25].
Classification of molecular subtypes
The potential influence of diverse neutrophil subsets on the prognosis of LUAD was analyzed based on the ssGSEA scores assigned to the marker genes specific to various neutrophil types. Kaplan-Meier (KM) survival curves were plotted to visualize the survival results associated with these neutrophil subsets. To further explore the distribution of these subsets in tumor tissues and their potential clinical significance, signature genes of Neu1 and Neu2 were selected to perform consensus clustering analysis using the ‘ConsensusClusterPlus’ package in R (version 1.62.0) [26] in R based on gene expression in tumor tissue samples from the TCGA dataset. The partitioning around medoids (PAM) algorithm was employed with “pearson” as the distance metric and 500 bootstraps were used to enhance the robustness of the clustering results. The optimal number of clusters was determined based on the consensus matrix and consensus cumulative distribution function (CDF). To uncover the underlying biological mechanisms of the neutrophil subsets, gene sets related to pathways were downloaded from the Kyoto Encyclopedia of Genes and Genomes (KEGG) database via the GSEA official website (https://www.gsea-msigdb.org/gsea/index.jsp), and pathway scores for each patient were calculated using the ‘GSVA’ package in R (version 1.34.8) [27]. According to the median pathway scores, patients were divided into high-risk and low-risk groups and significantly enriched pathways between the groups were identified using the KEGG database.
Weighted correlation network analysis (WGCNA) analysis
Based on the transcriptome expression profile data of all the samples, similarity and potential outlier samples were identified by weighted correlation network analysis (WGCNA) [28]. Subsequently, a network topology analysis was conducted to develop a gene co-expression network. According to the results of the topology analysis, gene networks were constructed and modular structures within the identified network.
Screening of key genes and biomarkers
Univariate Cox regression analysis was conducted to screen genes with p<0.05. Subsequently, these genes were intersected with the hub genes identified by WGCNA to obtain key genes in LUAD. Further, the LUAD cohort from the Shengxindouyacai Database (http://www.sxdyc.com/) was accessed to develop a prognostic model using integrated machine learning methods. Leave-One-Out Cross-Validation (LOOCV) framework was employed to fit 101 predictive models, and the c-index for each model was calculated on all validation datasets to assess the prediction performance [29]. Key genes were selected based on the optimal model.
To refine the gene selection, an in-depth analysis of their functional contributions across the three GO terms was conducted using the ‘GOSemSim’ package in R (version 2.24.0) [30]. The top five genes with the greatest functional importance were determined as potential biomarkers.
Cell culture and transfection
Human lung cancer cell A549 (BNCC337696), human bronchial epithelial cells BEAS-2B (BNCC359274) and human NSCLC cells H2228 (BNCC340351) purchased from BeiNa Culture Collection (Henan, China) were respectively cultured in 90 % high-glucose Dulbecco’s modified Eagle’s medium (C3260, Solarbio Lifesciences, Beijing, China), Ham’s F-12K medium (C3340, Solarbio Lifesciences), RPMI-1640 medium (C3250, Solarbio Lifesciences) added with 10 % fetal bovine serum (S9020, Solarbio Lifesciences) at a constant temperature of 37 °C in 5 % CO2. The cells were authenticated by short tandem repeat (STR) profiling and the mycoplasma detection results were negative.
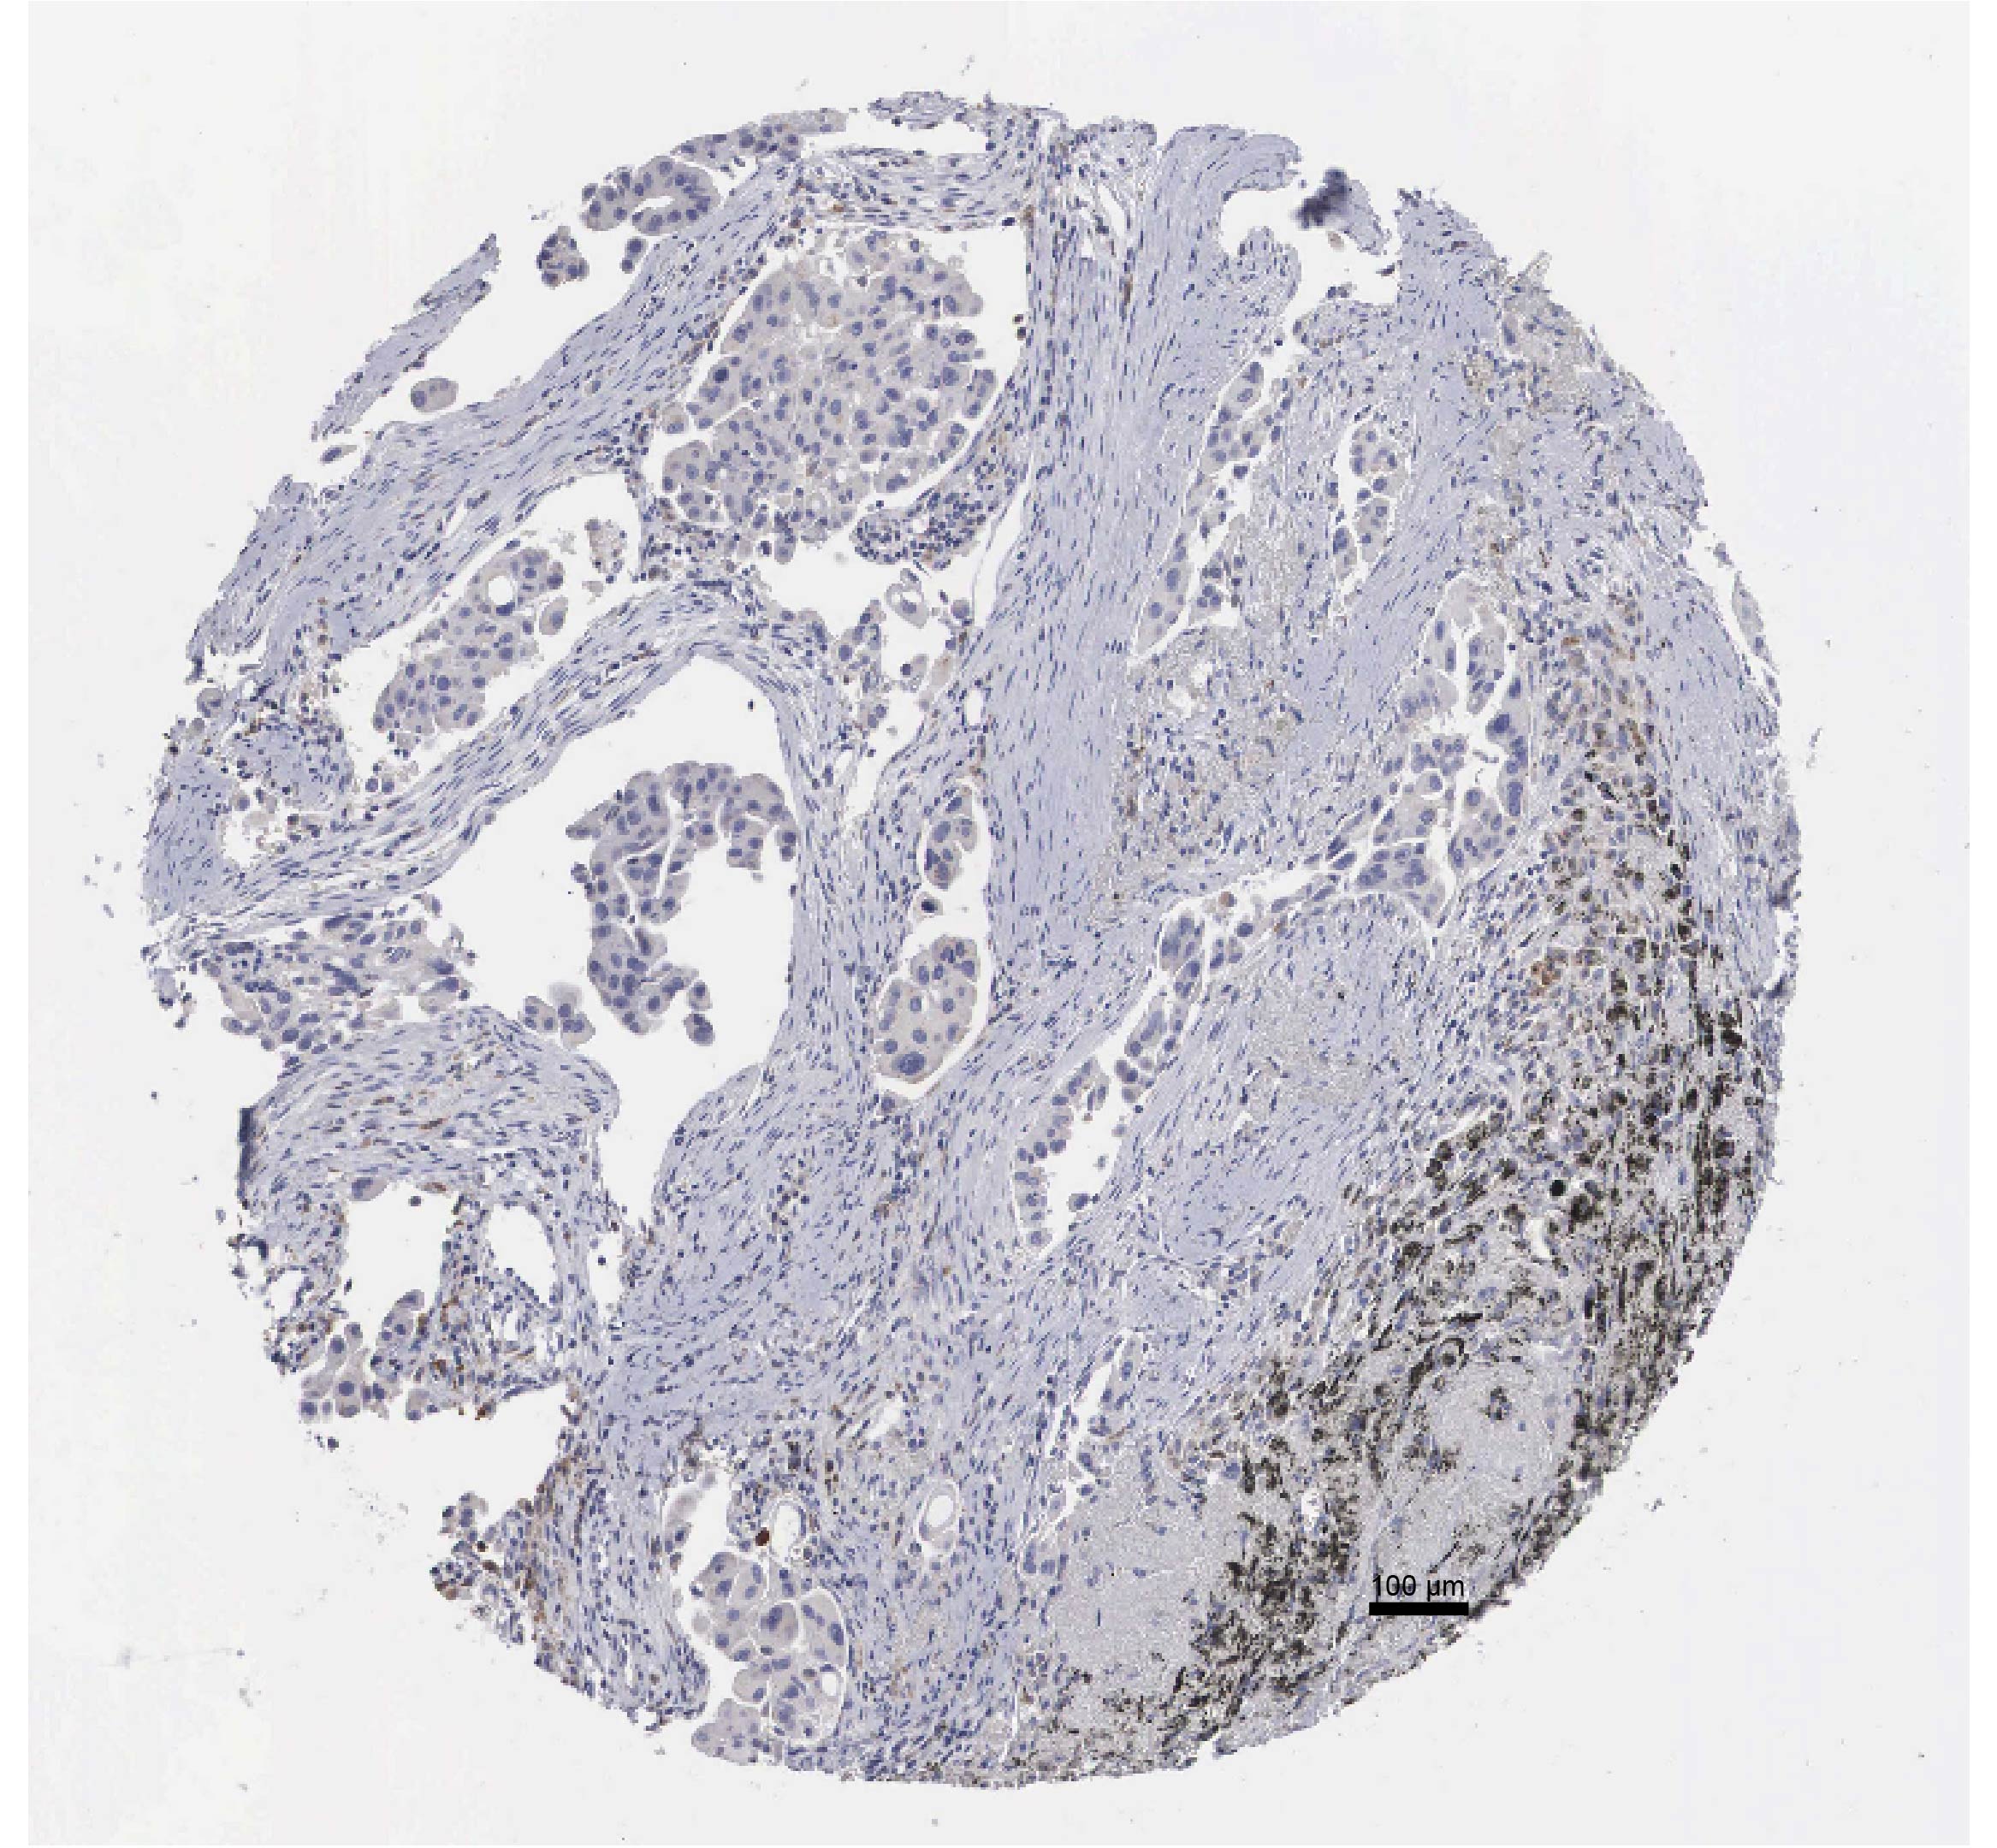
The small intern RNA (siRNA) synthesized by Merck KGaA (Shanghai, China) were transfected into HMOX1 cells using Lipofectamine™ 2000 (11,668,027, Invitrogen, Carlsbad, CA) and the negative control with scramble target sequence (target sequence: 5′-GCTGAGTTCATGAGGAACTTT-3′) was also purchased. Immunohistochemical staining information of HMOX1 was provided by Human Protein Atlas (HPA, https://www.proteinatlas.org/).
qRT-PCR analysis
Total RNAs were extracted from BEAS-2B, A549, and H2228 cells utilizing the TRIzol™ kit (15596026CN, Invitrogen, Carlsbad, CA), and the concentration of the extracted RNA was detected using a spectrophotometer. A cDNA synthesis kit (B300902, Sangon Biotech, Shanghai, China) was employed to synthesize the corresponding cDNA. Subsequently, PCR analysis was performed using SYBR Green Abstart PCR Mix (B110031, Sangon Biotech, Shanghai, China) and the CFX396 Touch™ PCR system (1845097, Bio-Rad, CA, USA) with an initial denaturation at 95 °C for 3 min (min), followed by 40 cycles at 94 °C for 15 s (s), at 60 °C for 30 s, and at 72 °C for 1 min. Finally, the relative mRNA expressions were calculated using the 2−ΔΔCT method, with GAPDH as an internal control reference [31]. The primers were designed using Primer Premier 6, and that of GAPDH was obtained from OriGene Technologies, Inc (Rockville, MD, USA). See Supplementary Table S1 for the primer sequences used in this study.
Wound healing assay
A549 and H2228 cells were inoculated into a 6-well plate at 1 × 10⁵ cells/well and cultivated until complete confluence. Subsequently, a controlled artificial wound on the cell monolayers was scratched using a 10 μL pipette tip, after which the cells were maintained in a serum-free medium at 37 °C. Cell images were captured at 0 and 48 h(s) under an Eclipse Ts2R microscope (Nikon, Tokyo, Japan).
Transwell assay
The upper Transwell chamber (pore size: 8.0 μm; 3422, Corning, Inc, NY, USA) coated with Matrigel matrix (M8370, Solarbio Lifesciences, Beijing, China) contained 200 μL of serum-free medium and added with A549 and H2228 cells (2 × 10⁵ cells each). Meanwhile, the corresponding lower chamber was added with 700 μL of complete medium. After culturing for 48 h, 4 % paraformaldehyde (P1110, Solarbio Lifesciences) was used to fix the cells invading the lower chamber, followed by cell staining with 0.1 % crystal violet staining solution (G1063, Solarbio Lifesciences) for 15 min. The invaded cells were observed and quantified under the same optical microscope used in the previous section.
Verification of the prognostic model and development of a nomogram
Univariate and multivariate Cox regression analyses were performed on the RiskScore and clinical characteristics, based on which a nomogram was developed. The prediction accuracy of the model was tested according to calibration curve analysis and decision curve analysis (DCA).
Mutation characteristics of the risk model
The ‘maftools’ package (version 2.14.0) in R [32] was utilized to identify the top 20 frequently mutated genes in LUAD samples. Genomic differences between high-risk and low-risk groups were compared in terms of distributions of tumor mutation burden (TMB), homologous recombination defects (HRD), number of segments, and fraction altered [33]. Additionally, copy number variation (CNV) profiles of specific genes in the risk model were analyzed.
Prediction of potential therapeutic target drugs and drug sensitivity analysis
The Cancer Cell Line Encyclopedia (CCLE) database (https://sites.broadinstitute.org/ccle) was utilized as a training set to identify key target drugs for patients in the two risk groups. The Cancer Therapeutics Response Portal (CTRP) and Profiling Relative Inhibition Simultaneously in Mixtures (PRISM) methodologies were employed to predict the sensitivity of patients in the TCGA dataset to various drugs. Effective regulatory drugs were screened under the criterion of |log2(Fold Change)|>0.2, ensuring that the selected drugs exhibited significant differences in their therapeutic effects.
Statistical analysis
All the statistical analyses were conducted using R language (version 3.6.0) or GraphPad Prism (version 8.0). Statistical analysis was performed with unpaired Student’s t-test or one-way ANOVA followed by post hoc Tukey’s multiple comparison tests. Differences between two groups of continuous variables were compared by the Wilcoxon rank-sum test. Spearman correlation analysis was used to compute correlations. p<0.05 was considered to be statistically significant. SangerBox (http://sangerbox.com/) provided analytical assistance for this study [34].
Results
Single-cell clustering results
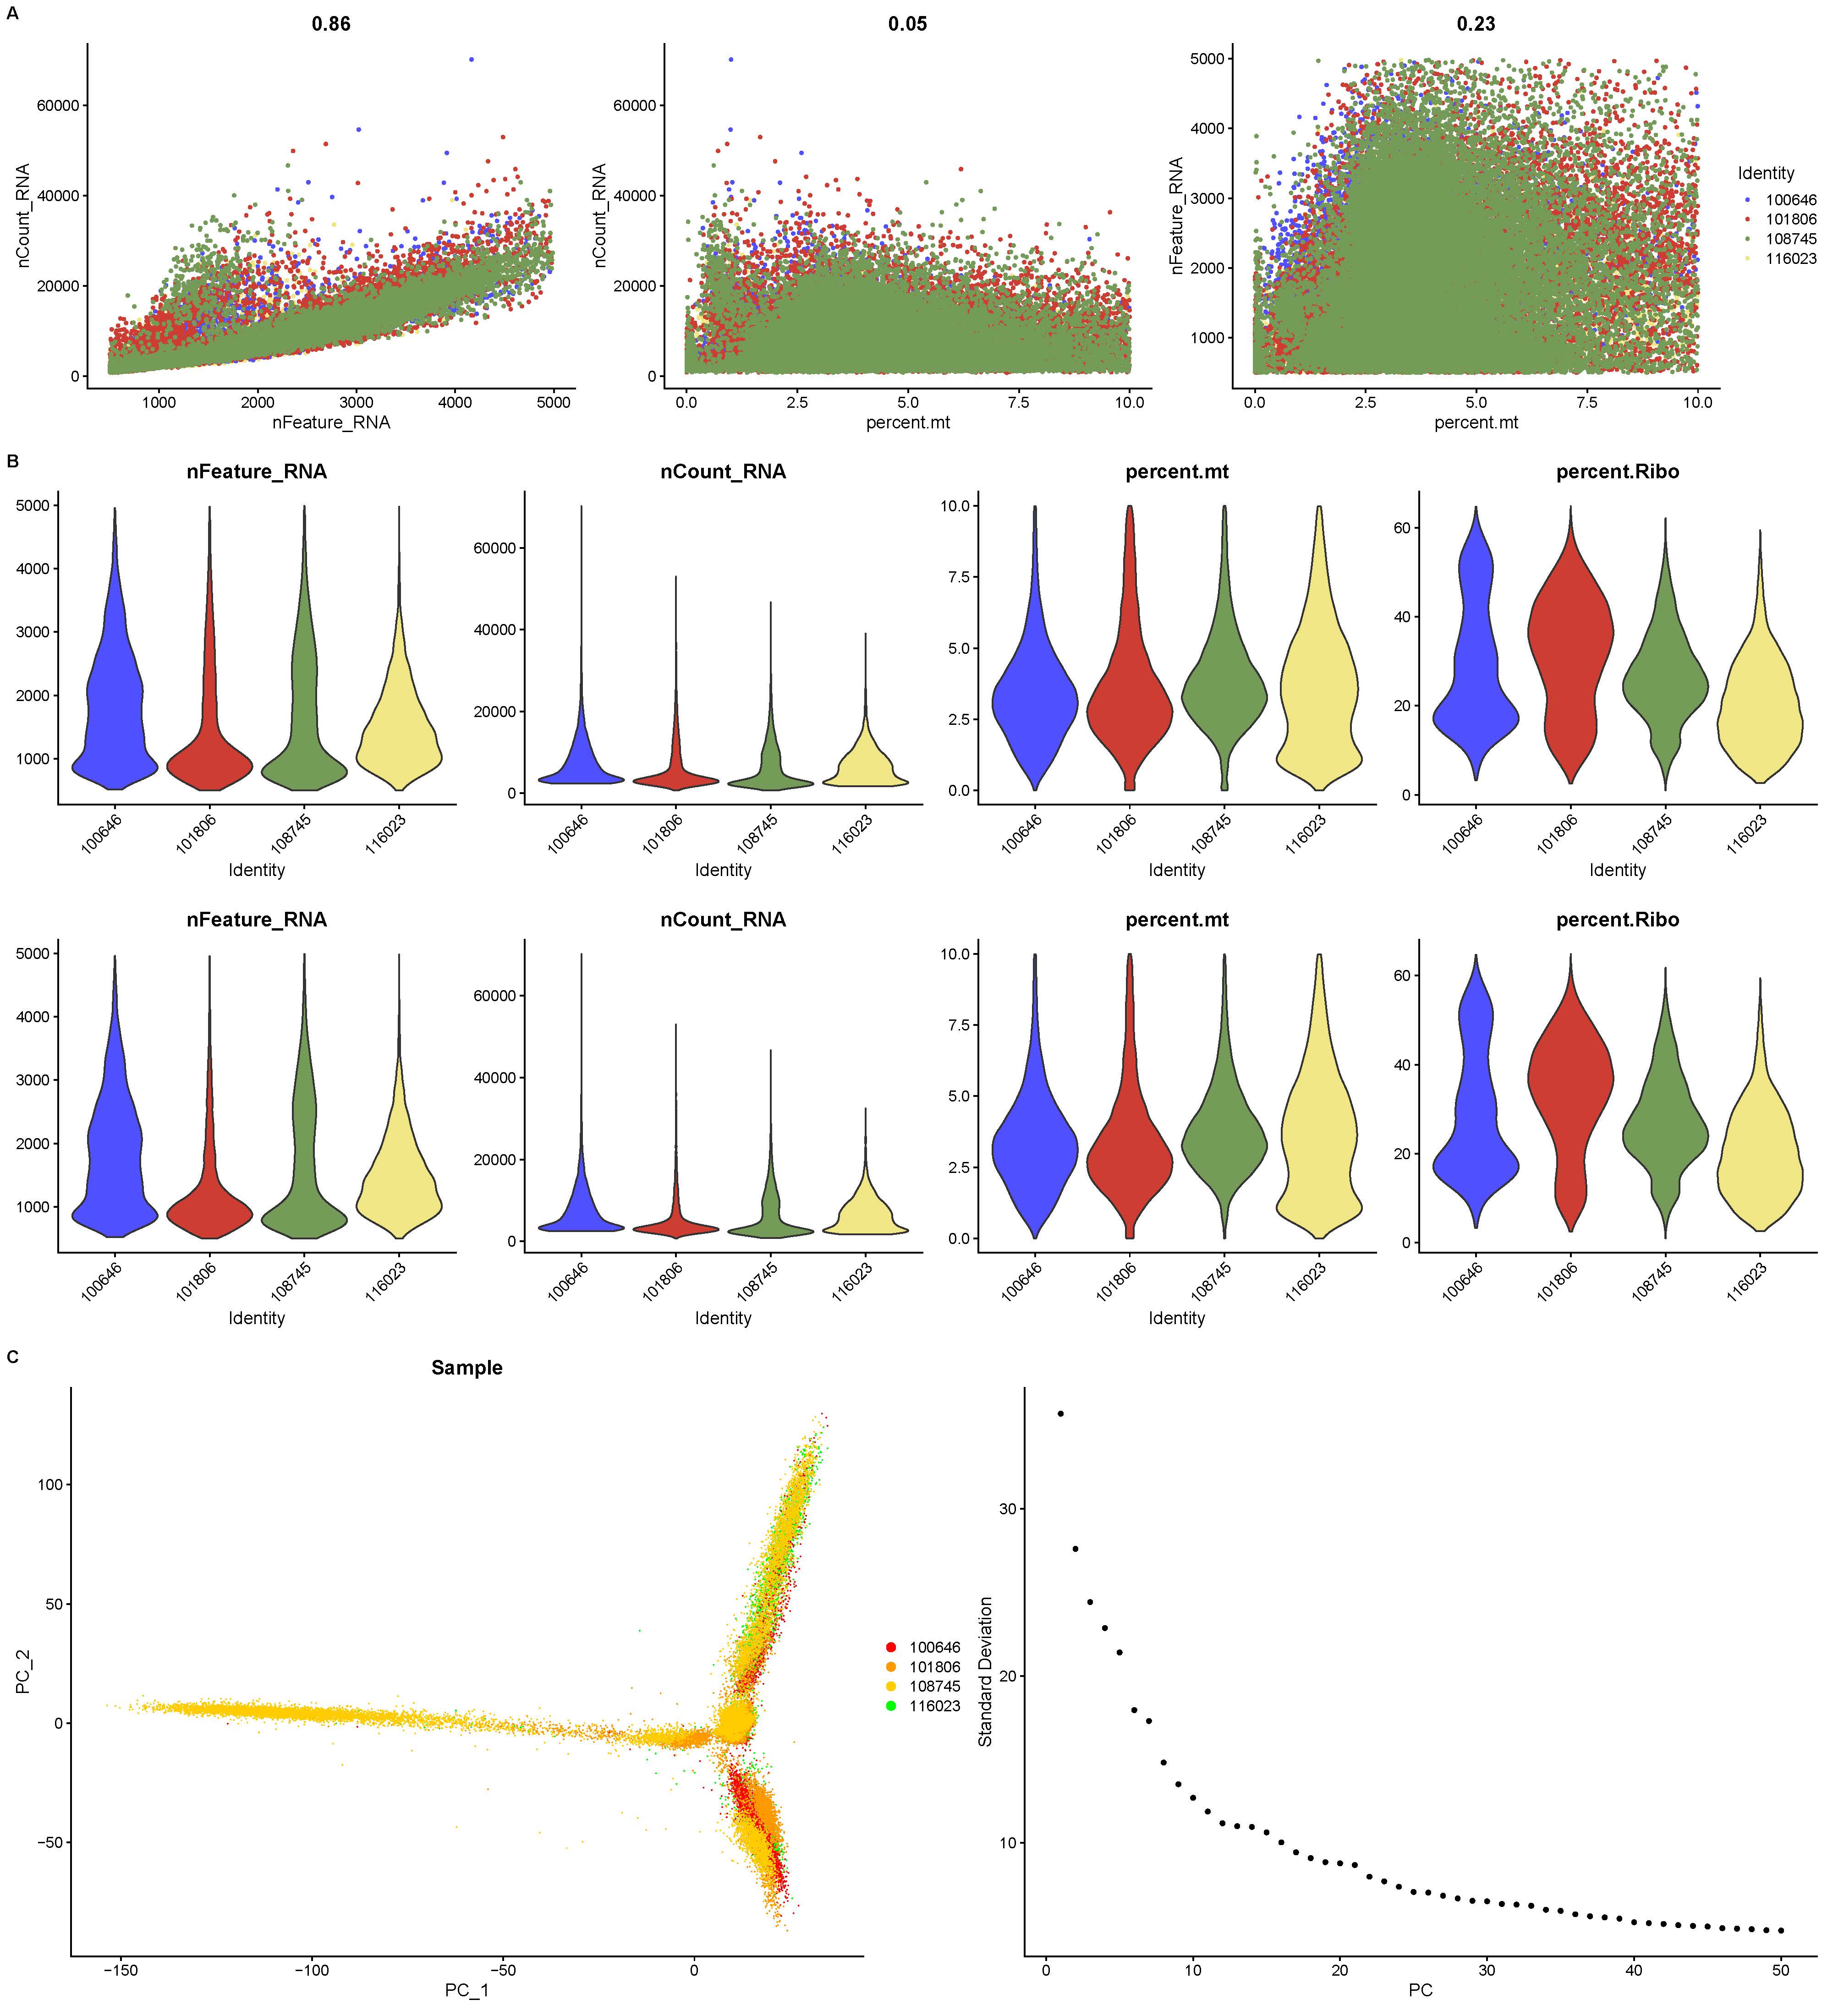
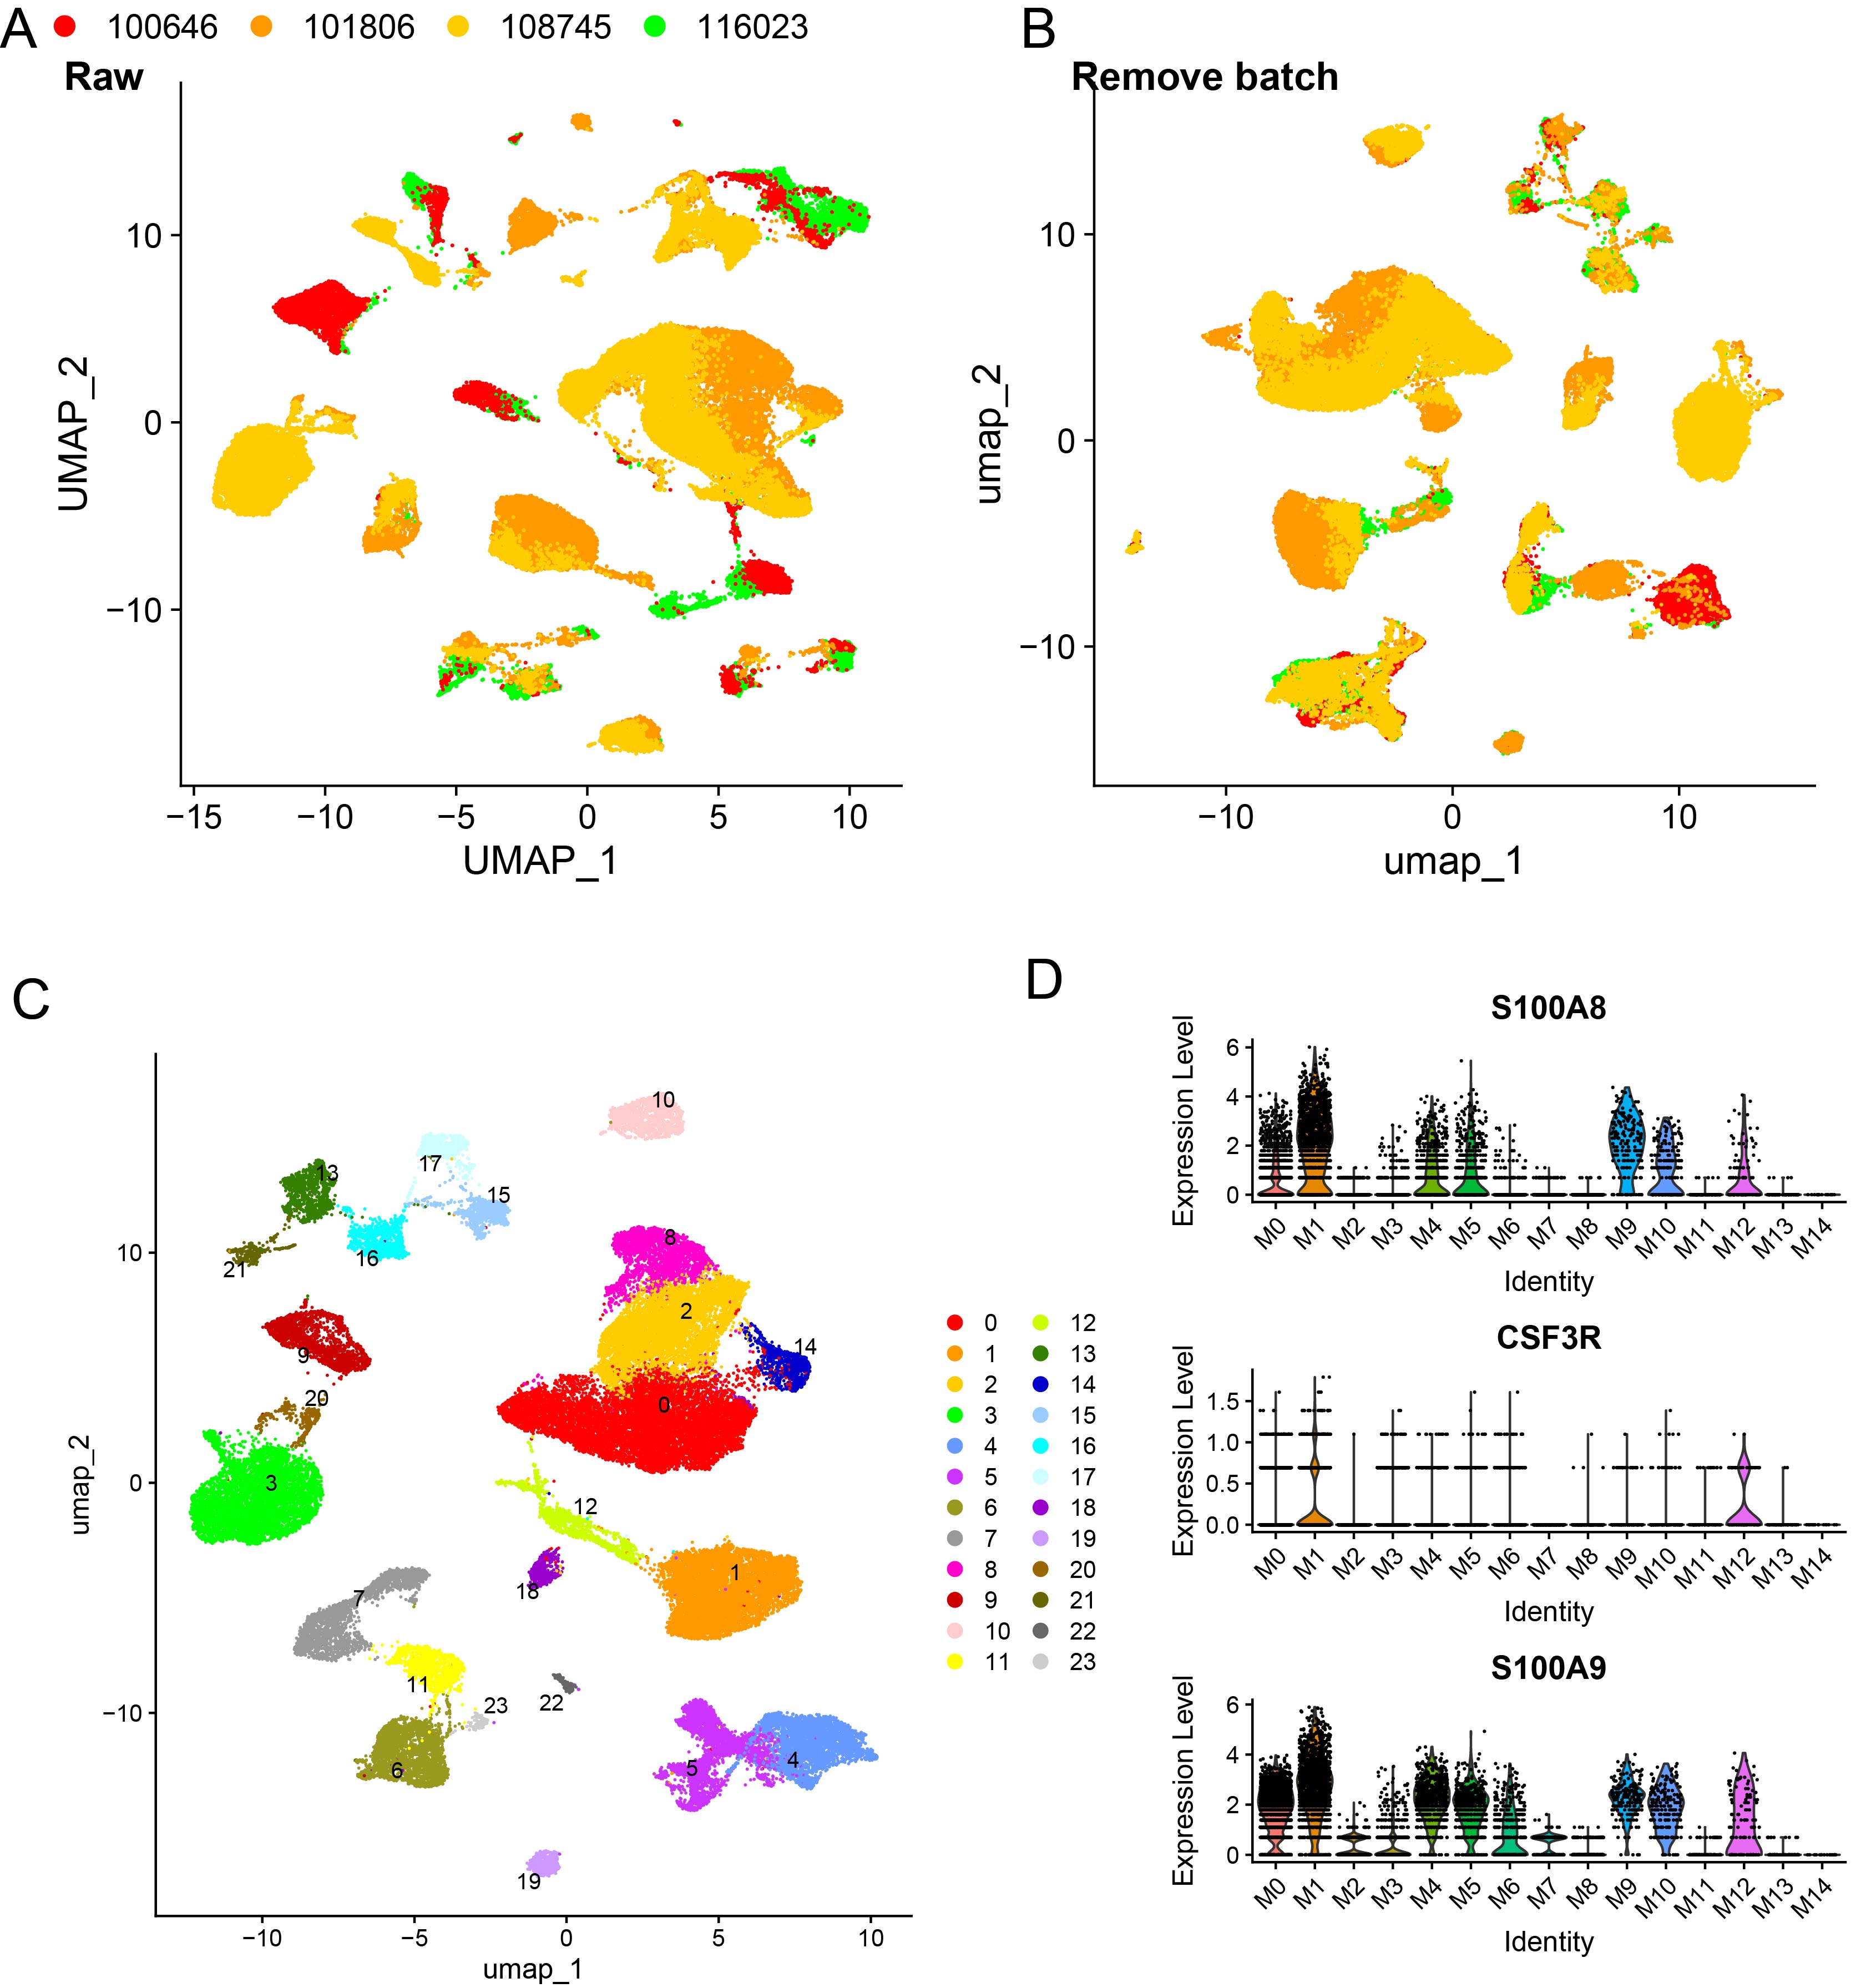
After filtering and quality control of the obtained data, we successfully merged a dataset containing 54,301 high-quality cells. Correlation analysis revealed a significant correlation between UMI and mRNAs, while the UMI/mRNA ratio was not significantly correlated with the content of mitochondrial genes, indicating that mitochondrial genes did not significantly affect the results of the current study (Supplementary Figure S1A). Additionally, the violin plots of the cell quality before and after filtering and quality control (Supplementary Figure S1B) showed significant improvement in the data quality. The results of PCA dimensionality reduction are displayed in Supplementary Figure S1C. Data from the single-cell samples were normalized and standardized (Supplementary Figure S2A, B). After dimensionality reduction and clustering, a total of 24 cellular subsets were identified (Supplementary Figure S2C). In particular, neutrophils were annotated using known marker genes S100A8, S100A9, and CSF3R (Supplementary Figure S2D).
A total of 11 major clusters were classified after data normalization, batch effect removal, dimensionality reduction, clustering, and cell type annotation of these 54,301 single cells (Figure 1A and B). Specifically, these 11 clusters were B_cells, T_cells, CMP, DC, Endothelial, Epithelial, Macrophage, Mesenchymal, Monocyte, NK, and Neutrophils (the focus of this study). The expressions of the top 5 marker genes that contributed most prominently to these 11 cell clusters were analyzed (Figure 1C), and it was observed that different types of cells were specifically enriched in different samples (Figure 1D). Further dimensionality reduction and clustering of neutrophils divided 4 neutrophil subsets (Figure 1E), namely, Neu0, Neu1, Neu2, and Neu3. Functional enrichment analysis showed unique functional characteristics of these four neutrophil subsets (Figure 1F). Analysis of the enriched pathways of these four subsets revealed that the Neu0 subset was closely related to cellular energy metabolism, specifically affecting ATP-related energy pathways. The Neu1 and Neu3 subsets had similar pathways that mainly influenced immune system function, antigen processing, and presentation as well as cellular interactions. The Neu2 subset was primarily enriched in pathways closely related to intracellular protein synthesis and metabolism.
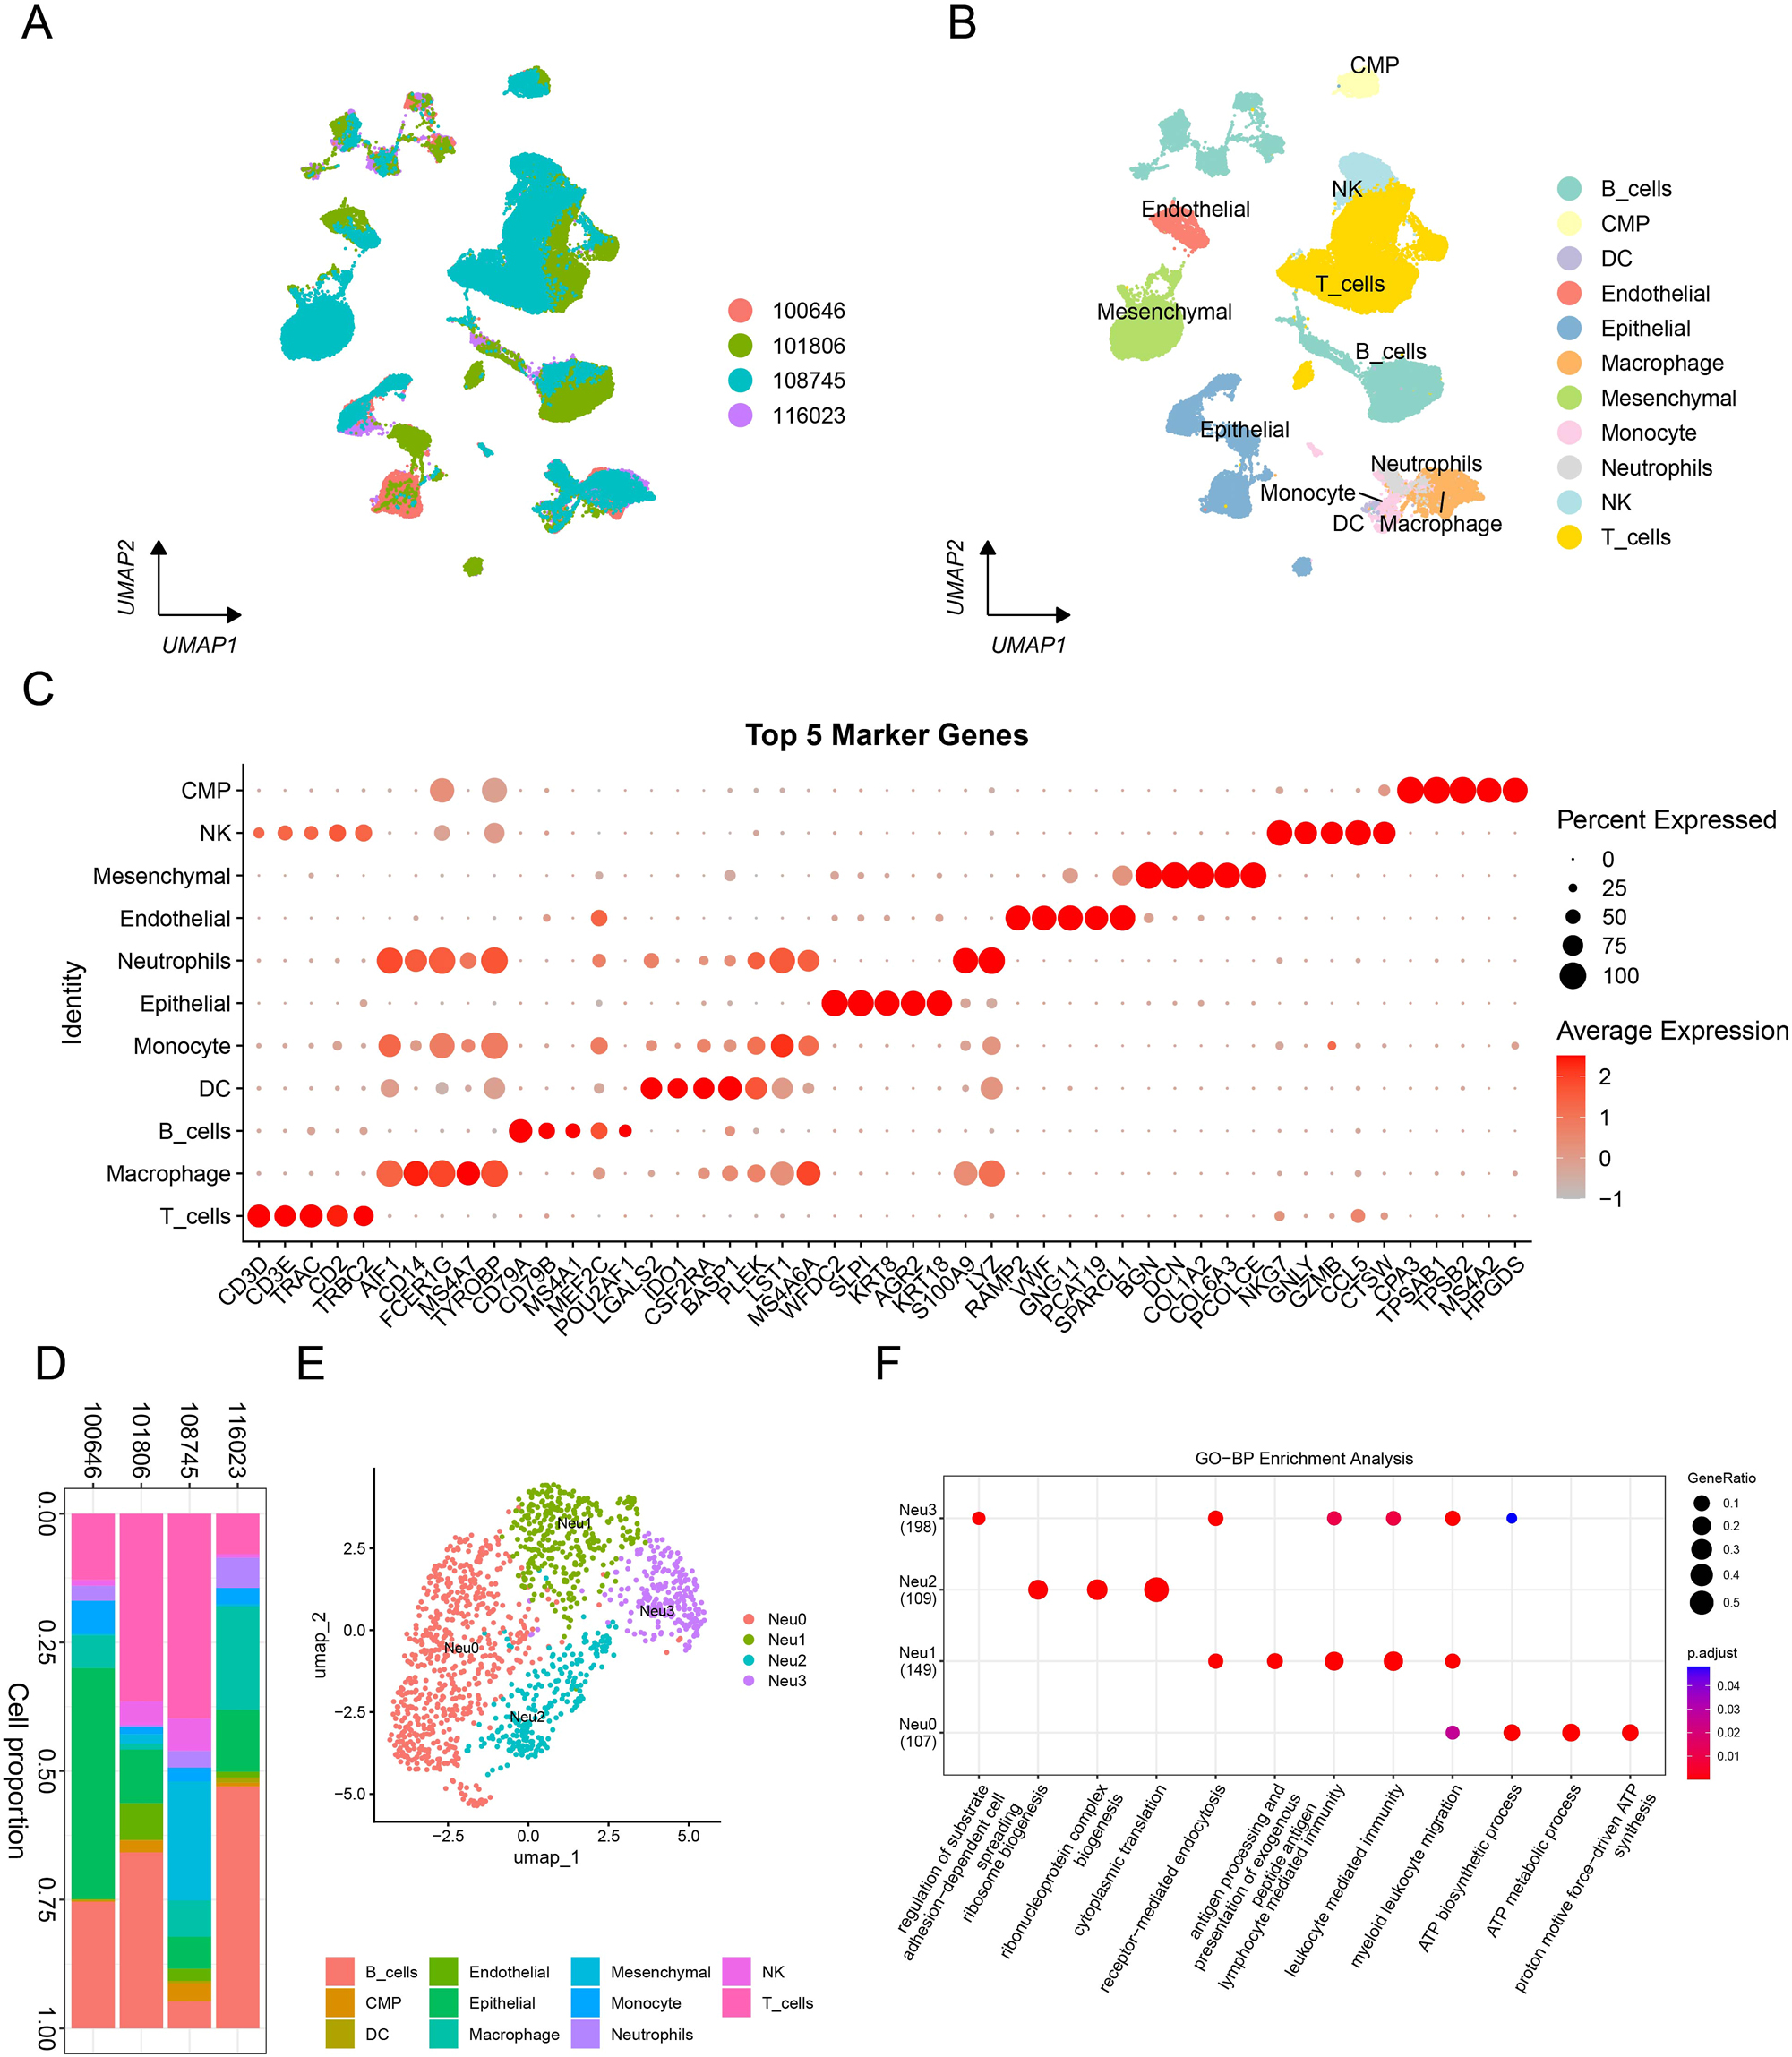
The classification and functional enrichment analysis of neutrophil subsets. (A, B) Distribution of samples and cell types, resulting in the identification of 11 major clusters through annotation. (C) Exhibition of the expression patterns of the top 5 marker genes across the 11 cell types. (D) The percentage of each cell type present in each sample. (E) UMAP dimensionality reduction plot reveals four neutrophil subsets, namely Neu0, Neu1, Neu2, and Neu3. (F) Functional enrichment analysis bubble plot of the four neutrophil subsets. Note: 100646: MRC003; 101806: MRC007; 108745: MRC009; 116023: MCR001.
Neutrophil subpopulation and TF analysis
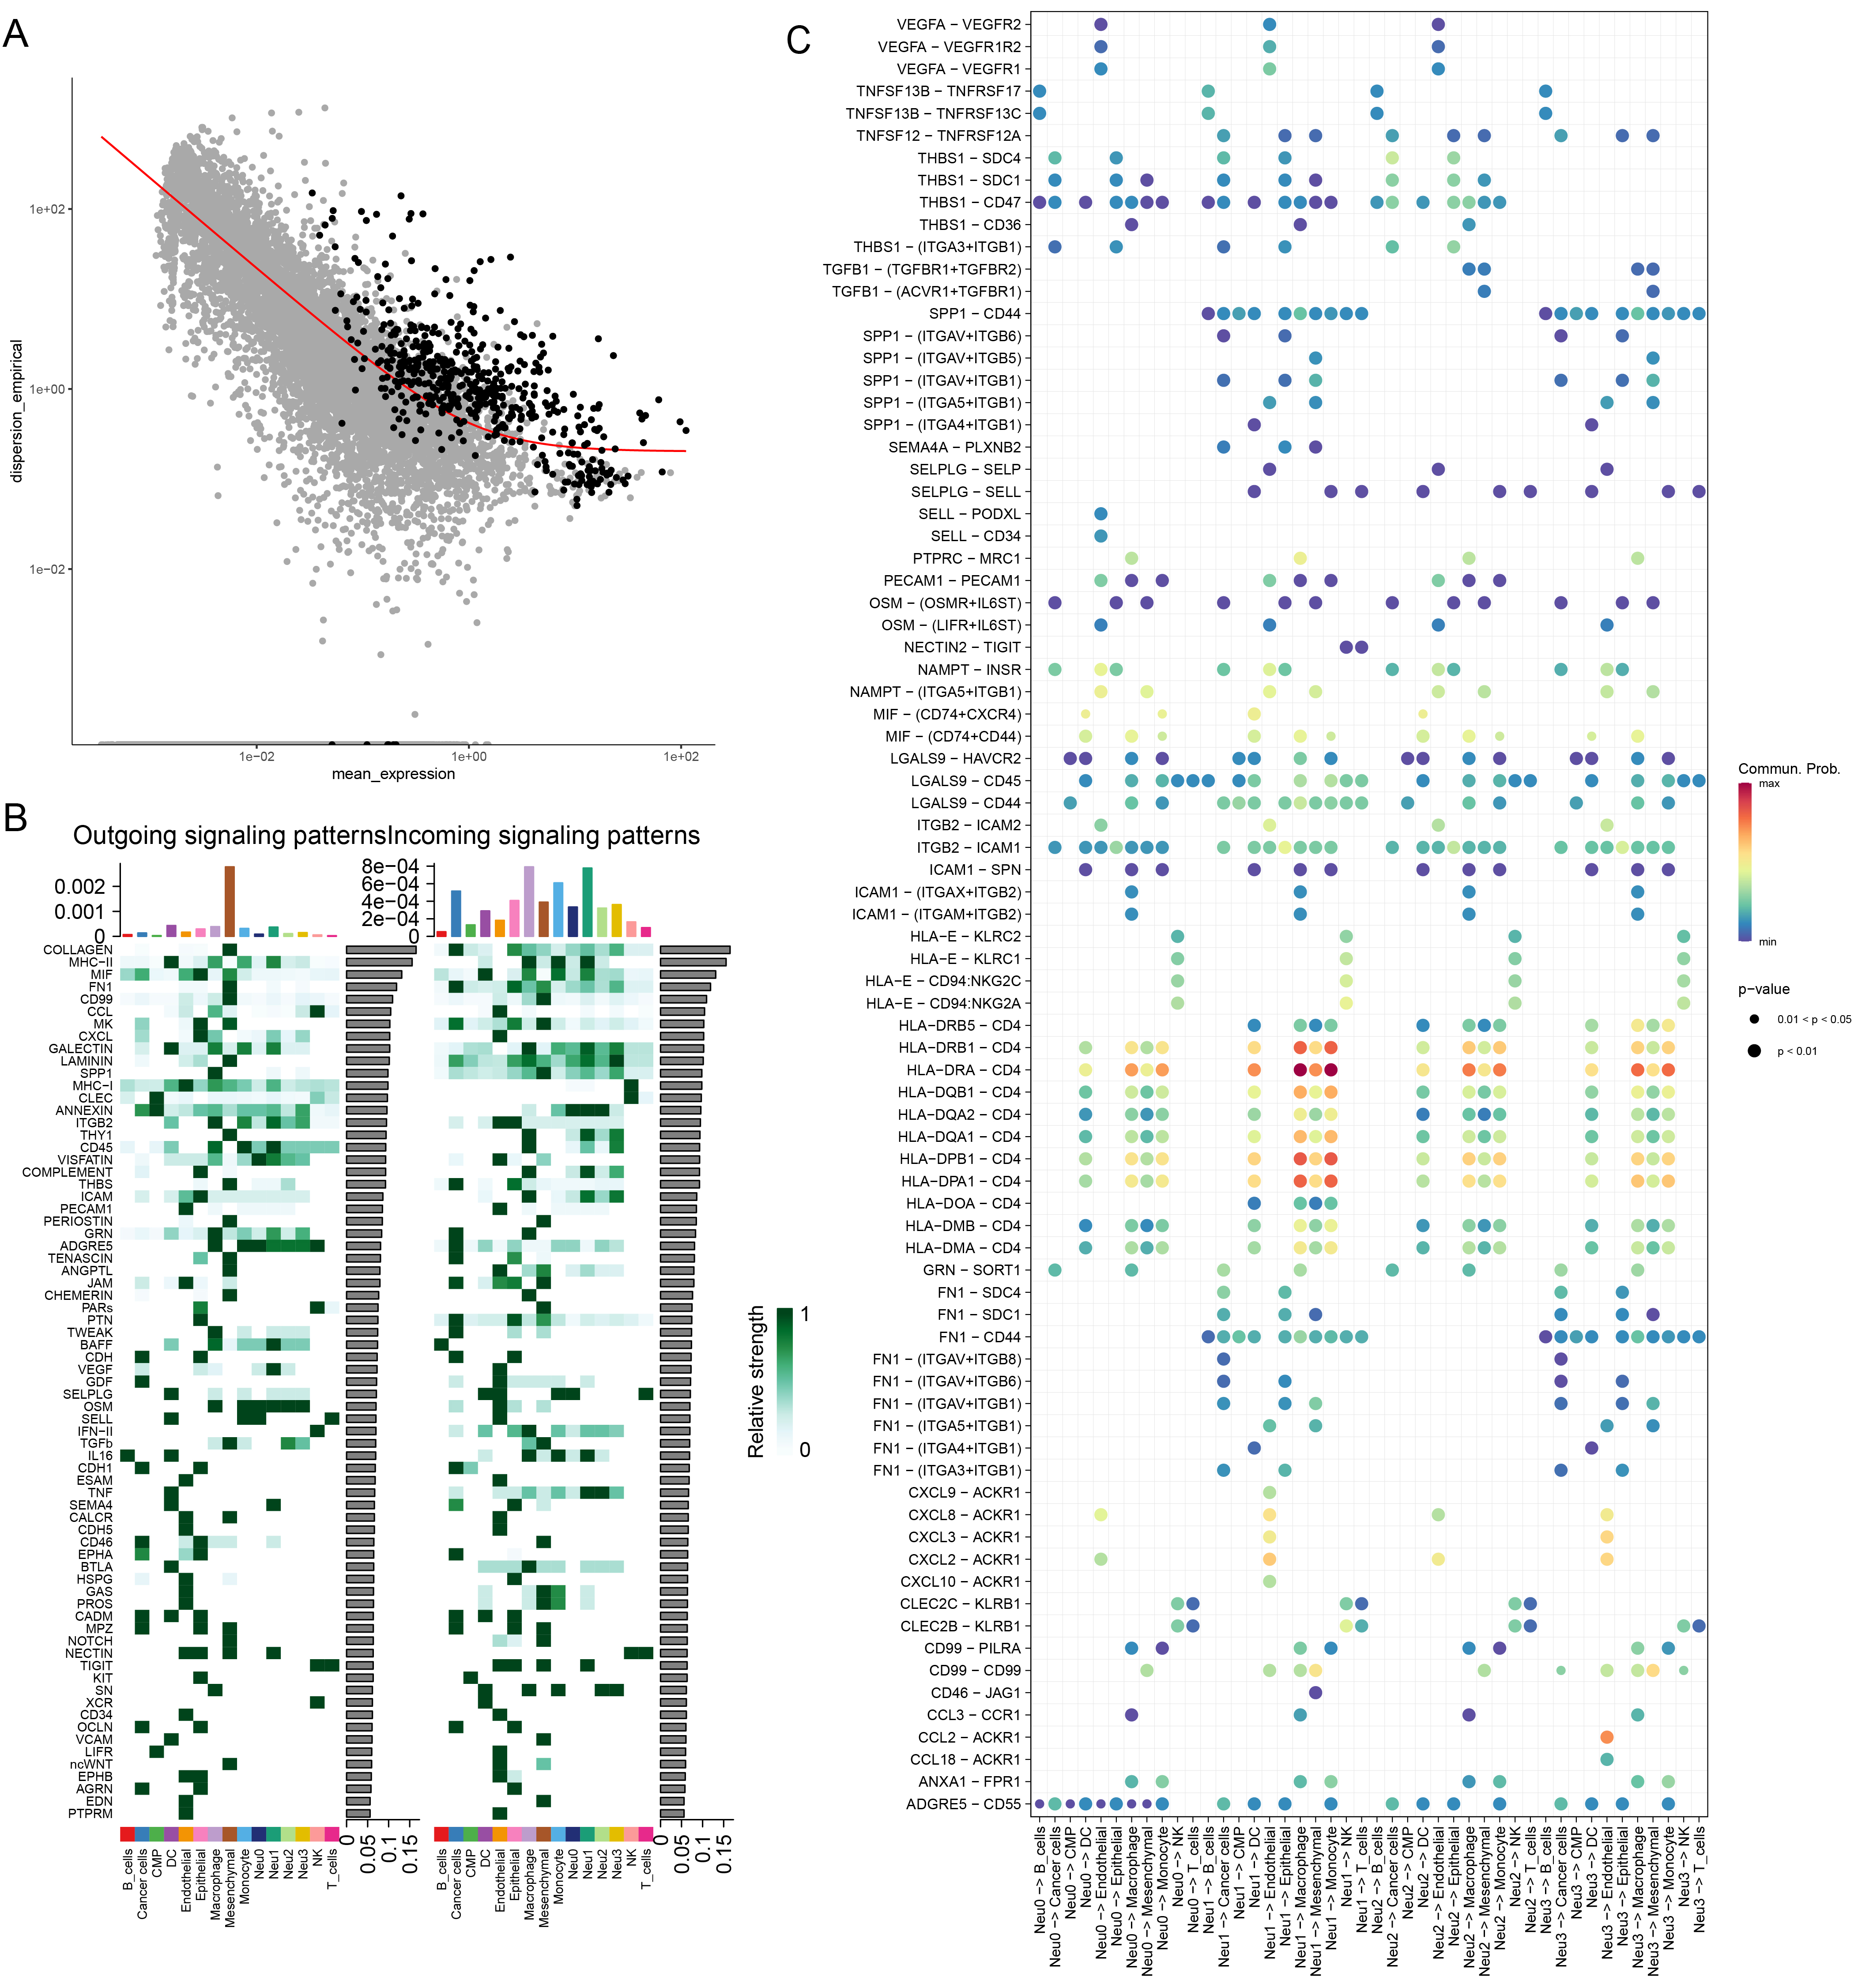
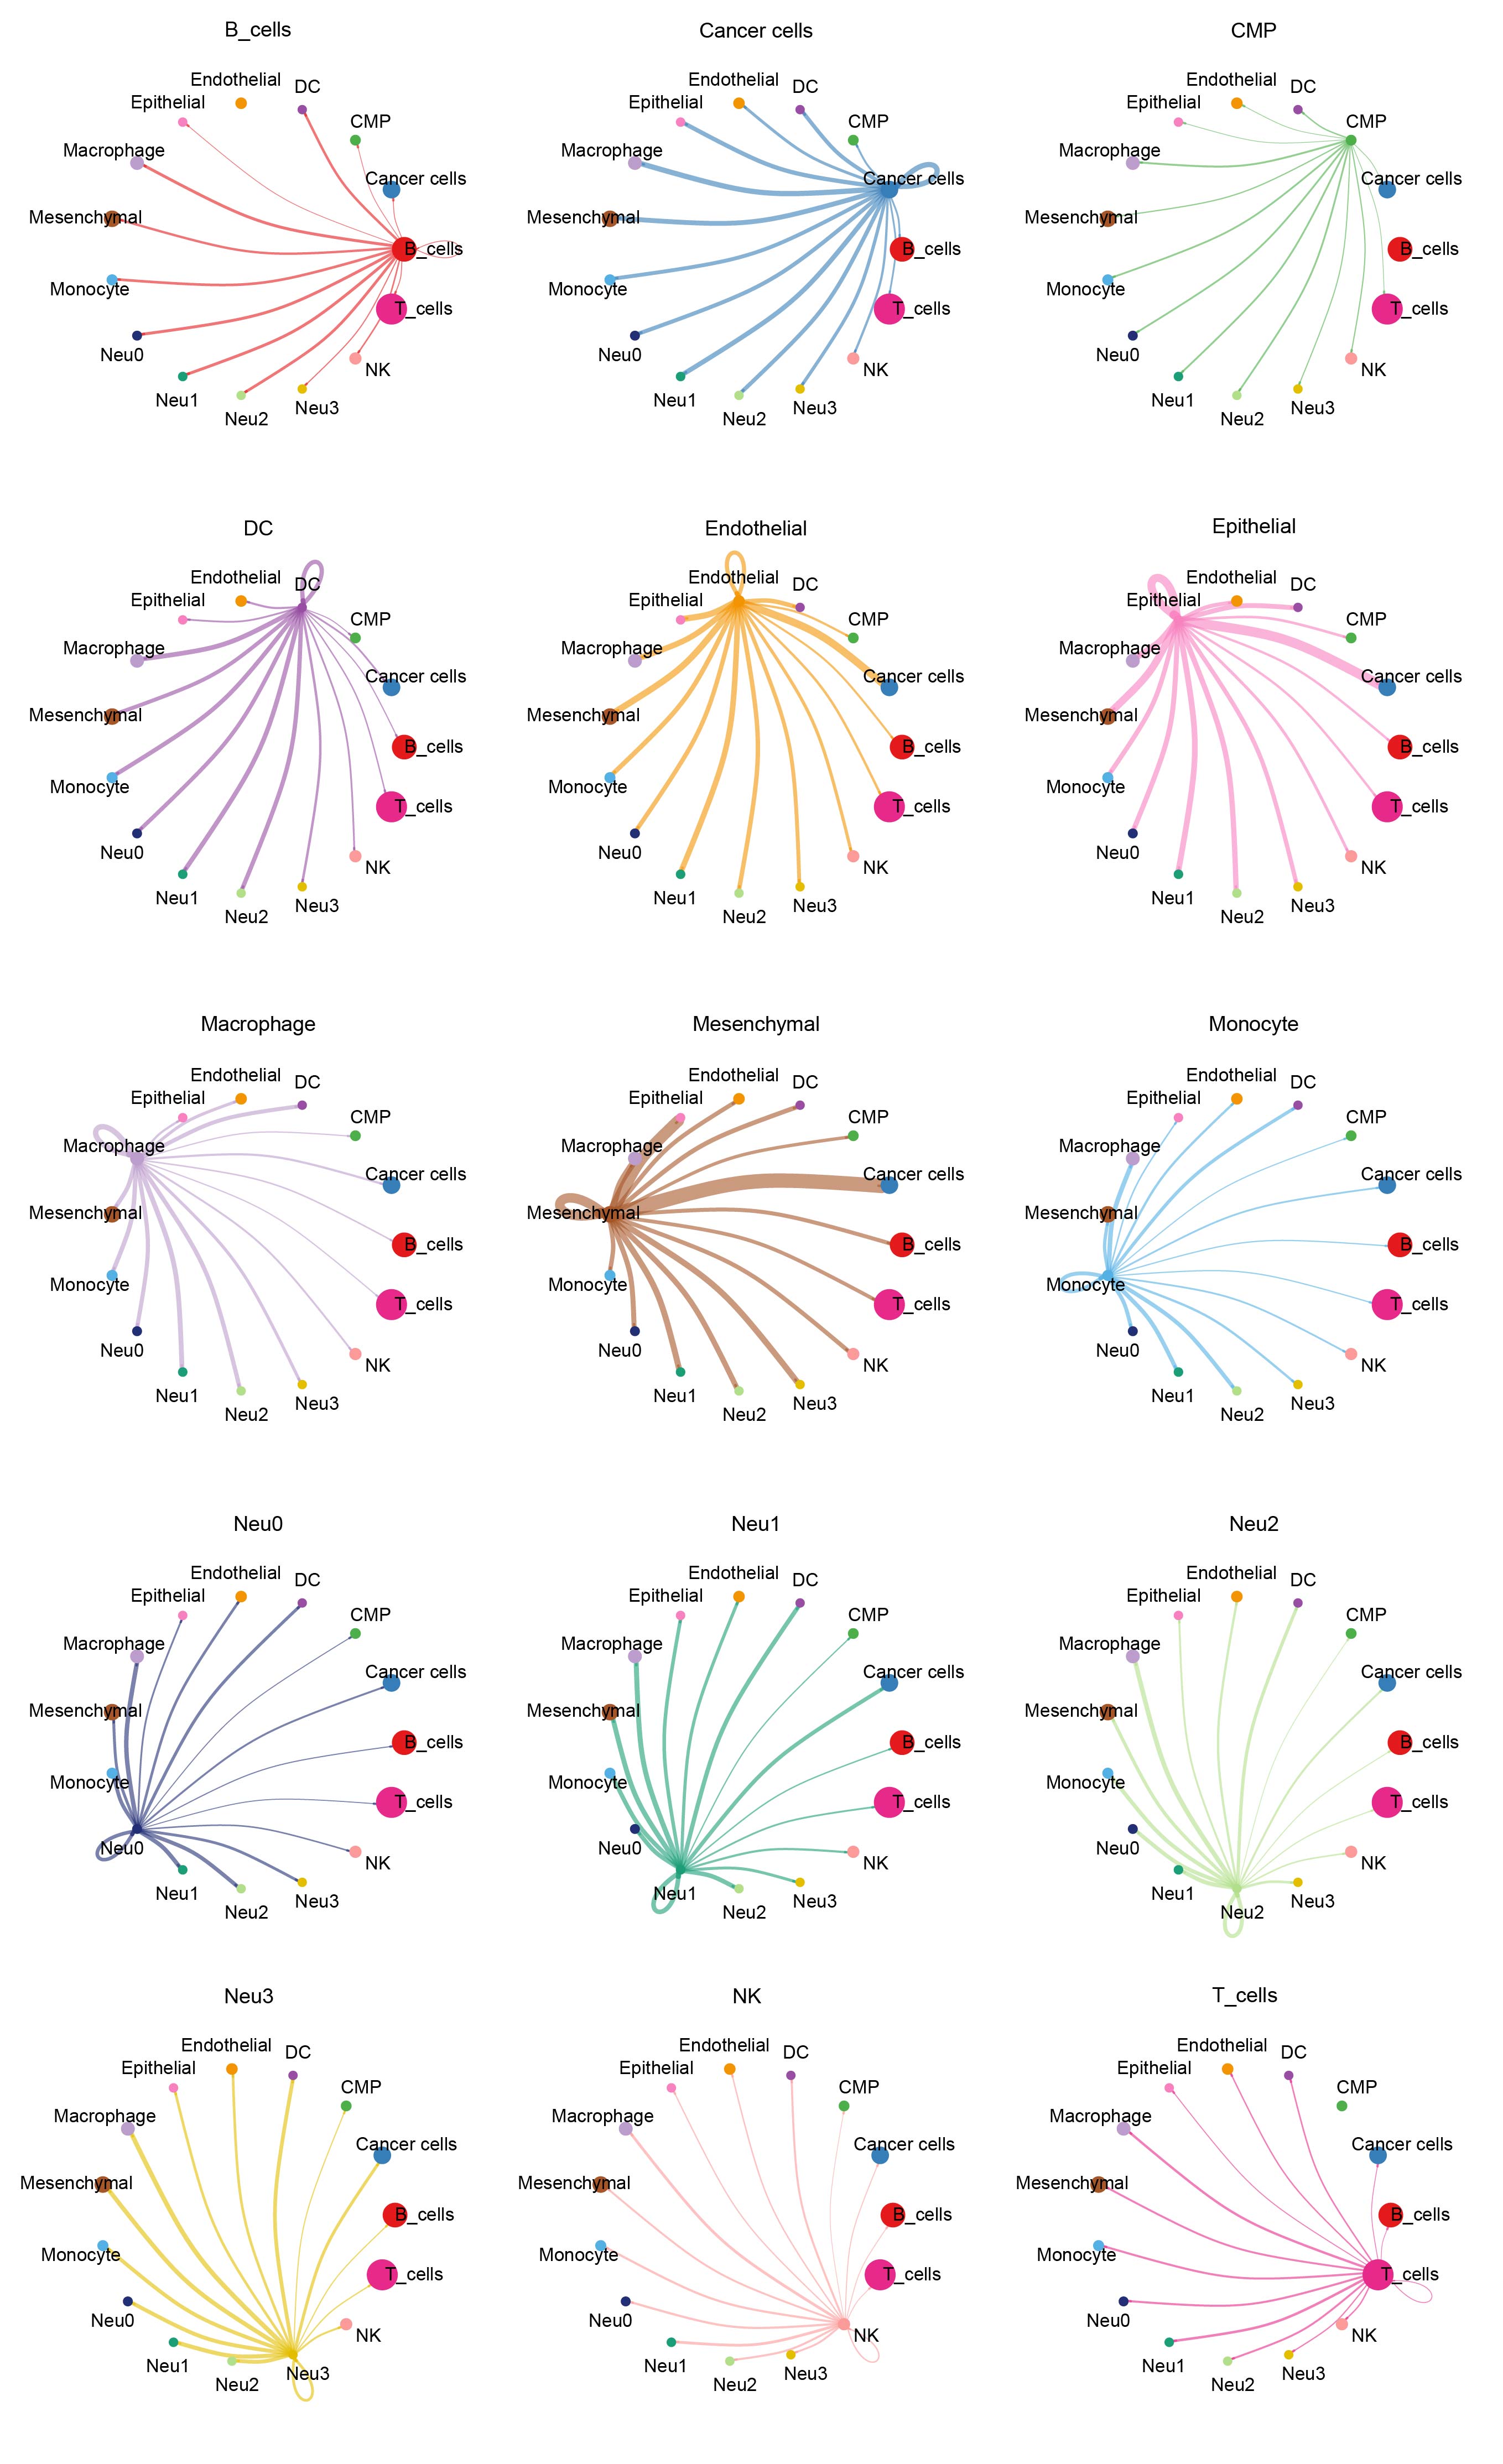
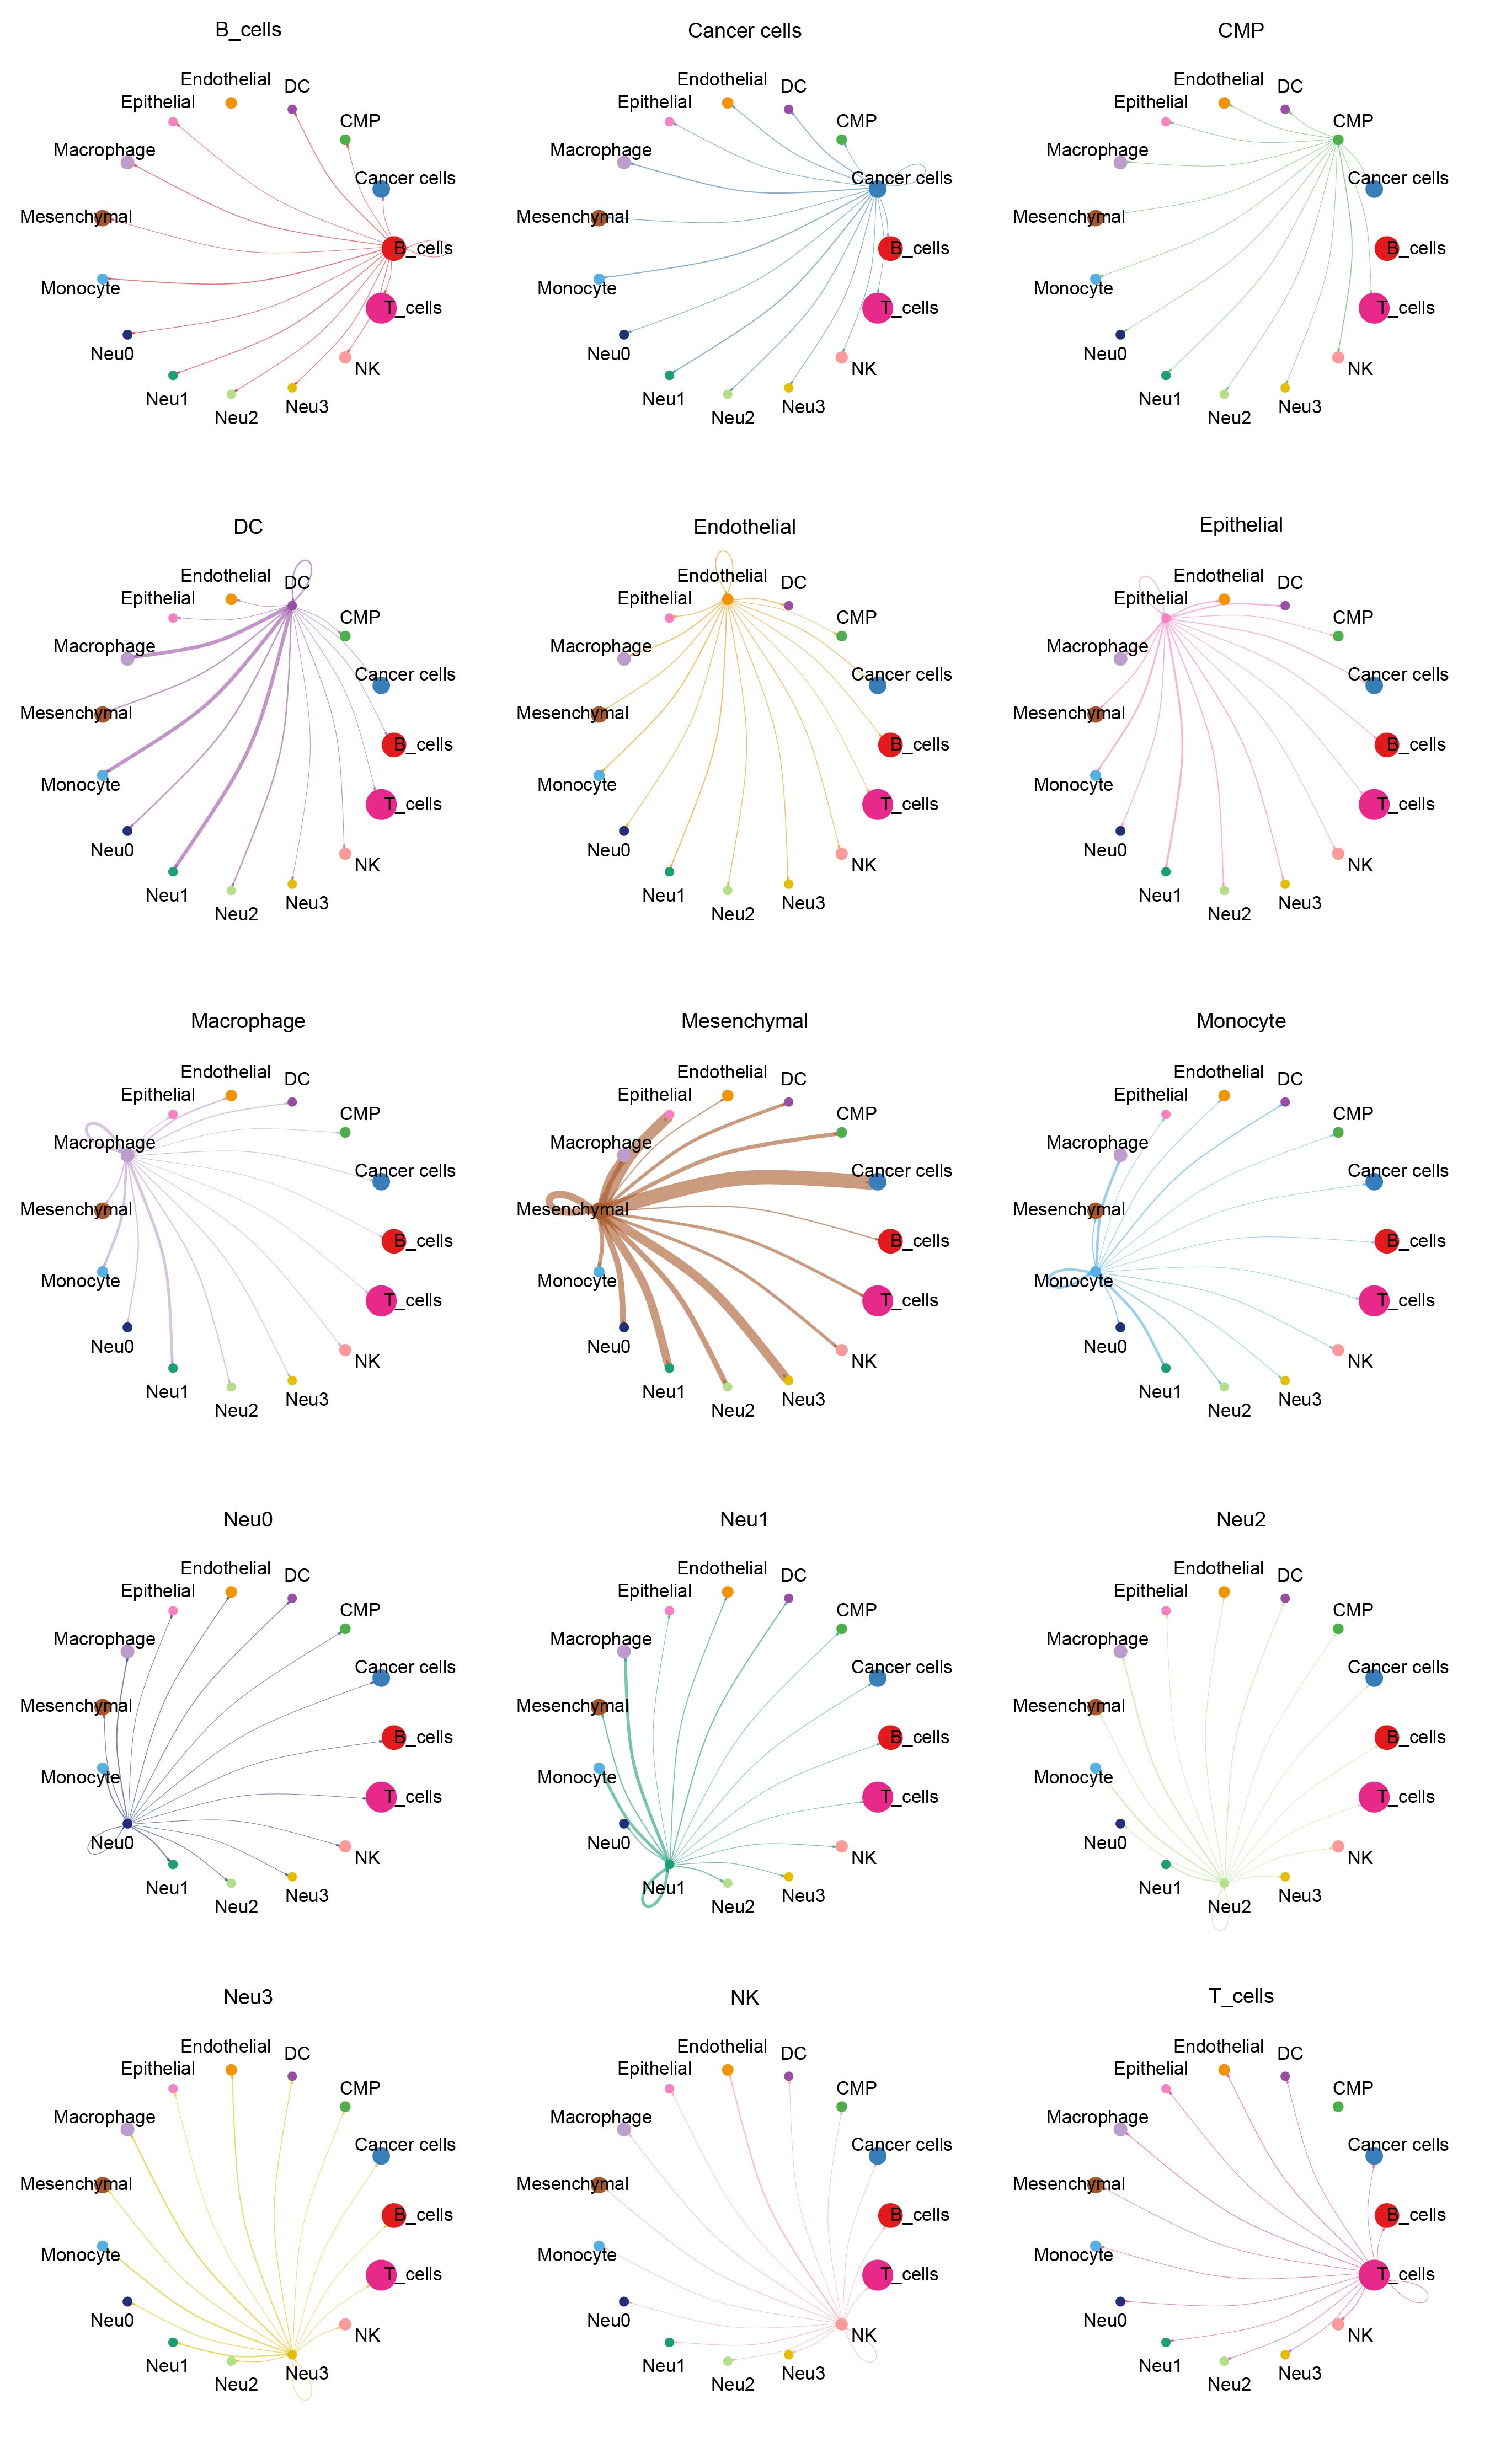
Cluster analysis successfully distinguished malignant cells (Figure 2A and B). By selecting the top 500 genes with the most significant expression alterations (Supplementary Figure S3A), five distinct functional states of neutrophils were characterized (Figure 2C). Notably, these neutrophil subpopulations played distinct roles in the temporal progression framework. Meanwhile, we developed a cell communication network to analyze the interactions between cells and their signal transmission patterns (Figure 2D and E). Finally, TF prediction analysis revealed specific TF activation and inhibition in different neutrophil subpopulations (Figure 2F), and that the expressions of these TFs in cells varied in different subpopulations (Figure 2G). Furthermore, we analyzed the patterns of cellular signals to reveal the signaling pathways and mechanisms of the signals in cellular networks (Supplementary Figure S3B). Complex interactions of the receptor-ligand pairs between neutrophil subsets and other cellular subsets were visualized in bubble diagrams (Supplementary Figure S3C). Prediction results of the amount and intensity of signals exchanged between various cell types in the cell communication network are presented in Supplementary Figures S4, 5. It was found that the Neu0 subpopulation was most inhibited by specific TFs, while the Neu3 subpopulation was most activated by specific TFs, and that the expression levels of these specific TFs were the highest in the Neu3.
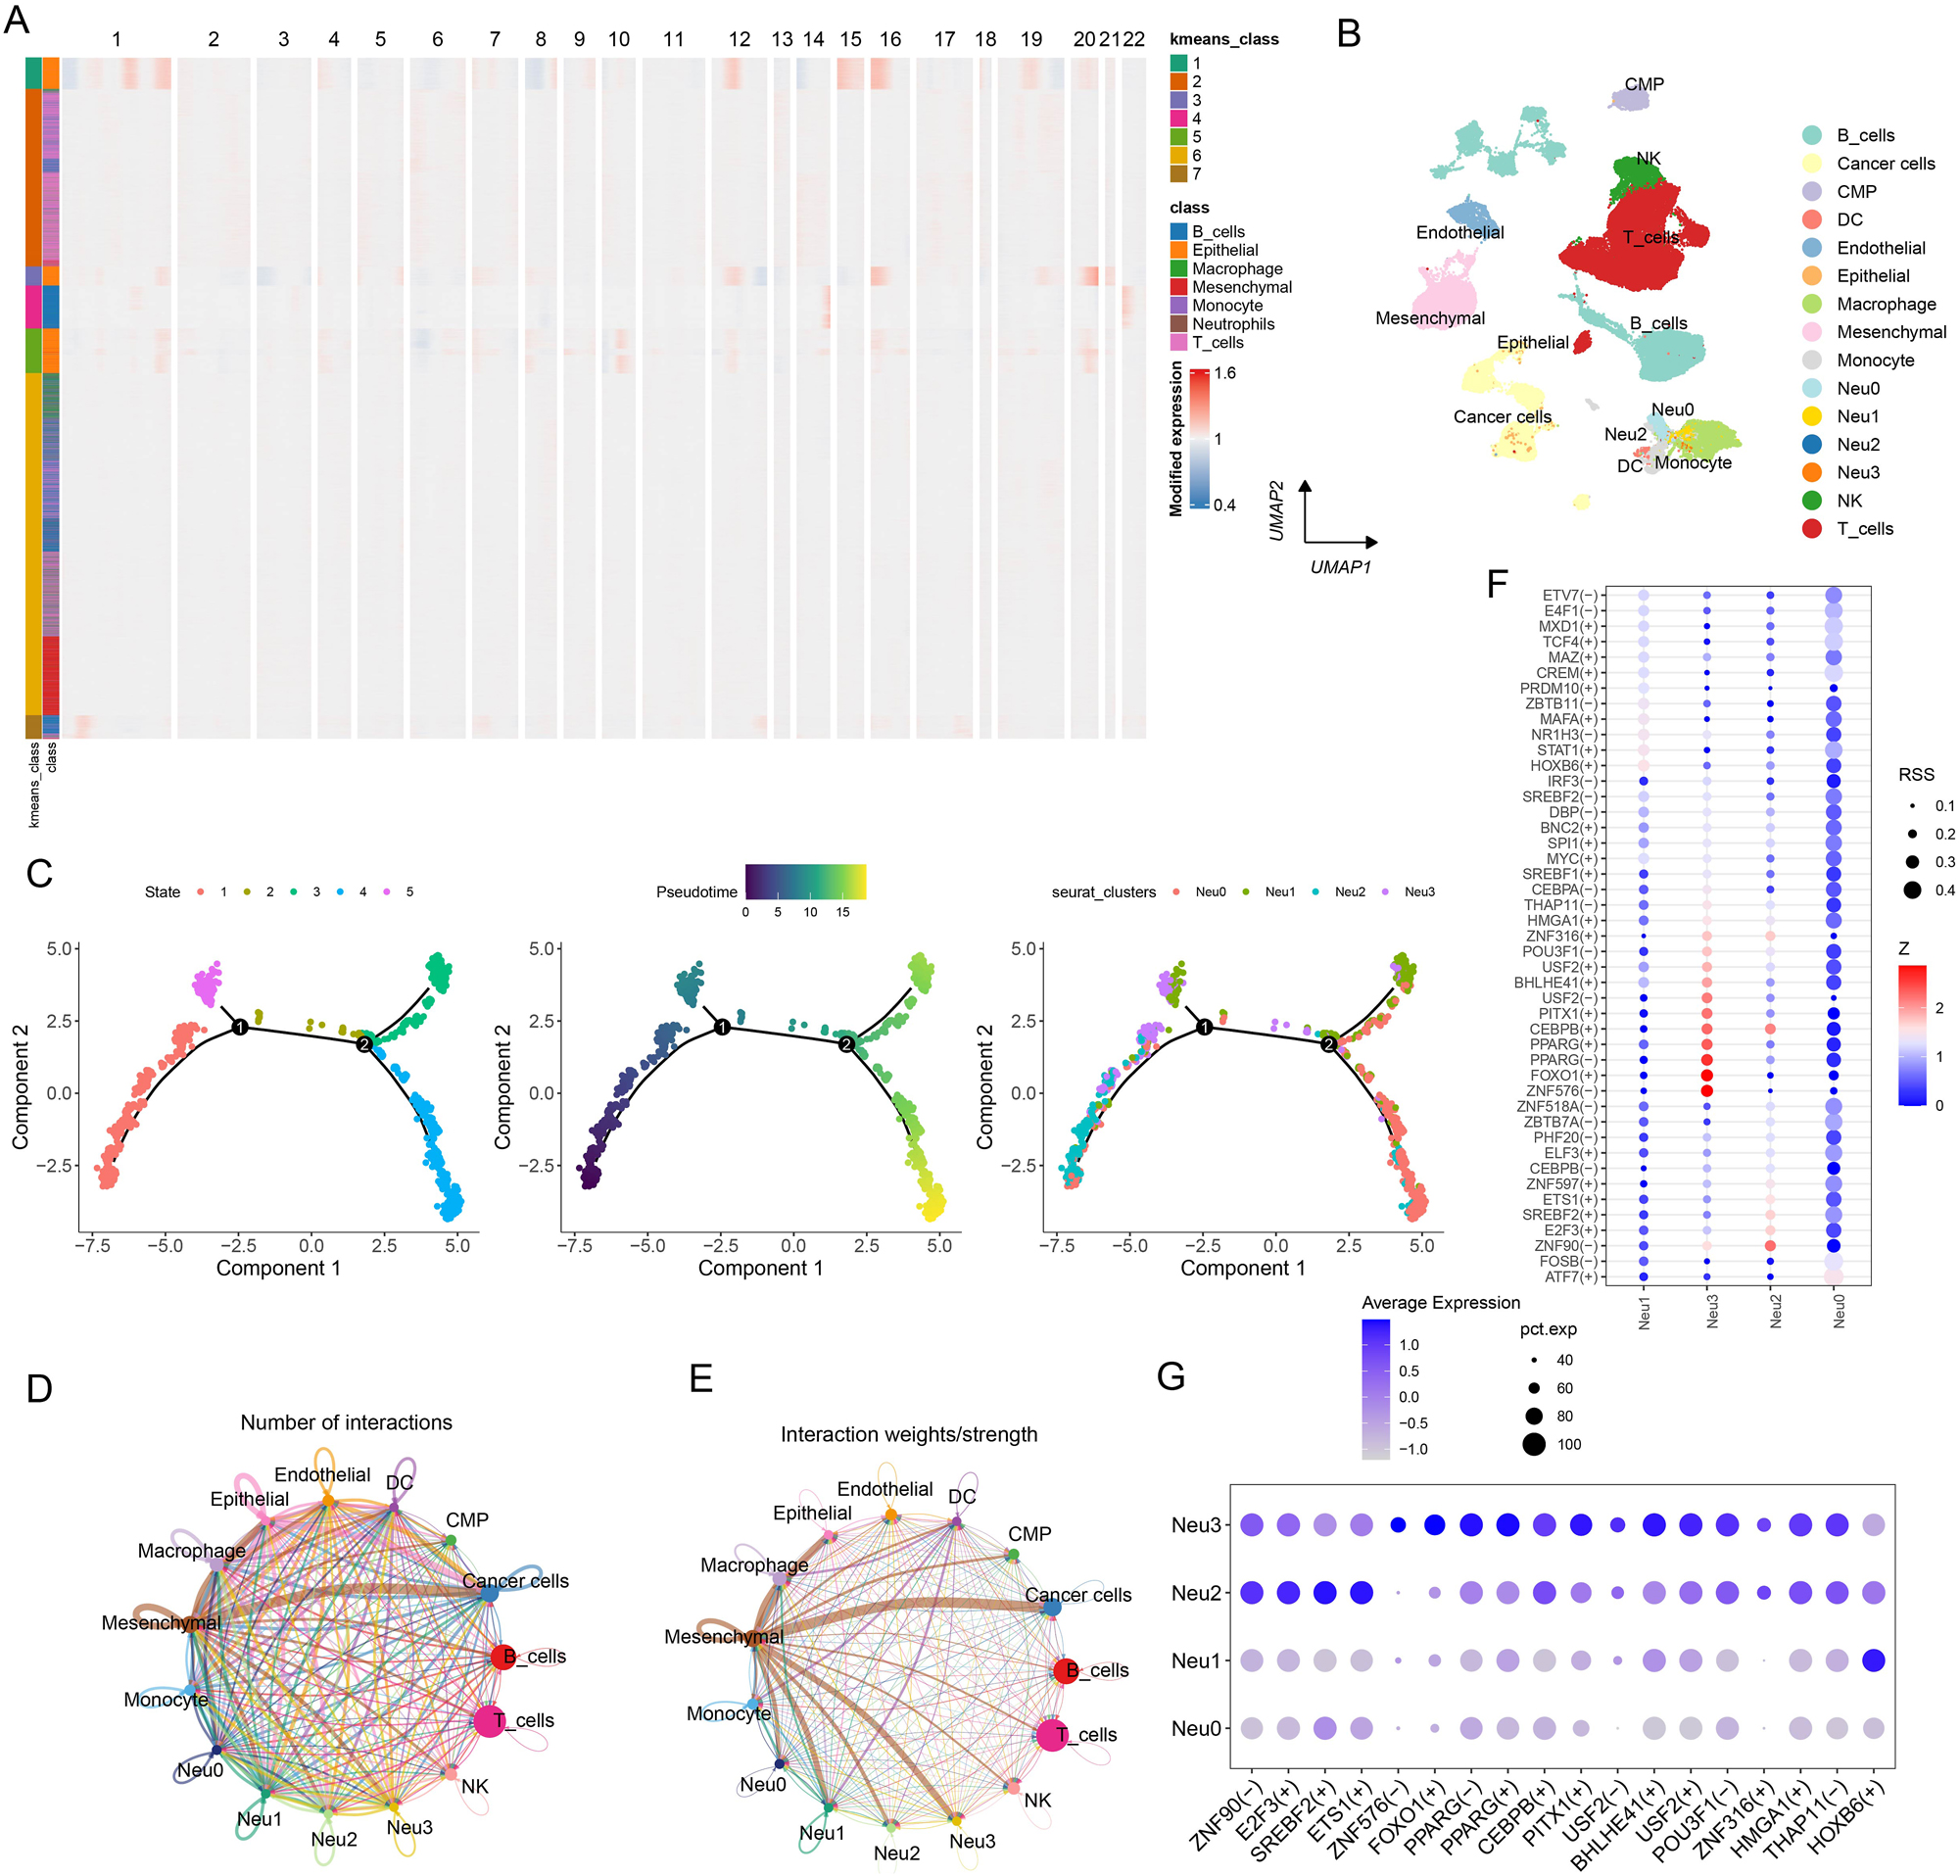
Analysis of neutrophil subpopulations and TFs. (A) CNV clustering heatmap. (B) UMAP dimensionality reduction plot annotated with malignant cells. (C) Pseudotime analysis of neutrophils, which were divided into five distinct states. (D) Chord diagram presenting the number of cell–cell communications. (E) Chord diagram illustrating the intensity of cell–cell communications. (F) Predicted activation and inhibition scores of TFs in the four neutrophil subpopulations. (G) Expression levels of TFs across the four neutrophil subpopulations.
Molecular subtypes and high- and low-risk groups
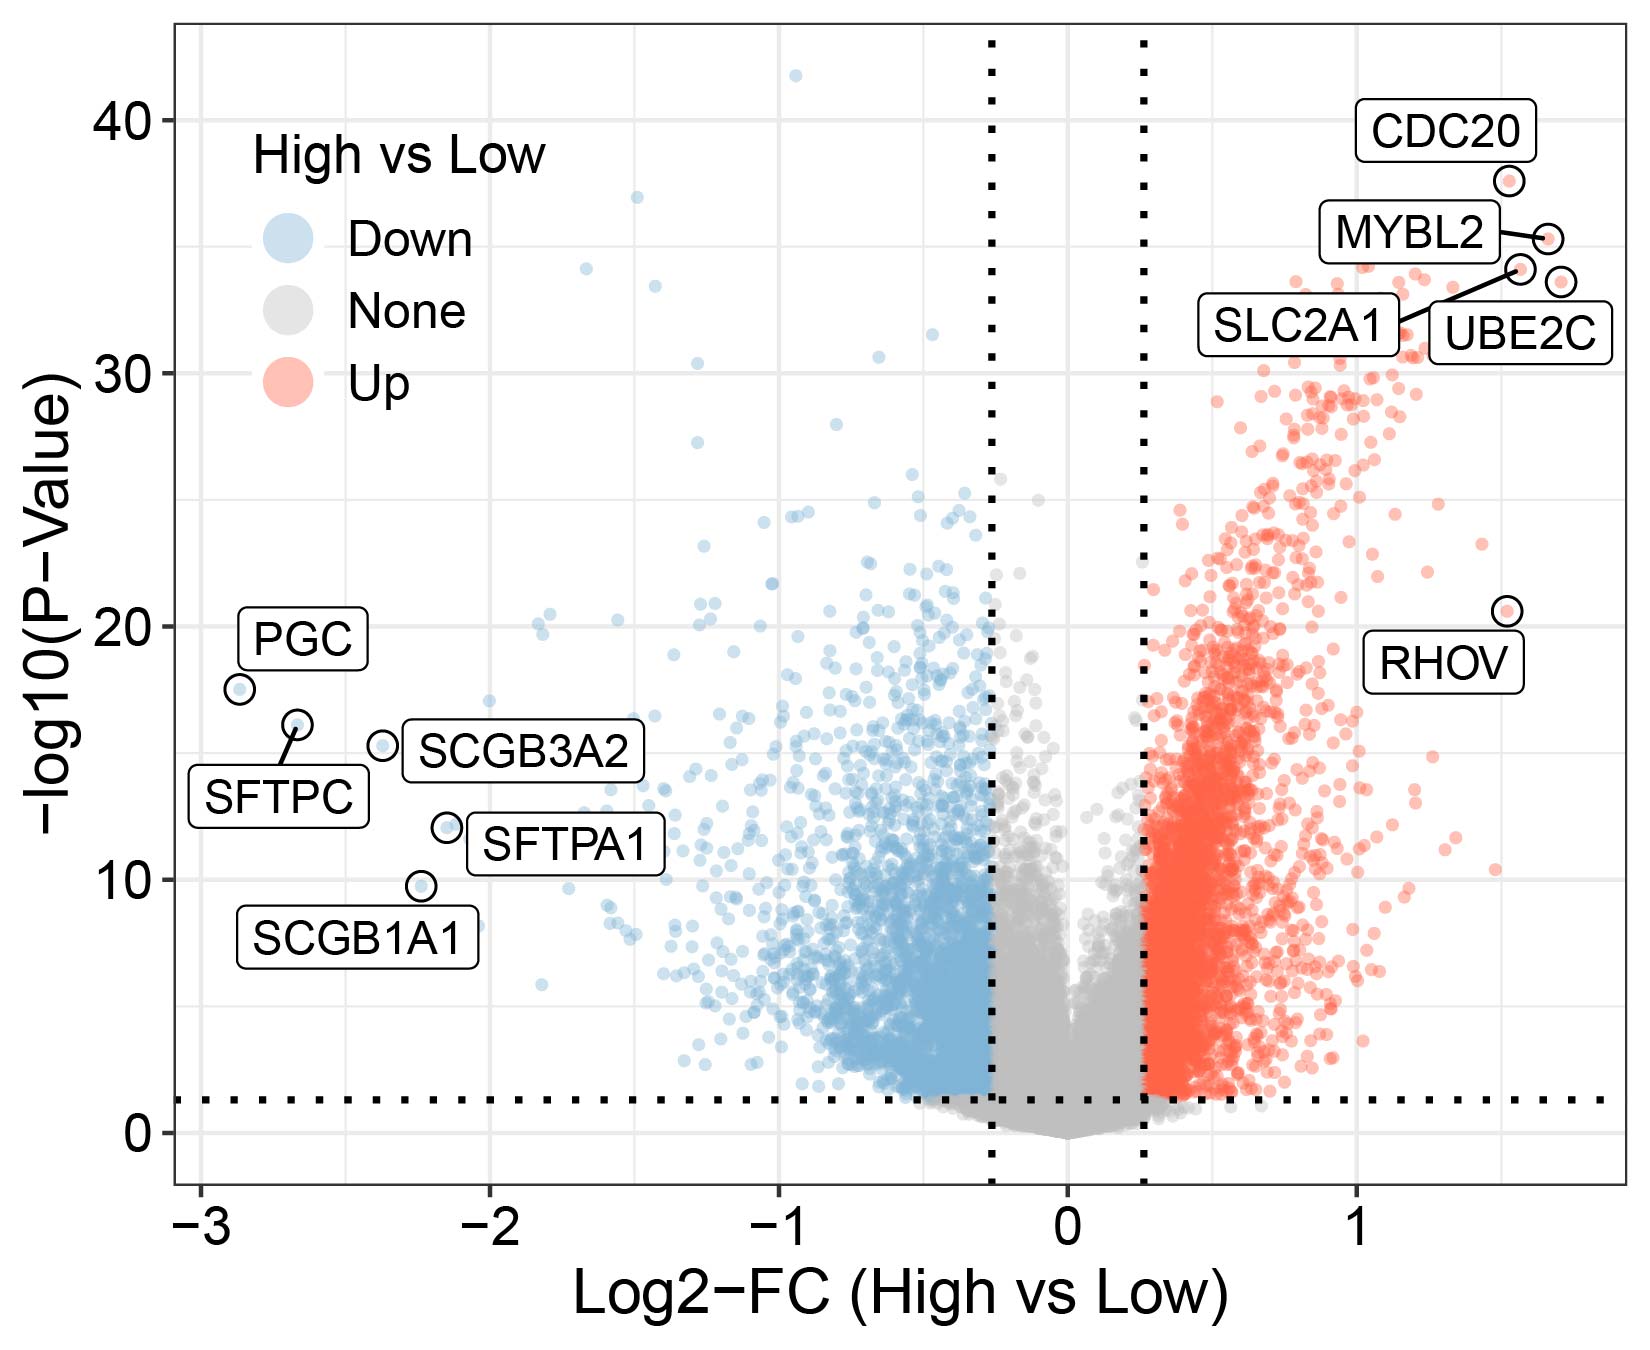
Based on the KM curve analysis, it was observed that the Neu1 and Neu2 subpopulations had a significant impact on the prognosis of LUAD patients in the TCGA dataset (p<0.05, Figure 3A–D), suggesting that these two neutrophil subpopulations played crucial roles in LUAD progression and patient prognosis. Consensus clustering analysis determined the optimal number of clusters to be 2, which was further supported by the CDF Delta area curve. Hence, the patients were divided into two molecular subtypes (LUAD1 and LUAD2) (Figure 3E). Further analysis showed significant prognostic differences between LUAD1 and LUAD2 (p<0.05) (Figure 3F). By scoring KEGG pathways in the two subtypes, we also discovered significant variations in multiple key pathways. Specifically, LUAD1 was primarily enriched in metabolism, cellular processes, and genetic information processing, while LUAD2 was primarily enriched in environmental information processing and organismal systems (Figure 3G). Subsequently, we conducted a differential analysis between patients in the high-risk and low-risk groups (Supplementary Figure S6) and performed KEGG enrichment analysis on the differentially expressed genes (DEGs). The results of KEGG enrichment analysis revealed that metabolism, cellular processes, and genetic information processing were more inhibited in the high-risk group but more activated in the low-risk group. Conversely, pathways associated with environmental information processing were more suppressed in the low-risk group demonstrated but more activated in the high-risk group (Figure 3H).
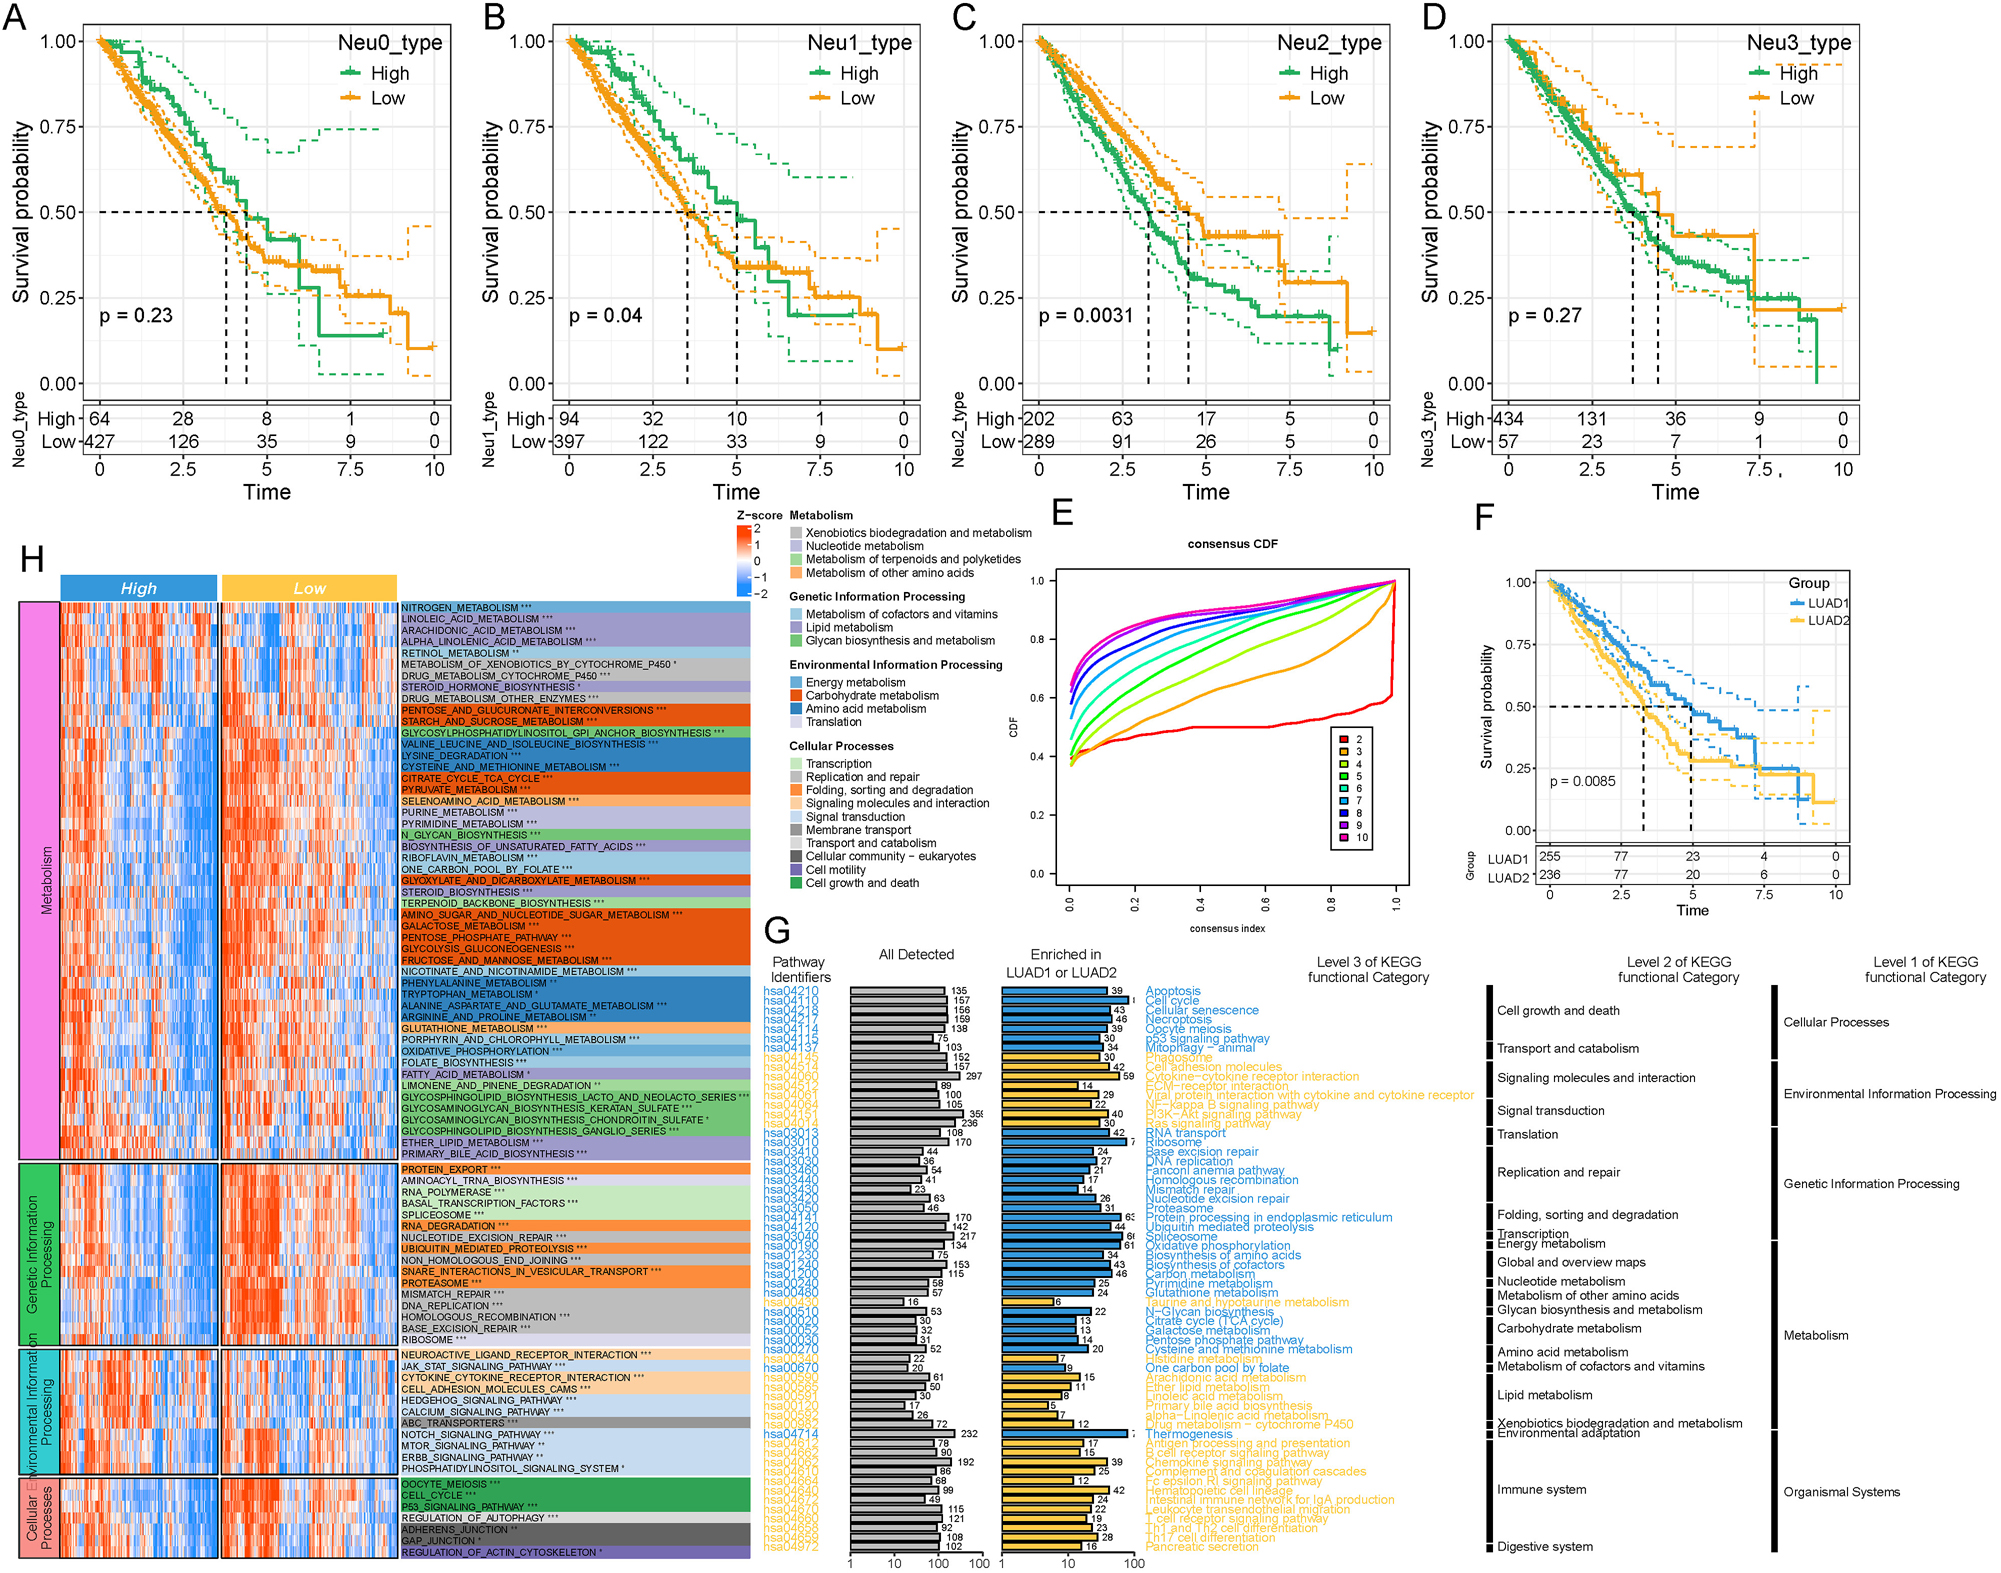
Prognosis and enrichment analysis of the neutrophil subpopulations. (A–D) KM curves depicting patient prognosis in (A) Neu0 neutrophil subset, (B) Neu1 neutrophil subset, (C) Neu2 neutrophil subset, and (D) Neu1 neutrophil subset. (E) CDF delta area indicates relatively stable clustering results when the number of clusters is set to 2. (F) KM curves comparing the two subtypes of LUAD. (G) KEGG enrichment analysis between the two subtypes of LUAD. (H) KEGG enrichment analysis of DEGs between high-risk and low-risk groups in LUAD. *p<0.05, **p<0.01, ***p<0.001.
The results of WGCNA
Consistent clustering patterns across all the samples were confirmed, without significant detectable outliers (Figure 4A). Therefore, all the samples were included in subsequent analyses. By comparing the network topology characteristics under different soft-thresholding powers, the optimal soft-thresholding was determined to be 7 (Figure 4B and C). Next, we developed a gene network and ultimately sectioned 11 network modules, including 10 valid modules and 1 grey module (Figure 4D). Calculation of the correlations between each module and sample phenotypes revealed that the turquoise module had the strongest correlation with LUAD (Figure 4E). Finally, 381 hub genes, which were shown by the red-line box, were selected from the turquoise module under the criteria of gene significance (GS)>0.5 and module membership (MM)>0.5 (Figure 4F).
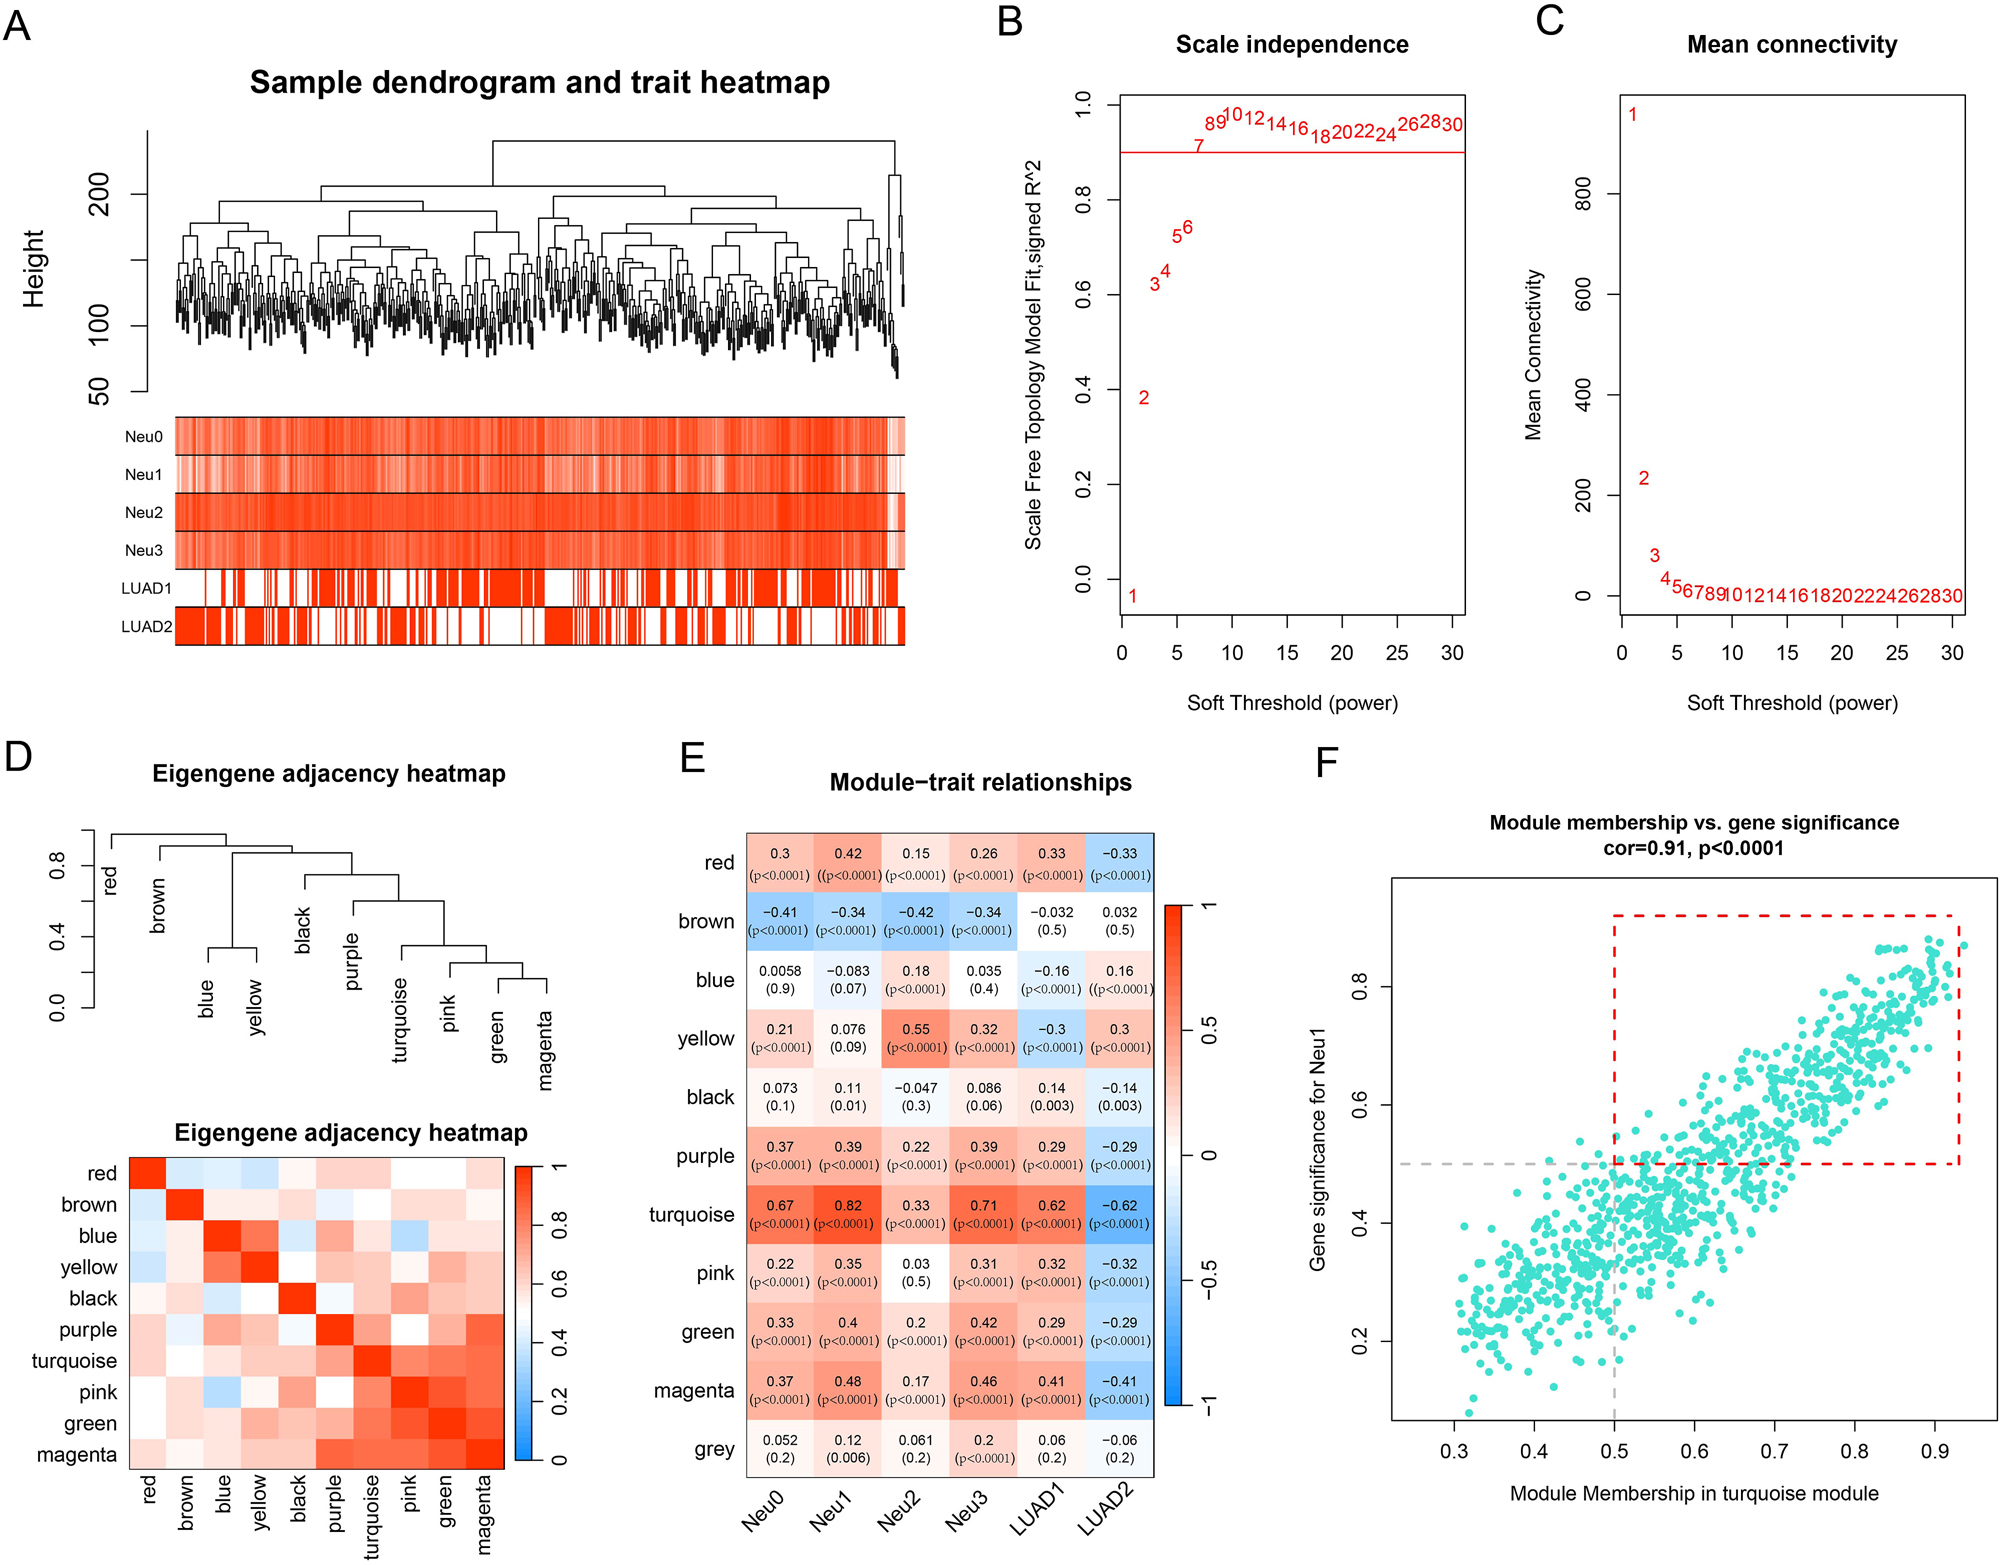
The results of WGCNA. (A) Sample hierarchical clustering plot. (B) The relationship between soft threshold and scale-free topology model fit signed R2. (C) The relationship between soft threshold and mean connectivity. (D) Module clustering plot and heatmap. (E) Heatmap of correlations between modules and traits. Numbers in parentheses represent p-values. (F) Correlation scatter plot between MM and GS. In the red-line box, are 381 hub genes.
Screening results for key genes
Univariate Cox analysis identified 3,487 genes closely related to the prognostic outcomes of LUAD, and 47 key genes were obtained by intersecting the 3,487 genes with the 381 hub genes screened by WGCNA analysis (Figure 5A). These 47 key genes were then subjected to a LOOCV framework to fit 101 predictive models. The optimal model was established by calculating the c-index for each model on the validation dataset. Ultimately, the Lasso+plsRcox model was determined as the optimal model as it showed the highest average c-index (0.668) in the test set (Figure 5B). Based on the Lasso+plsRcox model, we further refined the gene list to 15 key genes (CD40LG, CLEC10A, CPA3, CXorf21, CYTIP, DPEP2, FGD3, GBP1, GPR65, HMOX1, KLRB1, P2RY13, PPM1M, TM6SF1, and ZYX). The results of the univariate Cox regression analysis of these 15 genes are shown in a forest plot (Figure 5C). All 15 genes significantly influenced the prognosis of LUAD (p<0.05), with ZYX, HMOX1, and GBP1 having negative effects on the prognosis of LUAD with a Hazard Ratios (HR)>1, while the remaining 12 genes exhibited positive effects (HR<1). Using these 15 key genes, we calculated the prognostic RiskScores for each sample in the training and validation sets. Consistently, the results demonstrated that in the four cohorts of TCGA, GSE37745, GSE50081, and GSE31210, the high-risk group had noticeably poorer prognoses, while the low-risk group had relatively better prognoses (p<0.01) (Figure 5D–G).
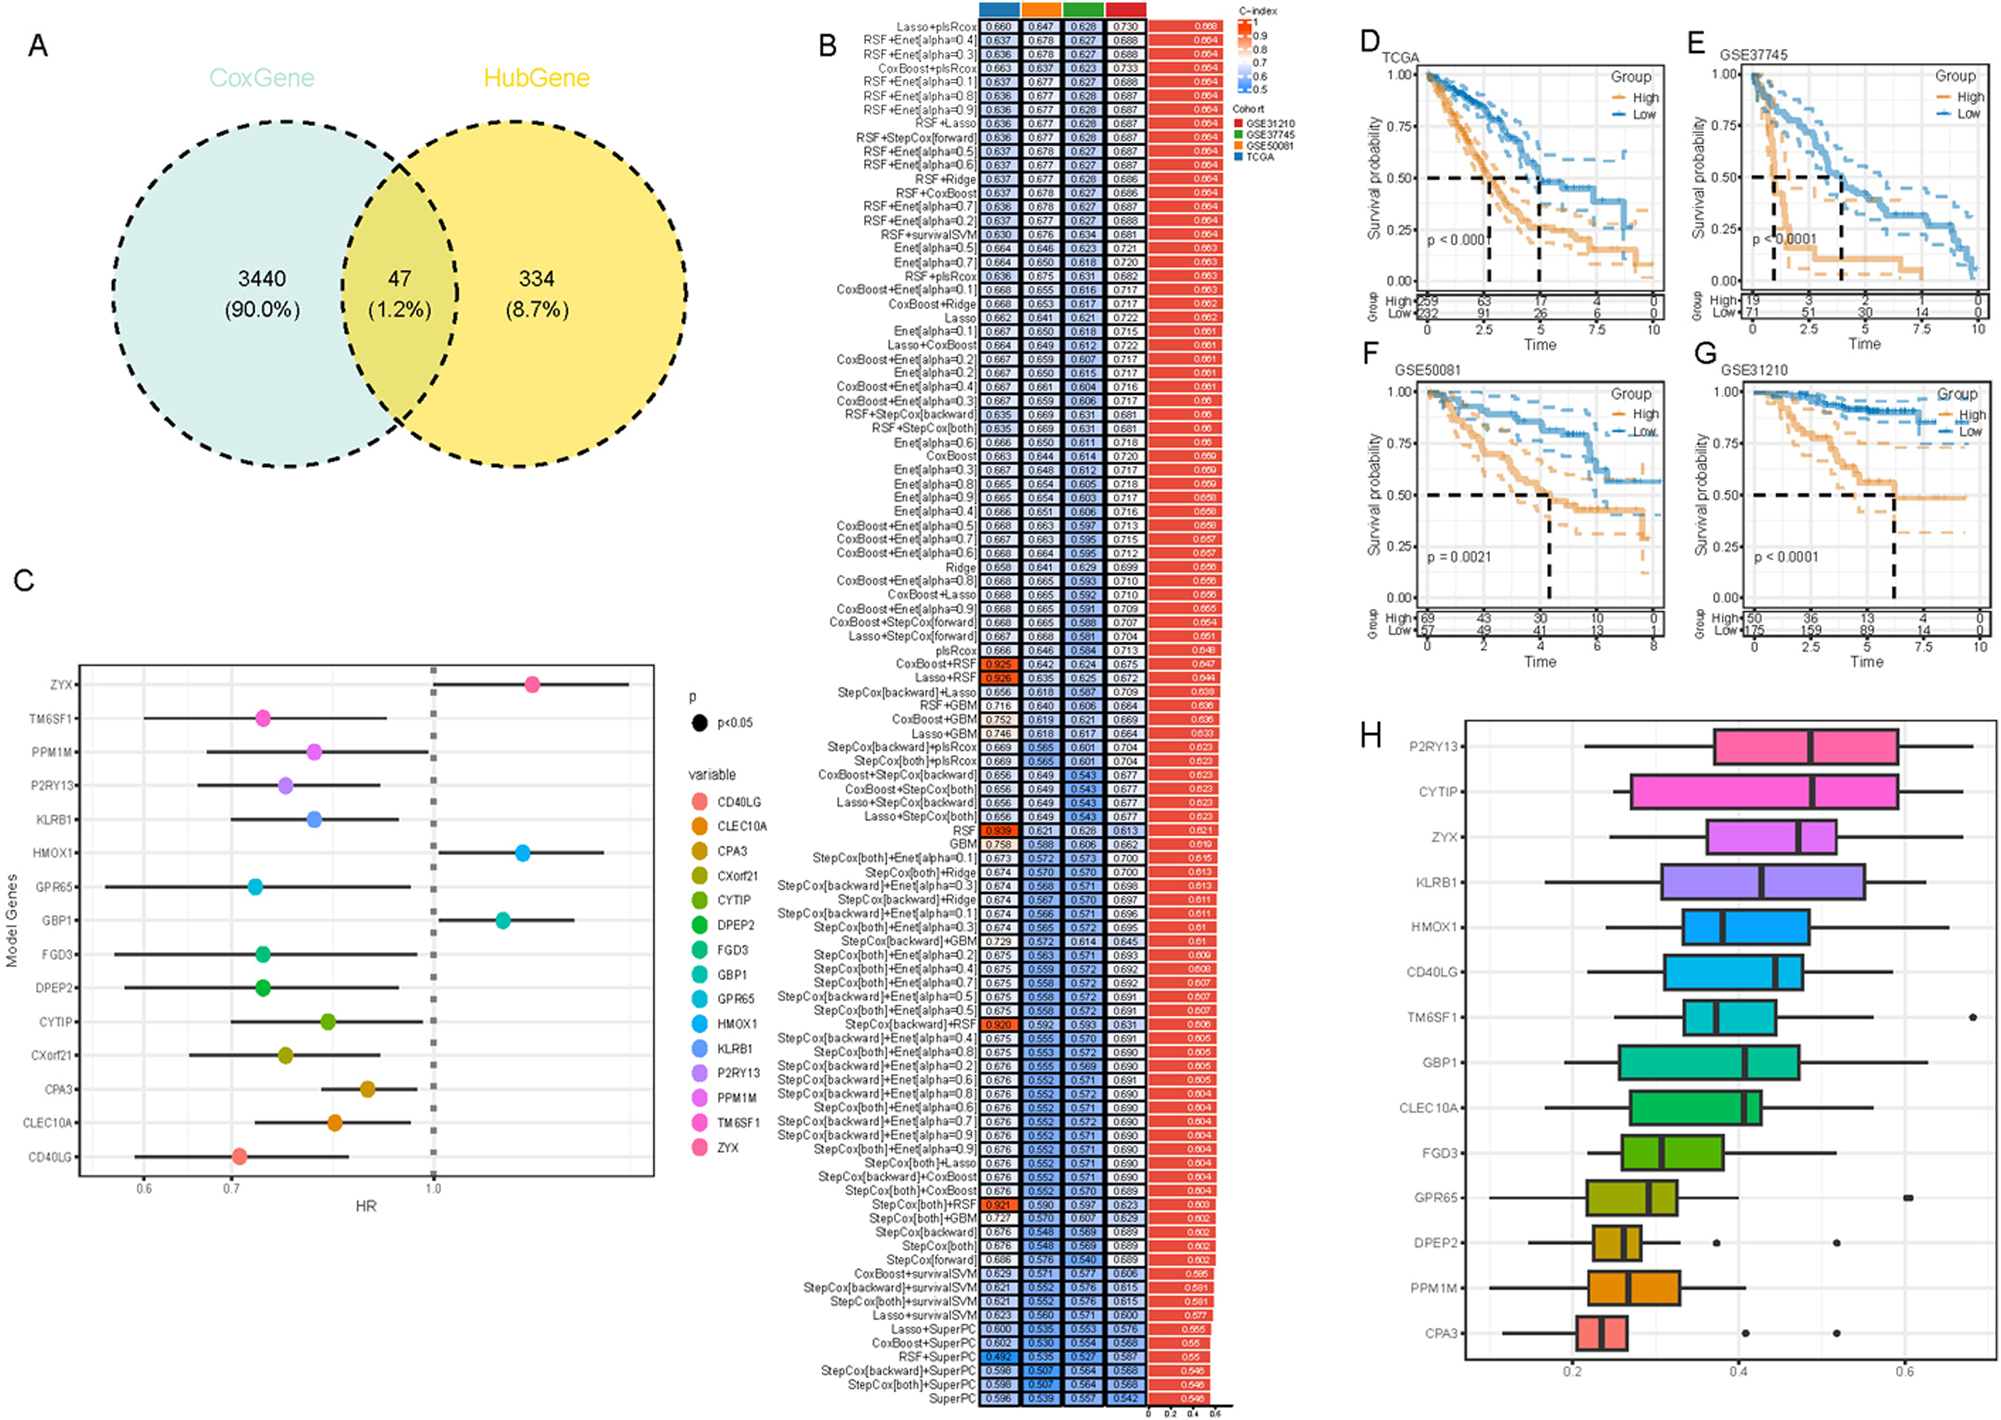
Identification and validation of key genes and biomarkers in LUAD. (A) Venn diagram intersection of Cox genes and hub genes. (B) Performance evaluation of 101 combined machine learning models on training and testing sets. (C) Forest plot of univariate Cox analysis for the 15 selected genes. (D–G) KM curve analysis comparing high- and low-risk groups across cohorts in (D) TCGA Cohort, (E) GSE37745 Cohort, (F) GSE50081 Cohort, (G) GSE31210 Cohort. (H) A bar chart displaying the percentage of functional representation for the 15 key genes across BP, CC, and MF terms in GO analysis.
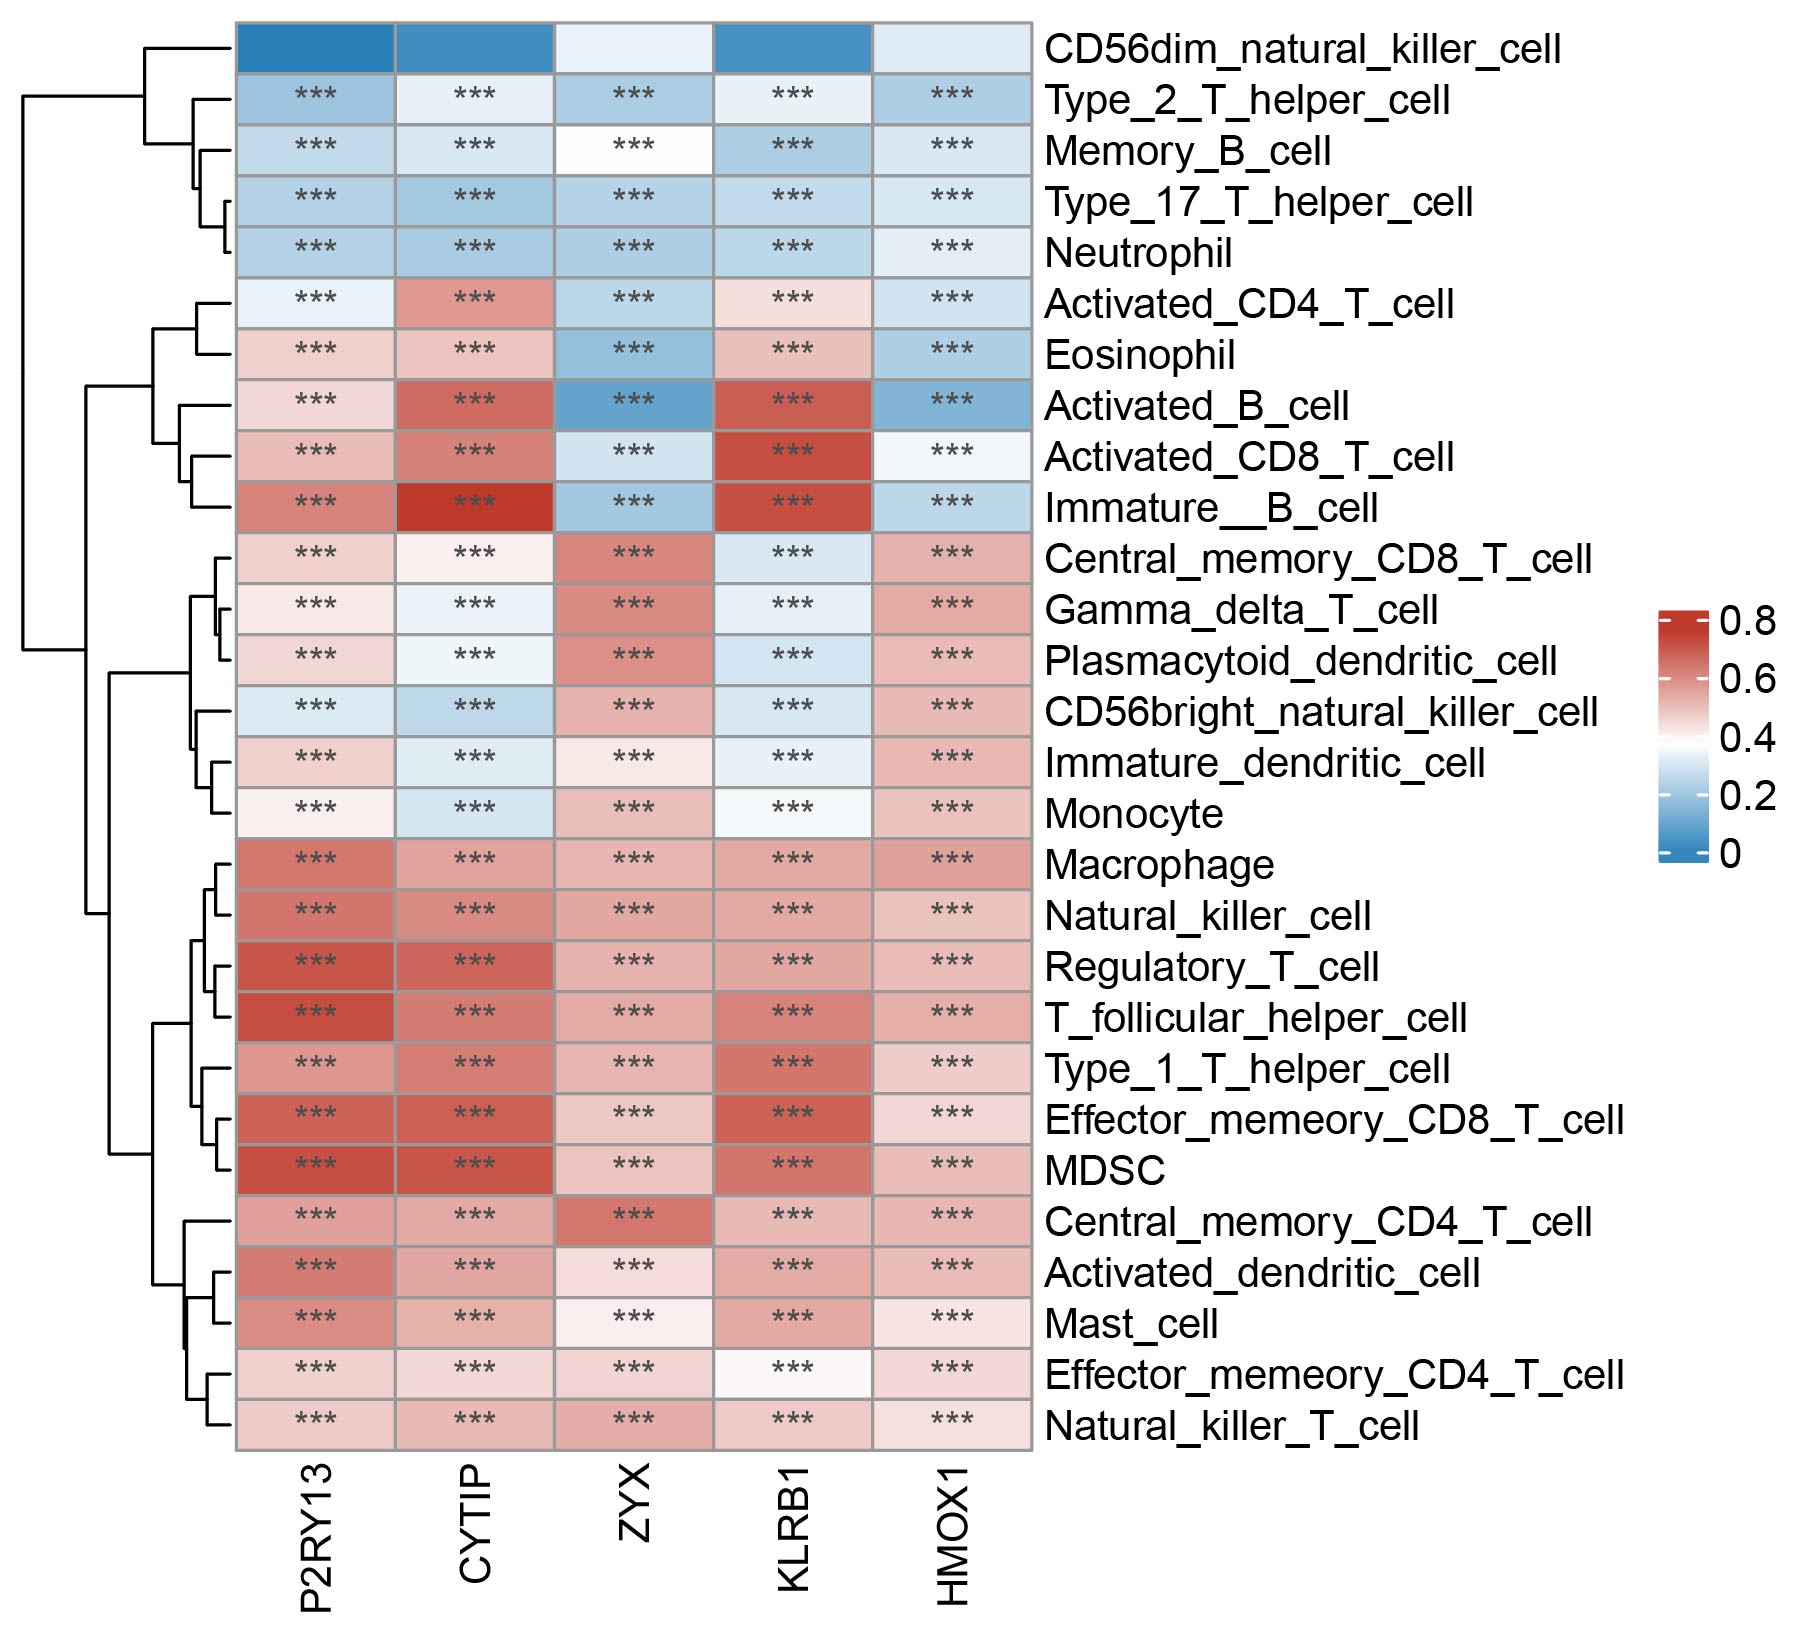
To further optimize the selection of key genes, we analyzed the proportion of these 15 genes in the three GO terms and the top 5 genes (P2RY13, CYTIP, ZYX, KLRB1, and HMOX1) with the most significant functions were considered as potential biomarkers for LUAD (Figure 5H). Additionally, we examined the association between the five key neutrophil-related genes and immune cells in the TME of LUAD by applying the ssGSEA algorithm. As shown in Supplementary Figure S7, significant associations were observed between all 5 genes and most immune cells (e.g., mast cells, regulatory T cells, macrophages, etc.).
Validation of the potential biomarkers by in vitro experiments
To verify the expression profiles of P2RY13, CYTIP, ZYX, KLRB1, and HMOX1 across different cell types, we first performed quantitative experiments in BEAS-2B cells (a control cell line), A549 and H2228 cells (two lung cancer cells). It was found that the relative mRNA expression levels of P2RY13, ZYX, and KLRB1 were significantly higher in BEAS-2B cells compared to A549 and H2228 cells (Figure 6A, p<0.01). In contrast, the expressions of CYTIP and HMOX1 were markedly upregulated in A549 and H2228 cancer cells (Figure 6A, p<0.01), with HMOX1 showing a particularly high expression in A549 and H2228 cells. Hence, HMOX1 was further analyzed in subsequent experiments. We obtained immunohistochemical staining results of HMOX1 based on HPA (Supplementary Figure S8). Wound healing assay and transwell assay were conducted to investigate the role of HMOX1 in cancer cell behaviors. The results demonstrated that silencing HMOX1 in A549 and H2228 cells significantly impaired the wound healing capacity (Figure 6B, p<0.01), which was accompanied by a notable decrease in the number of migrating and invading cells (Figure 6C, p<0.01). The finding suggested that HMOX1 promoted the migration and invasion of LUAD cells.
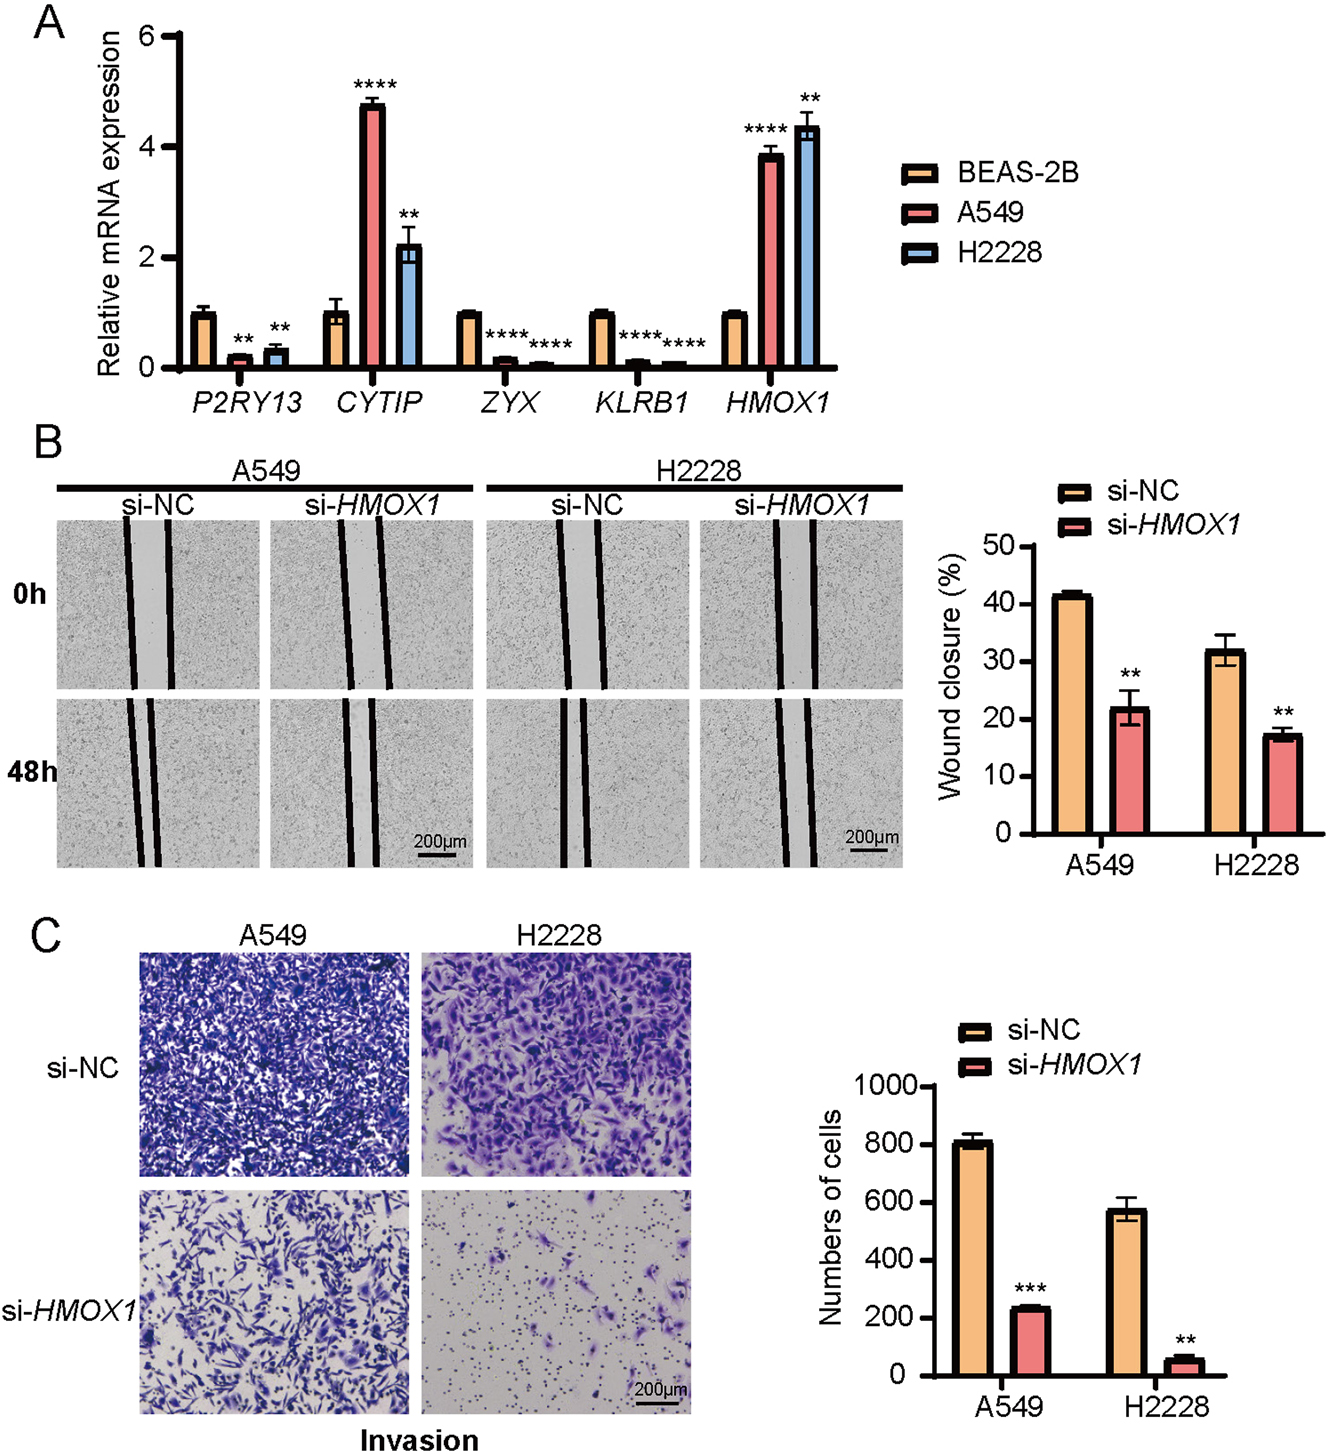
The results of in vitro validation experiments for the five key genes. (A) Relative mRNA expressions of P2RY13, CYTIP, ZYX, KLRB1, and HMOX1 in BEAS-2B, A549, and H2228 cells. (B) The impact of HMOX1 silencing on wound healing of A549 and H2228 cells. (C) Effects of HMOX1 silencing on the invasion of A549 and H2228 cells tested via transwell assay. All the experimental data of independent triplicates were expressed as mean±standard deviation. **p<0.01, ***p<0.001, ****p<0.0001.
Further improvement of the prognostic models and survival prediction by combining RiskScore with clinicopathological features
As shown by the results of univariate and multivariate Cox regression analyses, the RiskScore (HR=2.718 (95 % CI: 2.042, 3.619)) was an independent prognostic factor that was significantly more effective than other clinical features (HR=2.245 (95 % CI: 1.581, 3.187)) (Figure 7A and B). This indicated that the RiskScore had a significant influence on predicting the prognosis for LUAD patients. Further development of a nomogram also confirmed the influence of the RiskScore on the survival prediction in LUAD (Figure 7C). The calibration curve analysis showed that the predictive calibration curves of the model were close to the standard ones at the 1-, 3-, and 5-year calibration points, validating a strong predictive performance of the nomogram (Figure 7D). Furthermore, according to the DCA, both the RiskScore and the nomogram manifested significantly greater benefits than the extreme curves (Figure 7E). The analysis of the area under the curve (AUC) values also showed that both the nomogram and the RiskScore exhibited the strongest survival prediction capabilities than other clinicopathological features (Figure 7F).
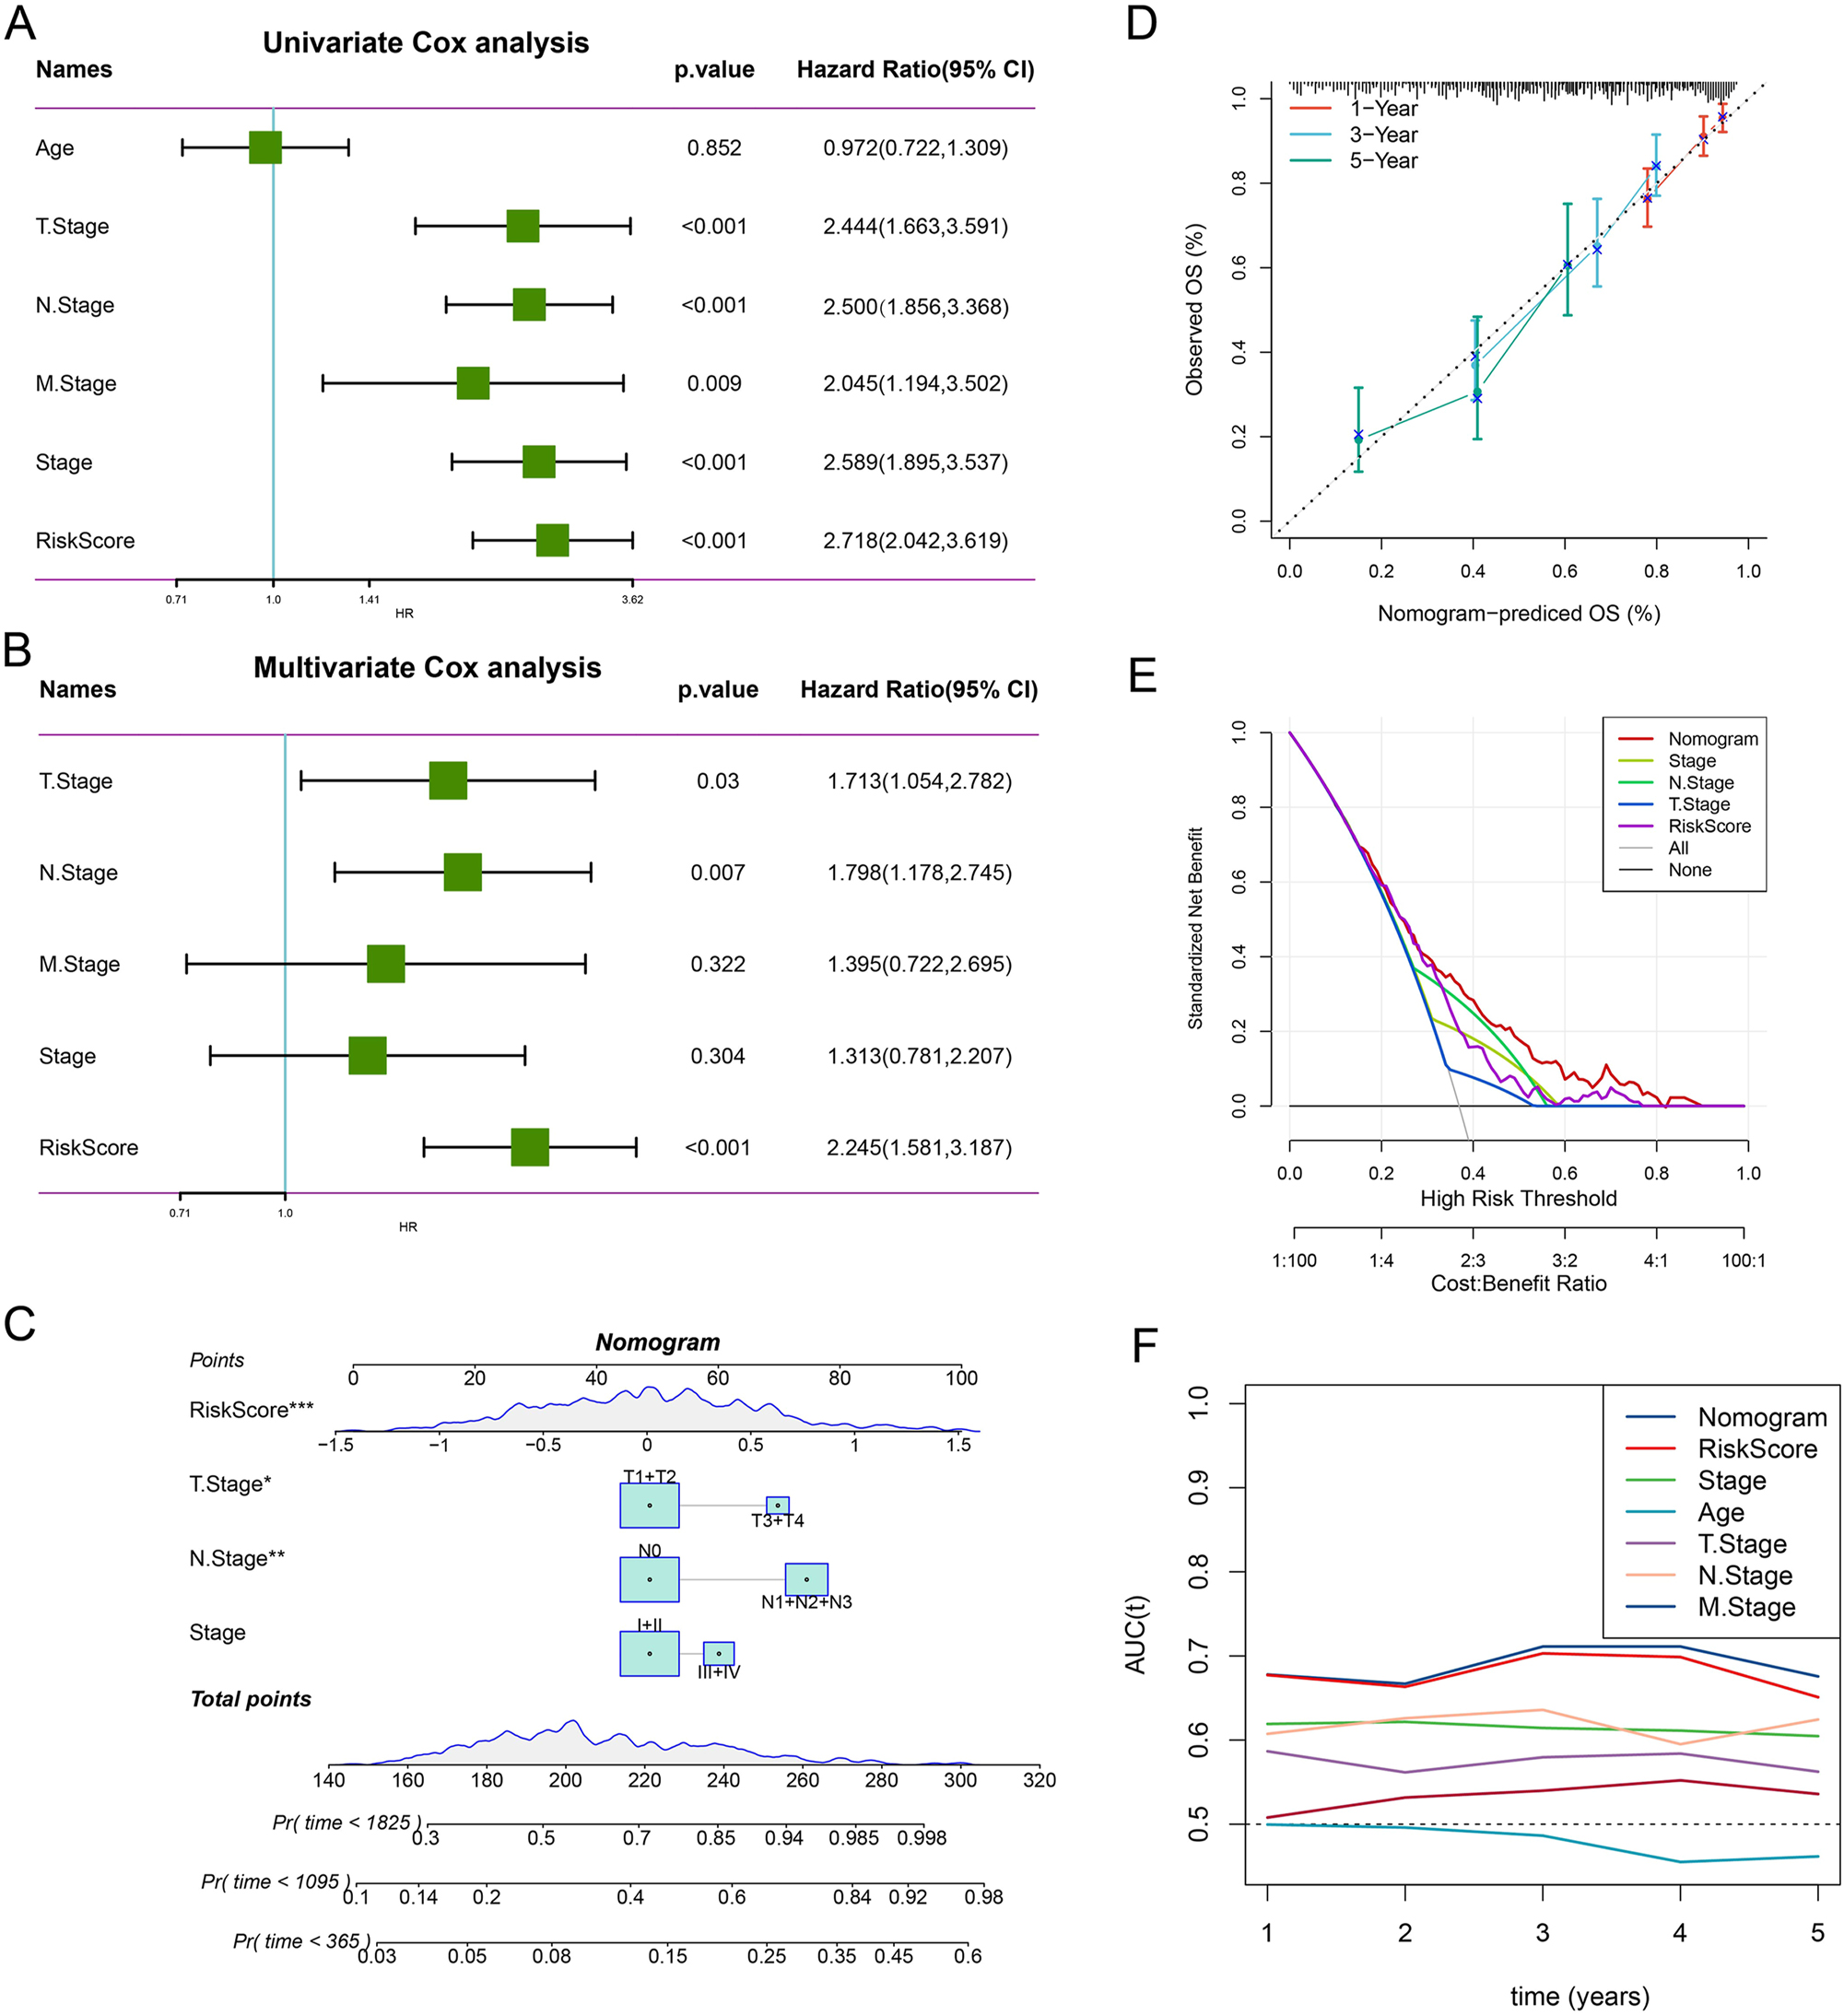
RiskScore and nomogram validation. (A) Univariate Cox analysis of RiskScore and clinical features. (B) Multivariate Cox analysis of RiskScore and clinical features. (C) Construction of the nomogram. (D) Calibration curves for 1-, 3-, and 5-year survival. (E) DCA of the nomogram. (F) The AUC predicted that the nomogram exhibited the most powerful capacity for survival prediction in comparison to other clinicopathological features. *p<0.05, **p<0.01, ***p<0.001.
Genetic mutation and genomic variation analysis on high- and low-risk groups
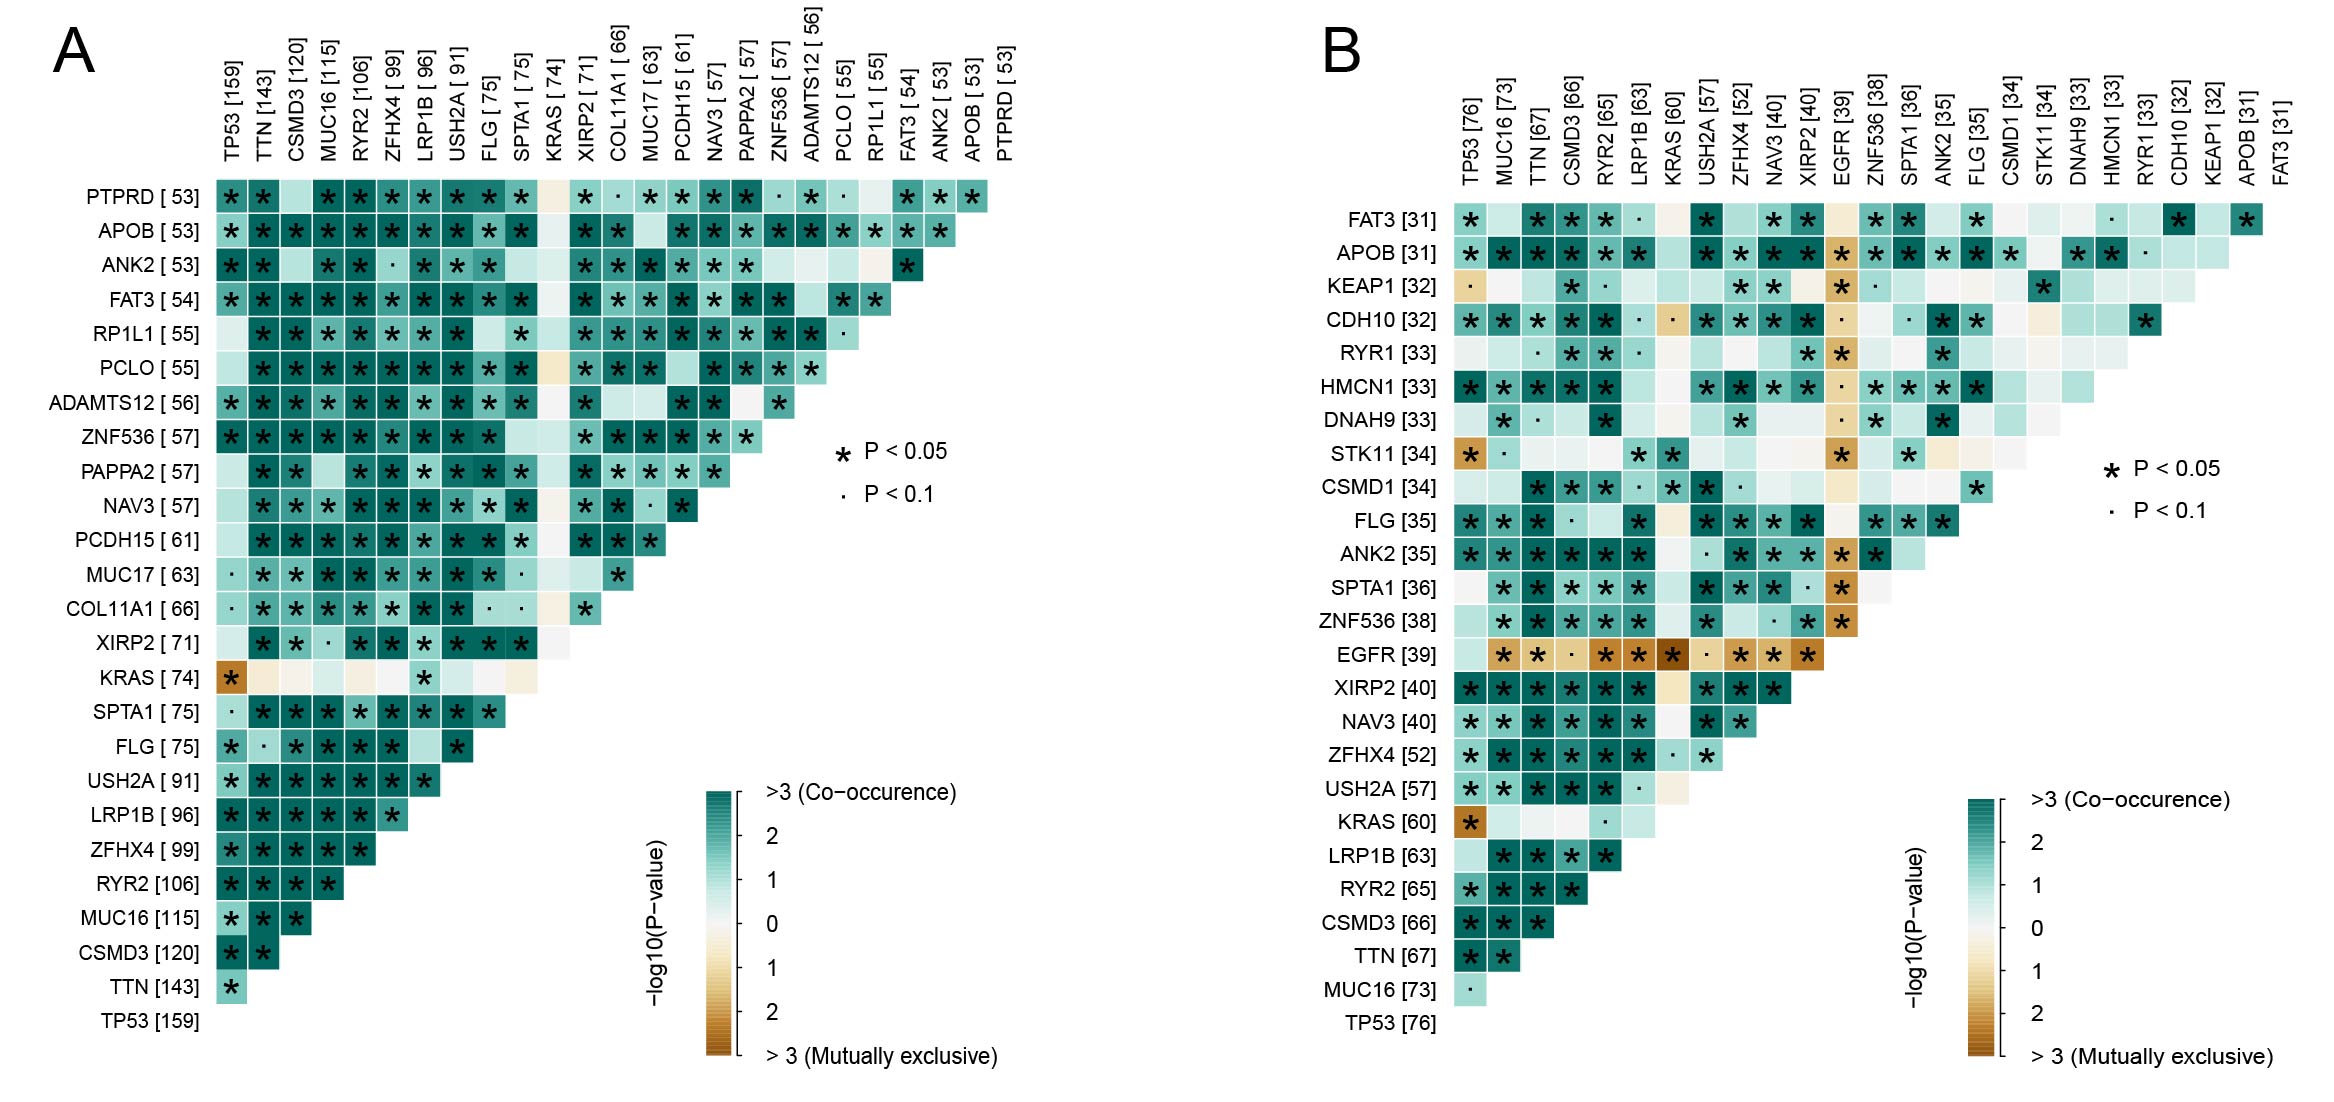
A comparison of the distribution of the top 20 frequently mutated genes in the two risk groups (Figure 8A and B) showed that TTN and TP53 were the most frequently mutated in the high-risk group, while TTN was also the most frequently mutated in the low-risk group, followed by MUC16 and RYR2. We observed that multiple gene pairs had significant mutation co-occurrence (e.g., TTN) in the high-risk group, whereas the mutations of some genes were exclusive (e.g., EGFR) in the low-risk group (Supplementary Figure S9). As for the genomic characteristics between the two risk groups, it was found that the high-risk group had significantly higher levels of HRD, number of segments, TMB, and fraction altered than the low-risk group (Figure 8C–F). These differences suggested a greater genetic instability of the tumors in the high-risk, which also explained worse treatment response and prognosis in the group. Further analysis of the CNV dataset revealed that the 15 genes in the risk model exhibited either deletions or amplifications in the samples (Figure 8G), implying that CNVs played an important role in the initiation, progression, and prognosis of LUAD by influencing gene expressions and functions.
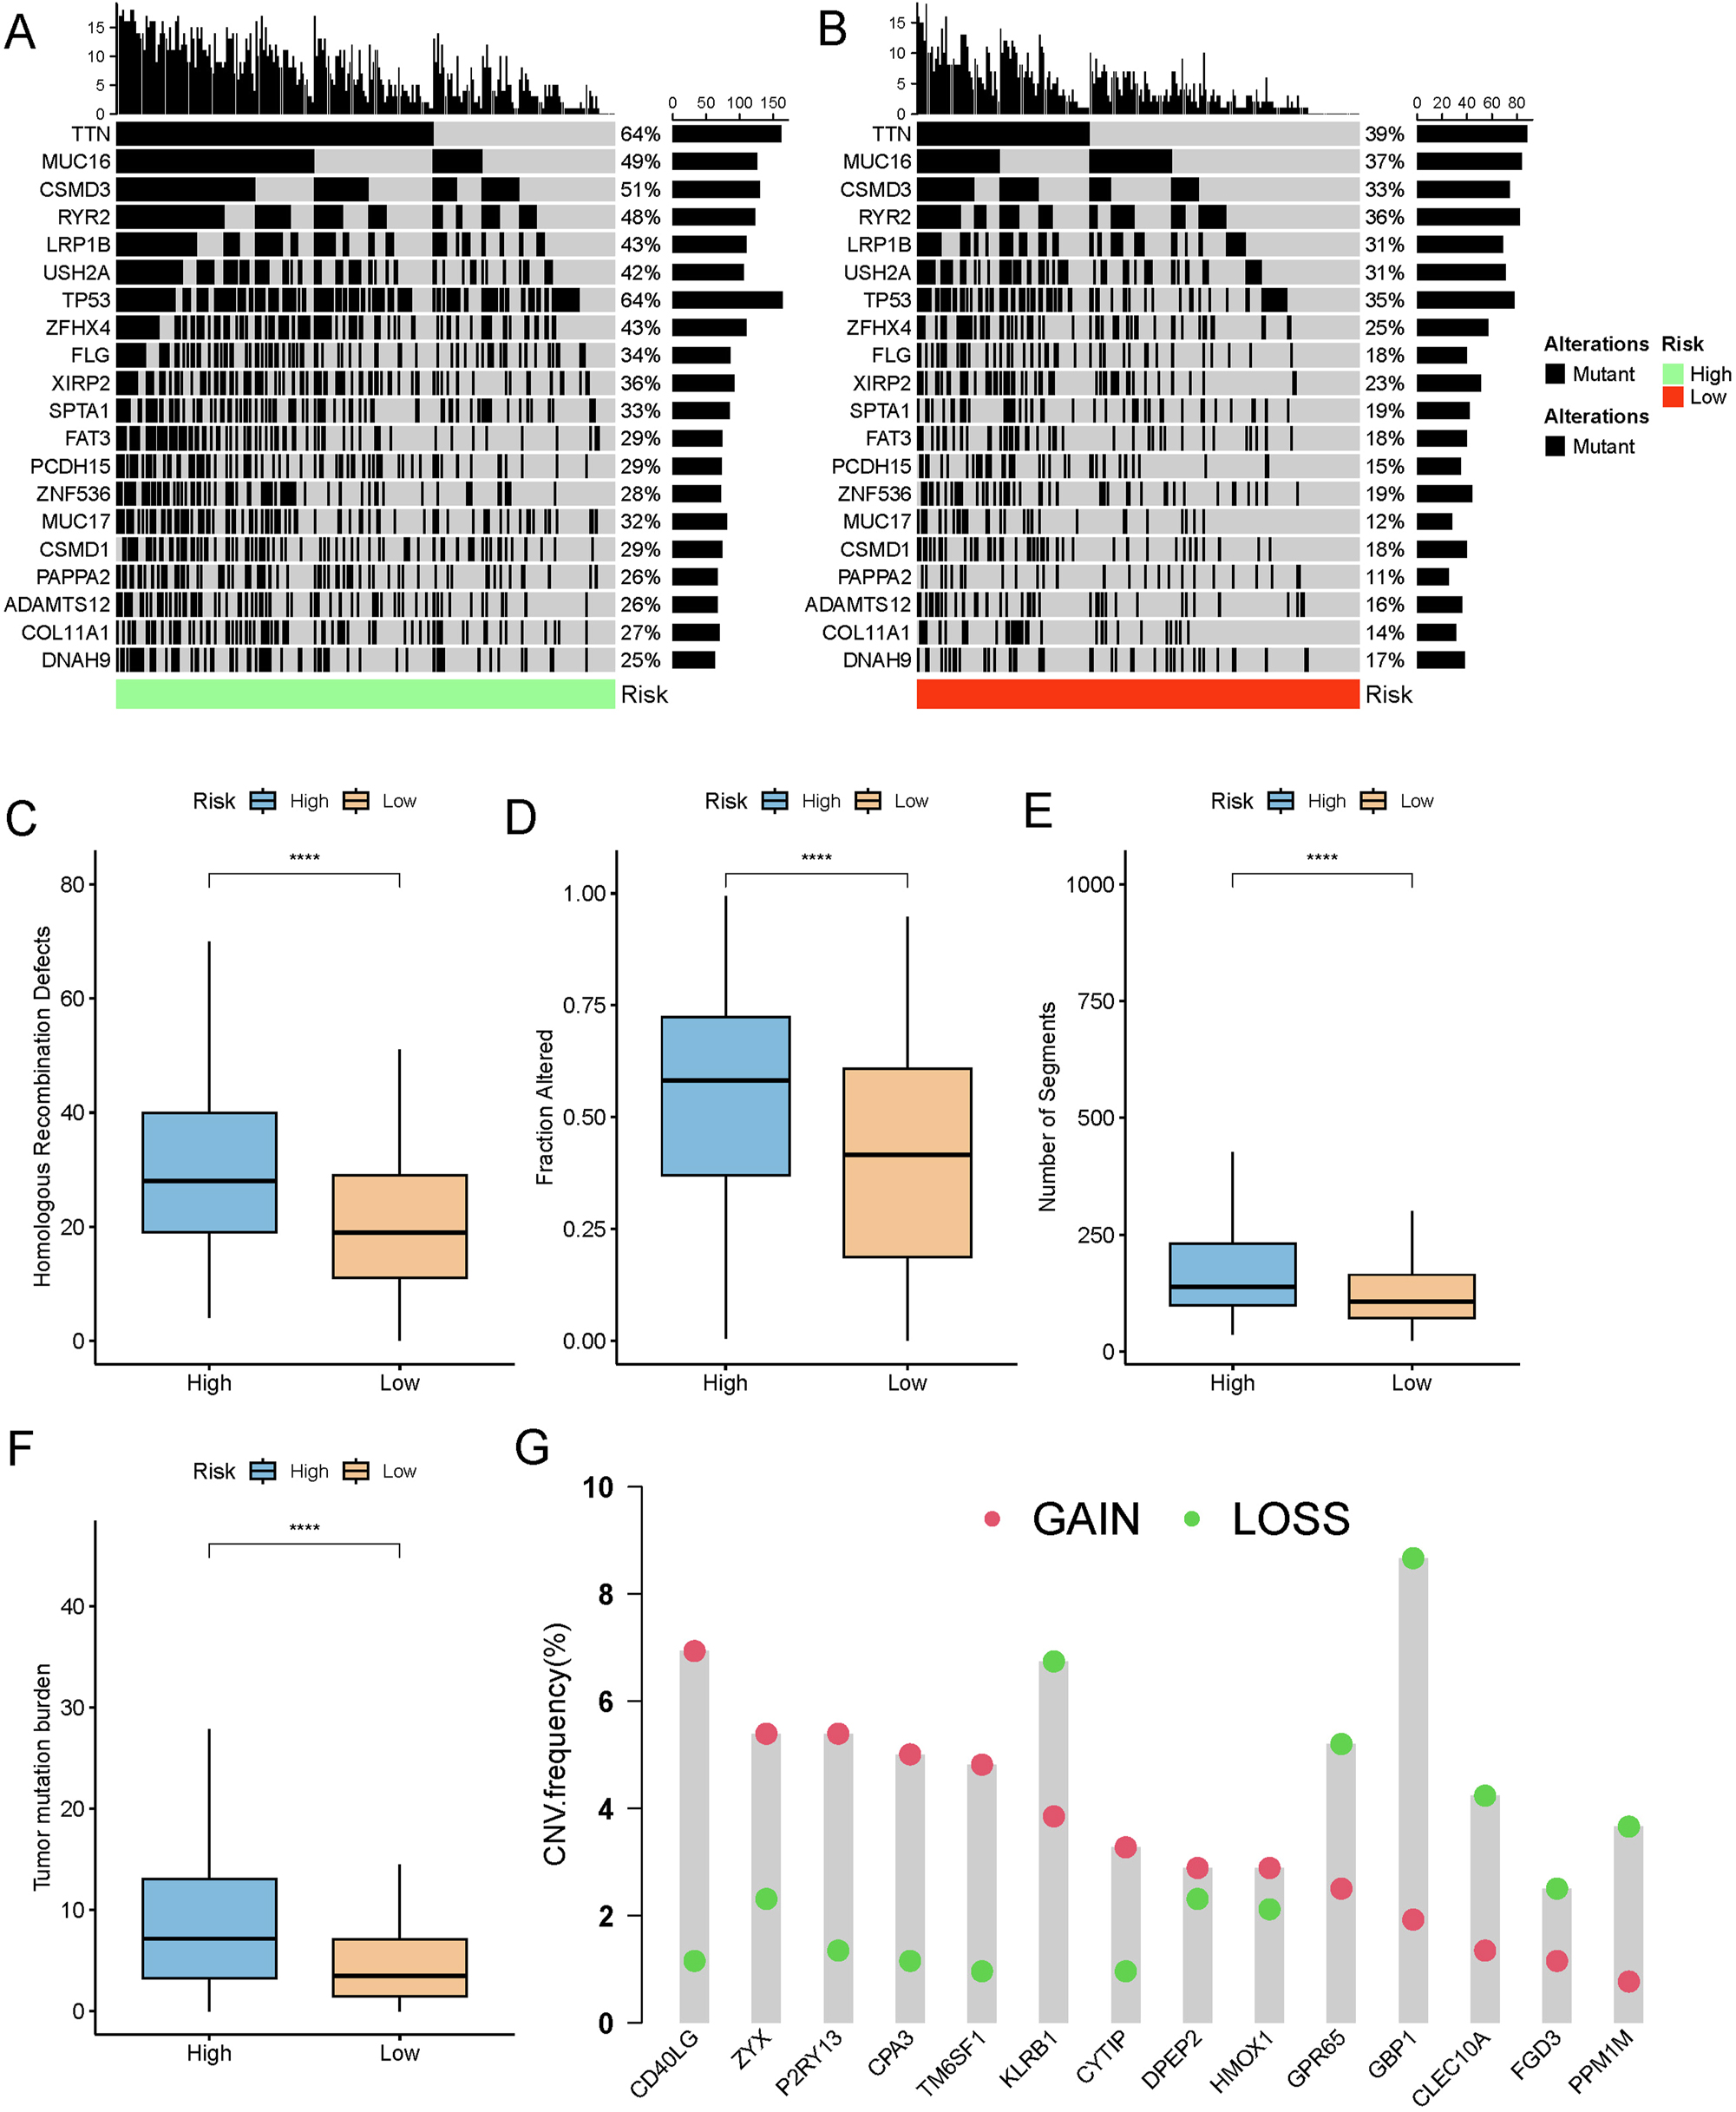
Mutation profiles and genomic characteristics in high- and low-risk groups. (A, B) Waterfall plots presenting the top 20 mutated genes in (A) high-risk and (B) low-risk groups. (C–F) Comparison of differences in (C) HRD score, (D) fraction altered, (E) number of segments, and (F) TMB between high- and low-risk groups in the TCGA cohort. (G) Distribution of patient proportions with CNV mutations in module genes within the TCGA dataset. ****p<0.0001.
Prediction of potential therapeutic targets and drug sensitivity analysis
The CTRP and PRISM methods were employed for drug sensitivity analysis of the TCGA dataset. The CTRP method identified SB-743921, paclitaxel, BI-2536, vincristine, and GSK461364 as potential therapeutic drugs for the treatment of lung cancer (Figure 9A). Meanwhile, the PRISM method discovered cabazitaxel, epothilone-b, vincristine, litronesib, rubitecan, and volasertib as the six potential drugs (Figure 9B). Vincristine emerged as a common potential drug predicted by both methods. Further analysis with the CTRP method on the differences in drug sensitivity between the two risk groups revealed that ML006 exhibited stronger therapeutic effects on the low-risk group, while the high-risk group was more sensitive to ML162 (Figure 9C). In contrast, using the PRISM method, it was found that mepivacaine had stronger therapeutic effects on the low-risk group, while XL888, 8-bromo-cGMP, and prednisolone-acetate showed more potent effects on the high-risk group (Figure 9D).
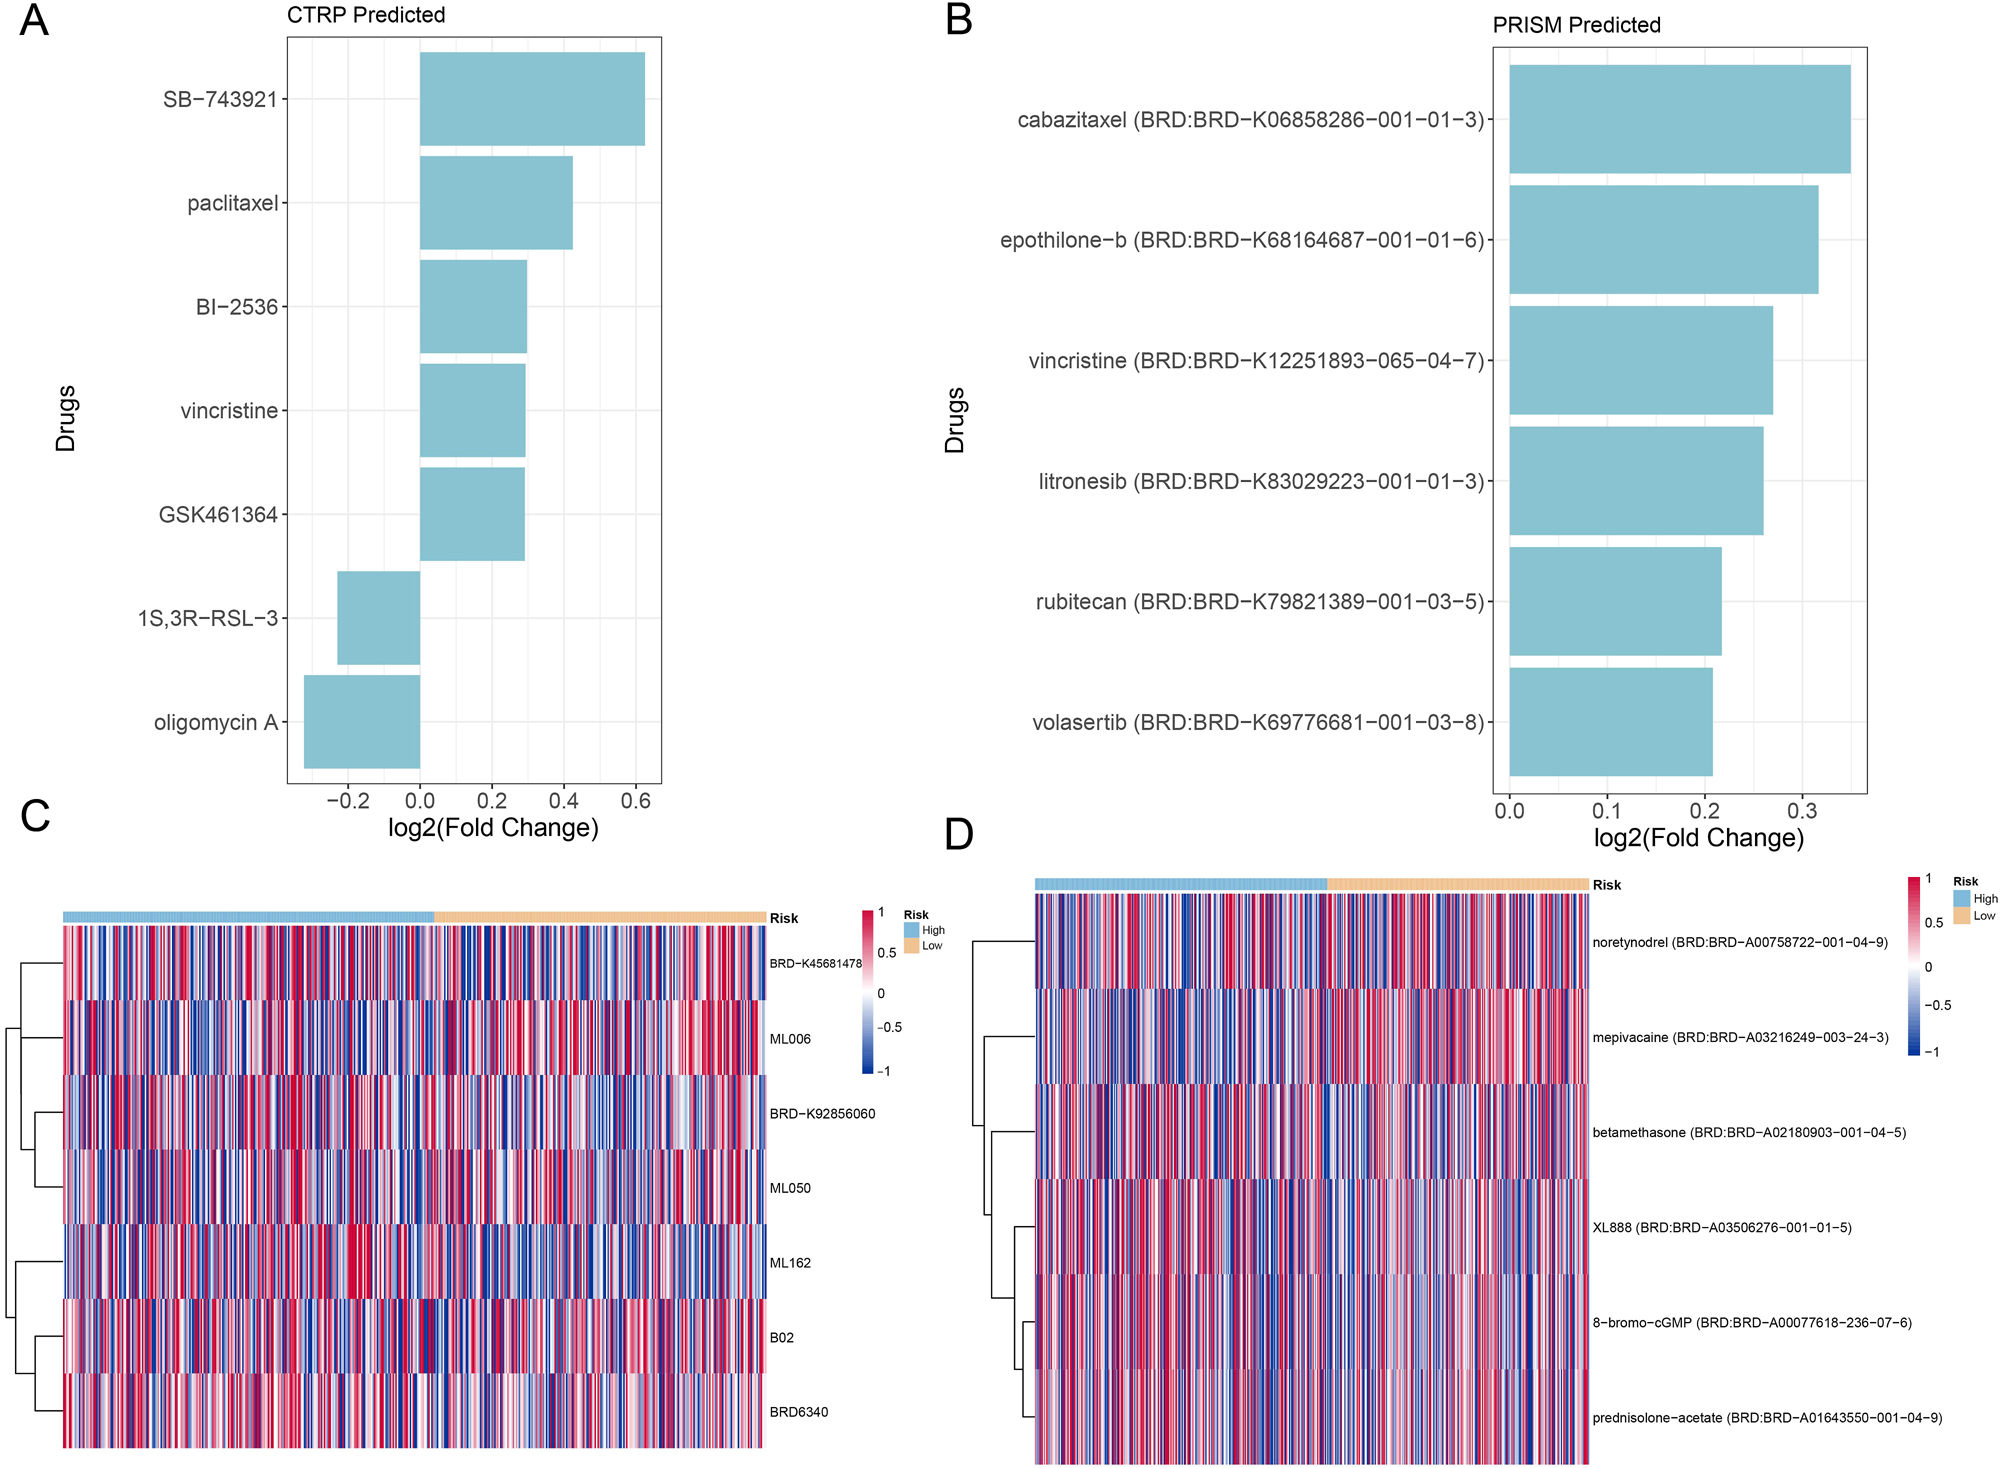
Drug sensitivity prediction by CTRP and PRISM. (A) CTRP predicts drugs with significant differences in therapeutic efficacy based on their sensitivity. (B) PRISM predicts drugs exhibiting notable disparities in treatment outcomes according to their sensitivity. (C) Heatmap illustrating the fold changes in drug sensitivity between high- and low-risk groups, as well as sensitivity predictions, obtained from CTRP. (D) Heatmap depicting the fold changes in drug sensitivity between high- and low-risk groups and sensitivity predictions by PRISM.
Discussion
LUAD is a major cause of cancer-correlated mortality worldwide. Early-stage cancer-related symptoms of LUAD are not obvious, which also hinders the clinical effects of traditional treatments [35]. Therefore, it is urgent to identify new biomarkers and establish prognostic models for the cancer. A previous study showed that neutrophil infiltration is related to a poor prognosis in advanced LUAD [36]. Recently, the development of scRNA-seq technology has provided opportunities to study gene expression patterns at single-cell level [37]. Hence, this study explored the relationship between neutrophils and LUAD based on scRNA-seq technology and obtained corresponding biomarkers to develop a prognostic model. The present discovery helps deepen our understanding of LUAD and provides a new perspective for the early diagnosis of the cancer.
This study investigated the roles of five potential biomarkers (P2RY13, CYTIP, ZYX, KLRB1, and HMOX1) that were all intimately associated with neutrophils in LUAD [38]. Clinical research reports indicated that lung cancer patients exhibit high levels of neutrophils in the tumor and in circulation. In cancers, the pro-tumorigenic or anti-tumorigenic properties are attributed to tumor-associated neutrophils (TANs) [39]. TANs play pivotal roles in numerous aspects of tumor development, including malignant transformation, tumor progression, extracellular matrix remodeling, angiogenesis, cell migration, and immune suppression [40]. P2RY13, a G-protein-coupled receptor sensitive to extracellular nucleotides [41], is significantly downregulated in LUAD tissues [42], suggesting that it may serve as a key regulatory node for pro-tumorigenic activity of TANs as it could indirectly influence cancer progression through modulation of TAN functions [43]. CYTIP interacts with cell adhesion molecule-1 and its expression is related to the survival outcomes of lung cancer patients, further highlighting its significance in lung cancer biology [44]. ZYX, a member of the LIM domain protein family, typically functions in focal adhesions and stress fibers [45]. The overexpression of ZYX in breast cancer and colorectal cancer is closely correlated with the clinical outcomes of these two cancers [46], 47]. Consistent with previous reports [48], this study observed significantly lower ZYX expression in cancer tissues than in normal lung tissues, indicating its potential inhibitory role in lung cancer development. KLRB1 encodes CD161 and is widely expressed on the surfaces of NK cells and T lymphocytes [49]. A lower KLRB1 level is associated with reduced neutrophil counts [50] and enhanced cell growth and metastasis, poor prognosis, and immune microenvironment dysfunction in LUAD, revealing its critical role in maintaining immune homeostasis and anti-tumor immunity [49]. As the core gene for functional validation in this study, HMOX1 showed significantly upregulated expression in LUAD cells, which was in accordance with previous findings in pancreatic cancer and NSCLC [51], 52]. As a key enzyme in heme degradation, high-expressed HMOX1 is linked to enhanced tumor aggressiveness and predicts poor prognosis [53]. Huang and Tan reported that HMOX1 modulates the infiltration of immune cells, especially that of neutrophils and macrophages, in ovarian cancer [54]. In addition, in NSCLC, Gao et al. found the long non-coding RNA RGMB-AS1 interacts with HMOX1 to inhibit its ubiquitination by the E3 ligase TRC8, which improves the stability of HMOX1 and promotes ferroptosis [55]. In summary, by analyzing the expression patterns and functions of these five biomarkers in LUAD, this study provides novel insights into the complex mechanisms underlying the role of neutrophils in lung cancer.
The high-risk and low-risk groups of LUAD were comprehensively compared from multiple aspects. Firstly, the distribution of mutated genes showed that TTN, TP53, and MUC17 were significantly upregulated in the high-risk group than in the low-risk group. TTN consists of 364 exons and is located on chromosome 2q31 and encodes proteins found in striated muscles [56]. Previous studies demonstrated that TTN mutations influence the prognosis of LUAD patients [57]. TP53 locates on 17p13 and encodes the p53 protein. TP53 is a TF that is considered as a key regulator of numerous cellular processes, including proliferation, differentiation, apoptosis, metabolism, and DNA repair [58]. In NSCLC, TP53 mutations are detected in approximately 40 % of LUAD and 51 % of squamous cell carcinomas [59], 60]. A lower level of MUC1 modulates the downregulation of the expression of NF-κB inhibitor α in cancer cells and is correlated with poor prognosis [61]. Therefore, significantly upregulated TTN, TP53, and MUC17 in the high-risk group suggested that they may potentially contribute to the prognosis difference between the two risk groups. Furthermore, KEGG enrichment analysis revealed that enriched pathways in the high-risk group were intimately related to fundamental cellular life activities, while those in the low-risk group were more related to the adaptation of organisms and responses to external environments. Collectively, our findings revealed the biological mechanisms underlying the poorer prognosis observed in the high-risk LUAD group. However, the enrichment results of the low-risk group indicated a greater environmental adaptation and response capacity, which may explain a more favorable prognosis in this group.
Vincristine was a common potential drug identified by both CTRP and PRISM algorithms. Vincristine, which naturally exists in Catharanthus roseus, is a microtubule polymerization inhibitor. Vincristine inhibits microtubule polymerization by binding to tubulin, thereby disrupting the division and proliferation of cancer cells [62]. Study proved that this drug can be used in adjuvant chemotherapy after surgery, especially for LUAD patients [63]. Currently, vincristine is and will continue to be a stable component of various anticancer regimens. According to past and our current discoveries [64], it was speculated that vincristine may be closely related to tumor-targeting antibodies for the treatment of LUAD.
Although this study used high-resolution single-cell sequencing analysis to show the strong correlation between neutrophils and LUAD, it still had certain limitations. Firstly, the sample size of the single-cell sequencing dataset used in this was small. In addition, only the top 5 most important genes were validated in vitro and only the functional role of HMOX1 was verified, while other potentially important genes or mechanisms remained to be explored. Hence, future studies are encouraged to validate more candidate genes to verify the interplay between neutrophils and LUAD. Finally, in vivo experiments should be carried out to examine the specific mechanism of neutrophils in the development and progression of LUAD, providing a more solid theoretical basis and experimental evidence for the clinical treatment of LUAD.
Conclusions
This study explored the relationship between LUAD and neutrophils applying single-cell sequencing technology and identified four neutrophil subpopulations, namely, Neu0, Neu1, Neu2, and Neu3. Five LUAD biomarkers including P2RY13, CYTIP, ZYX, KLRB1, and HMOX1 were found to be closely related to neutrophils. Based on these findings, a prognostic model was established. The current discovery not only deepens our understanding of the pathogenesis of LUAD, but also provides a new direction for early the diagnosis and monitoring of the cancer.
Funding source: The Project of Ningbo Leading Medical & Health Discipline
Award Identifier / Grant number: 2022-F02
Funding source: Ningbo Clinical Research Center for thoracic & breast neoplasms
Award Identifier / Grant number: 2021L002
-
Research ethics: Not applicable.
-
Informed consent: Not applicable.
-
Author contributions: Conceived and designed the analysis: Shen W; Collected the data: Li Y, Fei J, Yu H; Contributed the data or analysis tools: Li Y, Fei J; Wrote the original paper: Li Y; Reviewed and edited the paper: Shen W. All the authors reviewed the results and approved the final version of the manuscript.
-
Use of Large Language Models, AI and Machine Learning Tools: None declared.
-
Conflict of interest: The authors declare that they have no conflicts of interest to report regarding the present study.
-
Research funding: This study was approved by Ningbo Clinical Research Center for thoracic & breast neoplasms (2021L002) and The Project of Ningbo Leading Medical & Health Discipline (2022-F02).
-
Data availability: The data supporting this study’s findings are available from the corresponding author upon request.
References
1. Bray, F, Laversanne, M, Sung, H, Ferlay, J, Siegel, RL, Soerjomataram, I, et al.. Global Cancer Statistics 2022: GLOBOCAN estimates of incidence and mortality worldwide for 36 cancers in 185 countries. CA Cancer J Clin 2024;74:229–63. https://doi.org/10.3322/caac.21834.Suche in Google Scholar PubMed
2. Liang, L, Xu, W-Y, Shen, A, Cen, H-Y, Chen, Z-J, Tan, L, et al.. Promoter methylation-regulated miR-148a-3p inhibits lung adenocarcinoma (LUAD) progression by targeting MAP3K9. Acta Pharmacol Sin 2022;43:2946–55. https://doi.org/10.1038/s41401-022-00893-8.Suche in Google Scholar PubMed PubMed Central
3. Zhu, QJ, Chai, YF, Jin, LY, Ma, YC, Lu, HW, Chen, YJ, et al.. Construction and validation of a novel prognostic model of neutrophil-related genes signature of lung adenocarcinoma. Sci Rep 2023;13:18226. https://doi.org/10.1038/s41598-023-45289-8.Suche in Google Scholar PubMed PubMed Central
4. Zhang, JR, Xu, H, Yang, XM, Zhao, YJ, Xu, XC, Zhang, L, et al.. Deubiquitinase UCHL5 is elevated and associated with a poor clinical outcome in lung adenocarcinoma (LUAD). J Cancer 2020;11:6675–85. https://doi.org/10.7150/jca.46146.Suche in Google Scholar PubMed PubMed Central
5. Succony, L, Rassl, DM, Barker, AP, McCaughan, FM, Rintoul, RC. Adenocarcinoma spectrum lesions of the lung: detection, pathology and treatment strategies. Cancer Treat Rev 2021;99:102237. https://doi.org/10.1016/j.ctrv.2021.102237.Suche in Google Scholar PubMed
6. Binnewies, M, Roberts, EW, Kersten, K, Chan, V, Fearon, DF, Merad, M, et al.. Understanding the tumor immune microenvironment (TIME) for effective therapy. Nat Med 2018;24:541–50. https://doi.org/10.1038/s41591-018-0014-x.Suche in Google Scholar PubMed PubMed Central
7. Zhou, JH, Xu, QX, Liu, H, Miao, JL, Bian, CX, Wei, YT, et al.. Prognostic value of tumor-associated CD177+ neutrophils in lung adenocarcinoma. Oncol Lett 2024;27:189. https://doi.org/10.3892/ol.2024.14322.Suche in Google Scholar PubMed PubMed Central
8. Quail, DF, Amulic, B, Aziz, M, Barnes, BJ, Eruslanov, E, Fridlender, ZG, et al.. Neutrophil phenotypes and functions in cancer: a consensus statement. J Exp Med 2022;219:e20220011. https://doi.org/10.1084/jem.20220011.Suche in Google Scholar PubMed PubMed Central
9. Zhang, C, Tang, B, Hu, J, Fang, X, Bian, H, Han, J, et al.. Neutrophils correlate with hypoxia microenvironment and promote progression of non-small-cell lung cancer. Bioengineered 2021;12:8872–84. https://doi.org/10.1080/21655979.2021.1987820.Suche in Google Scholar PubMed PubMed Central
10. Carus, A, Ladekarl, M, Hager, H, Pilegaard, H, Nielsen, PS, Donskov, F. Tumor-associated neutrophils and macrophages in non-small cell lung cancer: no immediate impact on patient outcome. Lung Cancer 2013;81:130–7. https://doi.org/10.1016/j.lungcan.2013.03.003.Suche in Google Scholar PubMed
11. Rakaee, M, Busund, LT, Paulsen, EE, Richardsen, E, Al-Saad, S, Andersen, S, et al.. Prognostic effect of intratumoral neutrophils across histological subtypes of non-small cell lung cancer. Oncotarget 2016;7:72184–96. https://doi.org/10.18632/oncotarget.12360.Suche in Google Scholar PubMed PubMed Central
12. Kodous, AS, Balaiah, M, Ramanathan, P. Single cell RNA sequencing – a valuable tool for cancer immunotherapy: a mini review. Oncologie 2023;25:635–9. https://doi.org/10.1515/oncologie-2023-0244.Suche in Google Scholar
13. Zulibiya, A, Wen, J, Yu, H, Chen, X, Xu, L, Ma, X, et al.. Single-cell RNA sequencing reveals potential for endothelial-to-mesenchymal transition in tetralogy of Fallot. Congenit Heart Dis 2023;18:611–25. https://doi.org/10.32604/chd.2023.047689.Suche in Google Scholar
14. Zhang, J, He, J, Chen, W, Chen, G, Wang, L, Liu, Y, et al.. Single-cell RNA-binding protein pattern-mediated molecular subtypes depict the hallmarks of the tumor microenvironment in bladder urothelial carcinoma. Oncologie 2024;26:657–69. https://doi.org/10.1515/oncologie-2024-0071.Suche in Google Scholar
15. Paik, DT, Cho, S, Tian, L, Chang, HY, Wu, JC. Single-cell RNA sequencing in cardiovascular development, disease and medicine. Nat Rev Cardiol 2020;17:457–73. https://doi.org/10.1038/s41569-020-0359-y.Suche in Google Scholar PubMed PubMed Central
16. Zhang, Y, Wang, D, Peng, M, Tang, L, Ouyang, J, Xiong, F, et al.. Single‐cell RNA sequencing in cancer research. J Exp Clin Cancer Res 2021;40:81. https://doi.org/10.1186/s13046-021-01874-1.Suche in Google Scholar PubMed PubMed Central
17. Van de Sande, B, Lee, JS, Mutasa-Gottgens, E, Naughton, B, Bacon, W, Manning, J, et al.. Applications of single-cell RNA sequencing in drug discovery and development. Nat Rev Drug Discov 2023;22:496–520. https://doi.org/10.1038/s41573-023-00688-4.Suche in Google Scholar PubMed PubMed Central
18. Sayers, EW, Beck, J, Bolton, EE, Bourexis, D, Brister, JR, Canese, K, et al.. Database resources of the national center for biotechnology information. Nucleic Acids Res 2021;49:D10–d7. https://doi.org/10.1093/nar/gkaa892.Suche in Google Scholar PubMed PubMed Central
19. Hao, YH, Stuart, T, Kowalski, MH, Choudhary, S, Hoffman, P, Hartman, A, et al.. Dictionary learning for integrative, multimodal and scalable single-cell analysis. Nat Biotechnol 2024;42:293–304. https://doi.org/10.1038/s41587-023-01767-y.Suche in Google Scholar PubMed PubMed Central
20. McGinnis, CS, Murrow, LM, Gartner, ZJ. DoubletFinder: doublet detection in single-cell RNA sequencing data using artificial nearest neighbors. Cell Syst 2019;8:329–37.e4. https://doi.org/10.1016/j.cels.2019.03.003.Suche in Google Scholar PubMed PubMed Central
21. Korsunsky, I, Millard, N, Fan, J, Slowikowski, K, Zhang, F, Wei, K, et al.. Fast, sensitive and accurate integration of single-cell data with Harmony. Nat Methods 2019;16:1289–96. https://doi.org/10.1038/s41592-019-0619-0.Suche in Google Scholar PubMed PubMed Central
22. Aran, D, Looney, AP, Liu, L, Wu, E, Fong, V, Hsu, A, et al.. Reference-based analysis of lung single-cell sequencing reveals a transitional profibrotic macrophage. Nat Immunol 2019;20:163–72. https://doi.org/10.1038/s41590-018-0276-y.Suche in Google Scholar PubMed PubMed Central
23. Patel, AP, Tirosh, I, Trombetta, JJ, Shalek, AK, Gillespie, SM, Wakimoto, H, et al.. Single-cell RNA-seq highlights intratumoral heterogeneity in primary glioblastoma. Science 2014;344:1396–401. https://doi.org/10.1126/science.1254257.Suche in Google Scholar PubMed PubMed Central
24. Jin, SQ, Guerrero-Juarez, CF, Zhang, LH, Chang, I, Ramos, R, Kuan, C-H, et al.. Inference and analysis of cell-cell communication using CellChat. Nat Commun 2021;12:1088. https://doi.org/10.1038/s41467-021-21246-9.Suche in Google Scholar PubMed PubMed Central
25. Aibar, S, González-Blas, CB, Moerman, T, Huynh-Thu, VA, Imrichova, H, Hulselmans, G, et al.. SCENIC: single-cell regulatory network inference and clustering. Nat Methods 2017;14:1083–6. https://doi.org/10.1038/nmeth.4463.Suche in Google Scholar PubMed PubMed Central
26. Wilkerson, MD, Hayes, DN. ConsensusClusterPlus: a class discovery tool with confidence assessments and item tracking. Bioinformatics 2010;26:1572–3. https://doi.org/10.1093/bioinformatics/btq170.Suche in Google Scholar PubMed PubMed Central
27. Hänzelmann, S, Castelo, R, Guinney, J. GSVA: gene set variation analysis for microarray and RNA-Seq data. BMC Bioinformatics 2013;14:7. https://doi.org/10.1186/1471-2105-14-7.Suche in Google Scholar PubMed PubMed Central
28. Liu, J, Jing, L, Tu, XL. Weighted gene co-expression network analysis identifies specific modules and hub genes related to coronary artery disease. BMC Cardiovasc Disord 2016;5:54. https://doi.org/10.1186/s12872-016-0217-3.Suche in Google Scholar PubMed PubMed Central
29. Rushing, C, Bulusu, A, Hurwitz, HI, Nixon, AB, Pang, H. A leave-one-out cross-validation SAS macro for the identification of markers associated with survival. Comput Biol Med 2015;57:123–9. https://doi.org/10.1016/j.compbiomed.2014.11.015.Suche in Google Scholar PubMed PubMed Central
30. Yu, G, Li, F, Qin, Y, Bo, X, Wu, Y, Wang, S. GOSemSim: an R package for measuring semantic similarity among GO terms and gene products. Bioinformatics 2010;26:976–8. https://doi.org/10.1093/bioinformatics/btq064.Suche in Google Scholar PubMed
31. Livak, KJ, Schmittgen, TD. Analysis of relative gene expression data using real-time quantitative PCR and the 2(-Delta Delta C(T)) method. Methods 2001;25:402–8. https://doi.org/10.1006/meth.2001.1262.Suche in Google Scholar PubMed
32. Mayakonda, A, Lin, D-C, Assenov, Y, Plass, C, Koeffler, HP. Maftools: efficient and comprehensive analysis of somatic variants in cancer. Genome Res 2018;28:1747–56. https://doi.org/10.1101/gr.239244.118.Suche in Google Scholar PubMed PubMed Central
33. Thorsson, V, Gibbs, DL, Brown, SD, Wolf, D, Bortone, DS, Ou Yang, TH, et al.. The immune landscape of cancer. Immunity 2018;48:812–30.e14. https://doi.org/10.1016/j.immuni.2018.03.023.Suche in Google Scholar PubMed PubMed Central
34. Shen, W, Song, Z, Zhong, X, Huang, M, Shen, D, Gao, P, et al.. Sangerbox: a comprehensive, interaction‐friendly clinical bioinformatics analysis platform. Imeta 2022;1:e36. https://doi.org/10.1002/imt2.36.Suche in Google Scholar PubMed PubMed Central
35. Dong, H-X, Wang, R, Jin, X-Y, Zeng, J, Pan, J. LncRNA DGCR5 promotes lung adenocarcinoma (LUAD) progression via inhibiting hsa-mir-22-3p. J Cel Physiol 2018;233:4126–36. https://doi.org/10.1002/jcp.26215.Suche in Google Scholar PubMed
36. Peng, H, Wu, X, Liu, S, He, M, Tang, C, Wen, Y, et al.. Cellular dynamics in tumour microenvironment along with lung cancer progression underscore spatial and evolutionary heterogeneity of neutrophil. Clin Transl Med 2023;13:e1340. https://doi.org/10.1002/ctm2.1340.Suche in Google Scholar PubMed PubMed Central
37. Chen, G, Ning, B, Shi, T. Single-cell RNA-seq technologies and related computational data analysis. Front Genet 2019;10:317. https://doi.org/10.3389/fgene.2019.00317.Suche in Google Scholar PubMed PubMed Central
38. Shaul, ME, Eyal, O, Guglietta, S, Aloni, P, Zlotnik, A, Forkosh, E, et al.. Circulating neutrophil subsets in advanced lung cancer patients exhibit unique immune signature and relate to prognosis. FASEB J 2020;34:4204–18. https://doi.org/10.1096/fj.201902467r.Suche in Google Scholar PubMed
39. Zhou, J, Liu, H, Jiang, S, Wang, W. Role of tumor-associated neutrophils in lung cancer (Review). Oncol Lett 2023;25:2. https://doi.org/10.3892/ol.2022.13588.Suche in Google Scholar PubMed PubMed Central
40. Coffelt, SB, Wellenstein, MD, de Visser, KE. Neutrophils in cancer: neutral no more. Nat Rev Cancer 2016;16:431–46. https://doi.org/10.1038/nrc.2016.52.Suche in Google Scholar PubMed
41. Pérez-Sen, R, Gómez-Villafuertes, R, Ortega, F, Gualix, J, Delicado, EG, Miras-Portugal, MT. An update on P2Y13 receptor signalling and function. In: Atassi, MZ, editor. Protein reviews. Singapore: Springer Singapore; 2017, vol 19:139–68 pp. https://doi.org/10.1007/5584_2017_91.Suche in Google Scholar PubMed
42. Lin, J, Wu, C, Ma, D, Hu, Q. Identification of P2RY13 as an immune-related prognostic biomarker in lung adenocarcinoma: a public database-based retrospective study. PeerJ 2021;9:e11319. https://doi.org/10.7717/peerj.11319.Suche in Google Scholar PubMed PubMed Central
43. Liu, R, Zhu, G, Sun, Y, Li, M, Hu, Z, Cao, P, et al.. Neutrophil infiltration associated genes on the prognosis and tumor immune microenvironment of lung adenocarcinoma. Front Immunol 2023;14:1304529. https://doi.org/10.3389/fimmu.2023.1304529.Suche in Google Scholar PubMed PubMed Central
44. Grosche, L, Draßner, C, Mühl-Zürbes, P, Kamm, L, Le-Trilling, VTK, Trilling, M, et al.. Human cytomegalovirus-induced degradation of CYTIP modulates dendritic cell adhesion and migration. Front Immunol 2017;8:461. https://doi.org/10.3389/fimmu.2017.00461.Suche in Google Scholar PubMed PubMed Central
45. Smith, MA, Hoffman, LM, Mcjticb, B. LIM proteins in actin cytoskeleton mechanoresponse. Trends Cel Biol 2014;24:575–83. https://doi.org/10.1016/j.tcb.2014.04.009.Suche in Google Scholar PubMed PubMed Central
46. Ma, B, Cheng, H, Gao, R, Mu, C, Chen, L, Wu, S, et al.. Zyxin-Siah2–Lats2 axis mediates cooperation between Hippo and TGF-β signalling pathways. Nat Commun 2016;7:11123. https://doi.org/10.1038/ncomms11123.Suche in Google Scholar PubMed PubMed Central
47. Zhong, C, Yu, J, Li, D, Jiang, K, Tang, Y, Yang, M, et al.. Zyxin as a potential cancer prognostic marker promotes the proliferation and metastasis of colorectal cancer cells. J Cel Physiol 2019;234:15775–89. https://doi.org/10.1002/jcp.28236.Suche in Google Scholar PubMed
48. Partynska, A, Gomulkiewicz, A, Piotrowska, A, Grzegrzolka, J, Rzechonek, A, Ratajczak-Wielgomas, K, et al.. Expression of zyxin in non-small cell lung cancer—a preliminary study. Biomolecules 2022;12:827. https://doi.org/10.3390/biom12060827.Suche in Google Scholar PubMed PubMed Central
49. Chen, J-L, Wu, C-Y, Luo, X-Y, Wang, X-Y, Wang, F-M, Huang, X, et al.. Down-regulation of KLRB1 is associated with increased cell growth, metastasis, poor prognosis, as well as a dysfunctional immune microenvironment in LUAD. Sci Rep 2024;14:11782. https://doi.org/10.1038/s41598-024-60414-x.Suche in Google Scholar PubMed PubMed Central
50. He, JR, Li, D, Zhang, QX, Liu, T, Ding, Y, Wu, CY, et al.. Inhibiting KLRB1 expression is associated with impairing cancer immunity and leading to cancer progression and poor prognosis in breast invasive carcinoma patients. Aging (Albany NY) 2023;15:13265–86. https://doi.org/10.18632/aging.205239.Suche in Google Scholar PubMed PubMed Central
51. Han, L, Jiang, J, Ma, Q, Wu, Z, Wang, Z. The inhibition of heme oxygenase-1 enhances the chemosensitivity and suppresses the proliferation of pancreatic cancer cells through the SHH signaling pathway. Int J Oncol 2018;52:2101–9. https://doi.org/10.3892/ijo.2018.4363.Suche in Google Scholar PubMed
52. Tsai, J-R, Wang, H-M, Liu, P-L, Chen, Y-H, Yang, M-C, Chou, S-H, et al.. High expression of heme oxygenase-1 is associated with tumor invasiveness and poor clinical outcome in non-small cell lung cancer patients. Cel Oncol 2012;35:461–71. https://doi.org/10.1007/s13402-012-0105-5.Suche in Google Scholar PubMed
53. Song, S, Nguyen, V, Schrank, T, Mulvaney, K, Walter, V, Wei, D, et al.. Loss of SWI/SNF chromatin remodeling alters NRF2 signaling in non-small cell lung carcinoma. Mol Cancer Res 2020;18:1777–88. https://doi.org/10.1158/1541-7786.mcr-20-0082.Suche in Google Scholar
54. Huang, J, Tan, R. HMOX1: a pivotal regulator of prognosis and immune dynamics in ovarian cancer. BMC Womens Health 2024;24:476. https://doi.org/10.1186/s12905-024-03309-3.Suche in Google Scholar PubMed PubMed Central
55. Gao, GB, Chen, L, Pan, JF, Lei, T, Cai, X, Hao, Z, et al.. LncRNA RGMB-AS1 inhibits HMOX1 ubiquitination and NAA10 activation to induce ferroptosis in non-small cell lung cancer. Cancer Lett 2024;590:216826. https://doi.org/10.1016/j.canlet.2024.216826.Suche in Google Scholar PubMed
56. Chauveau, C, Rowell, J, Ferreiro, A. A rising titan: review and mutation update. Hum Mutat 2014;35:1046–59. https://doi.org/10.1002/humu.22611.Suche in Google Scholar PubMed
57. Zou, S, Ye, J, Hu, S, Wei, Y, Xu, J. Mutations in the TTN gene are a prognostic factor for patients with lung squamous cell carcinomas. Int J Gen Med 2022;15:19–31. https://doi.org/10.2147/ijgm.s343259.Suche in Google Scholar PubMed PubMed Central
58. Sabapathy, K, Lane, DP. Therapeutic targeting of p53: all mutants are equal, but some mutants are more equal than others. Nat Rev Clin Oncol 2018;15:13–30. https://doi.org/10.1038/nrclinonc.2017.151.Suche in Google Scholar PubMed
59. Liu, S, Yu, J, Zhang, H, Liu, J. TP53 Co-mutations in advanced EGFR-mutated non-small cell lung cancer: prognosis and therapeutic strategy for cancer therapy. Front Oncol 2022;12:860563. https://doi.org/10.3389/fonc.2022.860563.Suche in Google Scholar PubMed PubMed Central
60. Guo, Y, Song, J, Wang, Y, Huang, L, Sun, L, Zhao, J, et al.. Concurrent genetic alterations and other biomarkers predict treatment efficacy of EGFR-TKIs in EGFR-mutant non-small cell lung cancer: a review. Front Oncol 2020;10:610923. https://doi.org/10.3389/fonc.2020.610923.Suche in Google Scholar PubMed PubMed Central
61. Lin, S, Ruan, H, Qin, L, Zhao, C, Gu, M, Wang, Z, et al.. Acquired resistance to EGFR-TKIs in NSCLC mediates epigenetic downregulation of MUC17 by facilitating NF-κB activity via UHRF1/DNMT1 complex. Int J Biol Sci 2023;19:832–51. https://doi.org/10.7150/ijbs.75963.Suche in Google Scholar PubMed PubMed Central
62. Škubník, J, Jurášek, M, Ruml, T, Rimpelová, S. Mitotic poisons in research and medicine. Molecules 2020;25:4632. https://doi.org/10.3390/molecules25204632.Suche in Google Scholar PubMed PubMed Central
63. Nakasone, S, Suzuki, A, Okazaki, H, Onodera, K, Zenkoh, J, Ishii, G, et al.. Predictive markers based on transcriptome modules for vinorelbine-based adjuvant chemotherapy for lung adenocarcinoma patients. Lung Cancer 2021;158:115–25. https://doi.org/10.1016/j.lungcan.2021.06.011.Suche in Google Scholar PubMed
64. Škubník, J, Pavlíčková, VS, Ruml, T, Rimpelová, S. Vincristine in combination therapy of cancer: emerging trends in clinics. Biology 2021;10:849. https://doi.org/10.3390/biology10090849.Suche in Google Scholar PubMed PubMed Central
Supplementary Material
This article contains supplementary material (https://doi.org/10.1515/oncologie-2024-0493).
© 2024 the author(s), published by De Gruyter on behalf of Tech Science Press (TSP)
This work is licensed under the Creative Commons Attribution 4.0 International License.
Artikel in diesem Heft
- Frontmatter
- Editorial
- The essential development of integrative oncology
- Review Articles
- Novel post-translational modifications in cancer
- The assessment of 5-aminolevulinic acid photodynamic therapy in glioblastomas
- Histone methylation and acetylation in cancer: mechanism, progression, and targets
- Current advancements in PD-L1 modulation by CMTM6 in malignant tumors
- Research Articles
- Combination of oxabicycloheptene sulfonate (OBHS) and antidiabetic drugs synergistically inhibits proliferation in human breast cancer cells
- Cell indices as predictors of progression-free survival in multiple myeloma: a retrospective cohort study
- The Y44 residue point mutation in CXCL14 reveals the significance of CXCL14 protein stability in anti-tumor activity
- Oxeiptosis gene expression profiling identified TCN1 as a prognostic factor for breast cancer
- Integrated analyses reveal prognostic markers associated with cancer-associated fibroblasts in oral squamous cell carcinoma
- The roles of G protein-coupled receptor genes and the tumor microenvironment in esophageal squamous cell carcinoma
- Combining the Albumin-to-fibrinogen ratio and pathologic factors predicts survival in surgically treated patients with esophageal squamous cell carcinoma
- Joint multi-omics screening of neutrophil-related biomarkers for lung adenocarcinoma
- High-throughput sequencing reveals twelve cell death pattern prognostic target genes as potential drug-response-associated genes in the treatment of colorectal cancer cells with palmatine hydrochloride
- Article Commentary
- A commentary: optimizing the prevention of osteoradionecrosis in head and neck cancer treatment