UV–vis spectroscopy as a rapid method for evaluation of total phenolic hydroxyl structures in lignin
-
Nataliia Smyk
 ,
Jenny Sjöström
,
Jenny Sjöström

Abstract
Phenolic hydroxyl groups in lignin are crucial for understanding its structure, reactivity, and potential applications. Various methods have been developed for the determining phenolic groups in lignin. This study focuses on the comparison of a simple, cost-effective, and time-efficient UV–vis ionization difference technique with the highly accurate 31P NMR spectroscopy for analyzing lignin samples of different origins and isolation methods. The results were carefully evaluated, and the strengths and limitations of each method were discussed. Two eco-friendly UV–vis approaches were proposed for a rapid and comprehensive evaluation of the total phenolic-OH groups: one using a strong alkaline solution for analyzing common types of technical lignins, and another employing multipoint wavelength calculations, effective for analyzing softwood lignins regardless of the extraction method. Additionally, the research highlighted the importance of selecting appropriate model phenolic compounds to accurately assess the phenolic hydroxyl group content in lignins using the UV–vis method. Offering straightforward and rapid analysis, with results closely aligning with 31P NMR data, this method is a promising alternative for routine analysis.
1 Introduction
Lignin, one of the most abundant biopolymers, is found in the cell walls of wood and other vascular plants (Boerjan et al. 2003; Henriksson 2017; Ragauskas et al. 2014; Sjöström 1993). It stands out among other biopolymers due to its unique structure: the monomers, known as monolignols, are phenolic structures linked by various bonds, including ethers and carbon-carbon bonds, arranged in a racemic mixture without a defined primary structure (Hatakeyama and Hatakeyama 2009; Heitner et al. 2010; Henriksson 2017). The aromatic structure of lignin, coupled with its multiple covalent bonds to cell wall polysaccharides, makes it challenging to isolate in its native form at a low cost (Giummarella et al. 2019). Consequently, lignins used in applications are typically derived from byproducts of technical processes applied to wood and other plant materials, such as chemical pulping and various biorefinery processes (Kazzaz and Fatehi 2020). However, these technical lignins possess a structure that is different and often more complex than that of native lignin (Constant et al. 2016; Gellerstedt and Lindfors 1987).
The economically and technically most important group of lignins are the lignosulfonates, soluble lignin derivates that are obtained from the pulping liquors of sulfite pulping, or by sulfonation of kraft lignin (Aro and Fatehi 2017). These types of lignin have large and for a longtime established use as dispersing agents on applications such as concrete asphalt and ink (Yang et al. 1981). However, the use of sulfite pulping is declining, being replaced by kraft pulping (Biermann 1993). The lignin released during this process, kraft lignin, is mainly burned during the chemical recovery process, but some kraft lignin can be taken out (Gellerstedt and Lindfors 1987; Tomani 2010). As mentioned above, it can be used for making lignosulfonates but is also tested as a sustainable source of energy, biofuels, and chemical production in the biorefining process. Additionally, lignin may be used as an antioxidant and UV protective additive in the polymer materials, food, cosmetic, and pharmaceutical industries, as well as a base material for producing electrodes for energy storage applications (Aminzadeh et al. 2017; Jablonsky et al. 2015; Lauberts et al. 2017; Lawoko and Samec 2022; Puziy et al. 2020; Pylypchuk et al. 2022; Yao et al. 2020; Zhu et al. 2016).
Kraft lignin has the opposite of lignosulfonates poor solubility properties being water soluble only at high pH (Giummarella et al. 2016), and can therefore not without modification be used for similar applications as lignosulfonates. However, an alternative source for lignosulphonates could be oxidized kraft lignin (Vikman et al. 2022) or lignin isolated from the liquor after the oxygen delignification step, so-called oxlignin (Sjöström et al. 2023). Furthermore, the properties of kraft lignin might differ not only due to pulping parameters, such as the intensity of the pulping, and isolation methods (Gellerstedt and Lindfors 1987; Svärd et al. 2016) but also based on the raw material; lignin from hardwoods (woody eudicotyledons), softwood (conifers) and monocotyledons such as grasses and bamboo vary both in monolignol composition and patterns of the bonds between the monolignols and thus affected by pulping process differently (Lin and Dence 1992; Sjöström et al. 2023).
Technical lignin faces challenges in realizing its full potential due to its structural complexity, characterized by inhomogeneous reactivity and thermal instability. Consequently, the characterization of technical lignins, particularly kraft lignins, is of fundamental importance for the material’s applicability. To transform technical lignins into a high-value, renewable raw material for the chemical industry, their functional properties need to be characterized in more detail (Gosselink et al. 2010). Since lignin is formed through oxidative polymerization involving phenolic radicals, the phenolic hydroxyl (Ph-OH) groups in the aromatic rings are especially reactive. These groups significantly influence lignin’s chemical reactivity and applications (Diment et al. 2024; Vallejos et al. 2011). Therefore, determining the phenolic –OH group content of technical lignin is vital. Beyond their role in chemical reactivity, aromatic hydroxyl groups also contribute to the solubility and antioxidant activity of technical lignins (Dizhbite et al. 2004; Duan et al. 2022; Tagami et al. 2019). Thus, accurate and cost-effective determination of phenolic –OH content is crucial for developing lignin-based products, including carbon fibers, hydrogels, biosensors, phenolic resins, thermosets, rubbers, polymer blends, composites, and dispersants.
Over the years, numerous methods have been developed to determine the content and distribution of phenolic –OH groups in lignin (Dence 1992; El Mansouri and Salvado 2007). These methods vary in their complexity, sensitivity, and specificity, offering researchers a diverse range of options tailored to their specific needs and objectives. Commonly used techniques include potentiometric or conductometric titration; aminolysis; spectrophotometry (UV–vis), Fourier-transform infrared and nuclear magnetic resonance spectroscopy (FTIR and NMR), high-performance liquid and gas chromatography (HPLC and GC). To obtain comprehensive and reliable results, a combination of these methods is often employed (Constant et al. 2016; El Mansouri and Salvado 2007; Serrano et al. 2018). Most methods described have limitations that complicate or hinder their application on an industrial scale. In particular, aminolysis, FTIR, and NMR require preliminary preparative derivatization of the sample in a well-equipped laboratory. Chromatographic methods and NMR require the use of expensive equipment and highly skilled personnel. Non-aqueous titration methods are harmful to human health and nature because of the use of organic solvents. The recently proposed aqueous titrimetric technique that combine potentiometry and conductometry (Serrano et al. 2018) needs more than 1 g of sample and its total dissolution in water. The need to completely remove carbonates and prevent carbon dioxide from entering the system greatly complicates the process of conducting the analysis. Moreover, the results of determining the content of OH groups in lignins using this method and NMR do not align precisely. So, UV–vis and titration in an aqueous solution are the most acceptable for the development of a rapid method for the evaluation of phenolic OH groups in lignins.
UV–vis spectroscopy is well-known as a simple, rapid, and cost-effective analytical method. Therefore, it is widely used for qualitative and quantitative characterization of lignin (Lin and Dence 1992; Goldmann et al. 2017). In particular, the Folin and Ciocalteu (De Sousa et al. 2001; Folin and Denis 1912; Folin and Looney 1922; Folin and Ciocalteu 1927) and ionization difference (Gärtner et al. 1999; Zakis 1994) approaches of UV–vis spectroscopy are widely used for quantification of phenolic– OH groups Most authors suggest using organic solvents and organic-water mixtures to increase the solubility of lignins and optimize the degree of ionization of phenolic groups (Chen et al. 2022; Ruwoldt et al. 2022). This increases the threat to the environment and human health when using the method. Therefore, the aim of the presented work was to find a suitable UV–vis method for the rapid quantitative assessment of phenolic OH in lignins of various origins, methods of extraction, and pretreatment with a focus on the reduction of harmful impact on the environment.
In this study, we analyzed six samples of lignin that vary depending on origin (hardwood or softwood), extraction method or step in pulping process of isolation using four of the most popular variations of the UV–Vis ionization difference spectroscopy (Δε-IDUS) method (Chen et al. 2022; Goldschmid 1954; Goldmann et al. 2017; Lin and Dence 1992; Zakis 1994). The results obtained were compared with the ones of the 31P NMR spectroscopy method to assess their suitability for determining phenolic hydroxyl (Ph-OH) groups in lignin in aqueous solution. 31P NMR analysis is a widely recognized technique in this area (Korntner et al. 2015; Meng et al. 2019) and is generally used as reference method when a new technique for Ph-OH determination in lignins is developed (Chen et al. 2022). This study aims to provide valuable insights into the applicability and reliability of these methods in assessing phenolic –OH groups in lignin, thereby contributing to further advancements in lignin-based applications.
2 Materials and methods
2.1 Materials
Lignin samples were derived from different sources such as Norway spruce (a softwood) and eucalypt (Rose Gum Eucalyptus grandis, a hardwood), and were isolated from wood using various methods including kraft pulping, organosolv pulping, and oxygen delignification following kraft pulping. The kraft lignin samples (see Table 1) – kraft spruce (SL) and kraft eucalyptus (EL) – were obtained using LignoBoost technology (Tomani 2010) and were used without additional preparation.
Samples used: abbreviation and isolation methods.
| Sample | Isolation method, references | |
|---|---|---|
| Abbreviation | Full name | |
| SL | Kraft spruce lignin | Tomani (2010) |
| ELA | Acetone fraction of kraft eucalyptus lignin | Tagami et al. (2019) |
| EL | Kraft eucalyptus lignin | Tomani (2010) |
| OSS | Organosolv spruce lignin | (Gordobil et al. 2016; Pan et al. 2005) |
| OSE | Organosolv eucalyptus lignin | Dos Santos et al. (2014) |
| OS | Oxlignin | Sjöström et al. (2023) |
Methods for preparing samples of acetone fractionated of EL, eucalyptus organosolv lignin and oxlignin are described in Section 2.2.1.
All common chemicals used in various analyses, such as NaOH, H2SO4, H3BO3, and NaH2PO4, were of analytical grade and purchased from Sigma-Aldrich.
2.2 Methods
2.2.1 Lignins sample preparation
A sample of acetone fractionated of kraft eucalypt lignin (ELA) was prepared according to (Duval et al. 2016). The organosolv lignin of spruce was made as follows: a mixture of ethanol-water (50/50 w/w), with sulfuric acid (H2SO4) as a catalyst (1.2 % w/w) was used (Gordobil et al. 2016; Pan et al. 2005). This solvent was a mixture with SL in a solid-to liquid ratio of 1:7 (w/w). The treatment was carried out at 180 °C for 60 min in a 4 L pressure (20 bar) stainless steel batch reactor with constant stirring (EL0723 Iberfluid) and with an electronic control unit for pressure and temperature control. The spruce organosolv lignin (OSS) formed as a result of such processing is dissolved in a water-ethanol mixture. For the isolation of dissolved OSS, one volume of water-ethanol solution was mixed with four volumes of cold water. The lignin was recovered by filtration and then dried at 50 °C.
Technical organosolv lignin from eucalyptus wood was prepared as described by Dos Santos et al. (2014) and Gordobil et al. (2016): A mixture of ethanol-water (60/40 w/w) was used without a catalyst. The treatment was carried out at 180 °C for 90 min in the same reactor. The solid-to-liquid ratio was 1:10 (w/w). Dissolved eucalyptus organosolv lignin (OSE) was isolated by precipitation with water acidified by H2SO4 at a pH of around 2. The lignin was recovered by filtration and then dried at 50 °C.
A sample of oxlignin (OS) was obtained from the oxygen delignification liquor of Norway spruce and Scots pine, sourced from the Östrand kraft pulp mill. The initial solution was then filtered and isolated by precipitation with H2SO4 which was added stepwise until a pH of 2 was reached. The solid phase was separated from the liquid by centrifugation. Once the supernatant was extracted, the pellet was resuspended in a dilute H2SO4 solution and the separation was repeated. Finally, the pellet was freeze-dried (Sjöström et al. 2023).
2.2.2 Acidic and alkaline solvent preparation
0.2 mol L−1 sodium hydroxide solution. A sample weight of 7.9994 g of sodium hydroxide was diluted to 1.0 L with distilled water. 0.1 mol L−1 sodium hydroxide solution. A sample weight of 7.9994 g of sodium hydroxide was diluted to 2.0 L with distilled water. Buffer solution, pH 12. A sample weight of 12.4 g of boric acid was diluted to 2.0 L with 0.1 mol L−1 sodium hydroxide solution. Buffer solution, pH 6. A sample volume of 0.4950 L of 0.20 mol L−1 potassium dihydrogen phosphate solution was mixed with 0.1130 L of 0.1 mol L−1 sodium hydroxide solution and diluted to 2.0 L with distilled water.
2.2.3 Lignins sample solution preparation
A stock solution containing 0.1–0.3 g (to the nearest 0.0001 g) of each sample per 0.100 L of solution in pH 12 buffer was prepared. After complete dissolution of the sample, alkaline and neutralized solutions for analysis by the spectrophotometric method were prepared according to:
0.002 L portion of the stock solution diluted to 0.050 L
with pH 12 buffer solution (alkaline solution 1),
with 0.2 mol L−1 (0.2 M) sodium hydroxide solution (alkaline solution 2, super alkaline solution),
with 0.002 L of 0.1 N sulfuric acid and pH 6 buffer solution (neutralized solution).
The concentration of the solutions obtained (concentrations of alkaline and neutralized solutions are the same) were calculated according to:
Where C, g. L−1 – concentration of dilute solution; m, g – weighted (fully dissolved) amount of the lignin sample; V1 and V2, L – total and aliquot volume of the stock solution, respectively; V3, L – total volume of dilute solution.
One sample did not completely dissolve after 24 h of stirring. In this case, the undissolved residue was separated by filtration, dried, and weighed. The transparent stock solution was used to prepare alkaline and neutralized solutions. For this sample the parameter m, g in formula (1) was calculated:
Where m w , g – the weighted amount of the sample; m r , g – the amount of undissolved sample.
The concentration of diluted solutions should be such that the maximum absorbance reading of the difference curves falls within the range of 0.2–0.7.
2.3 Analytical techniques
2.3.1 UV–vis spectroscopy
Ultraviolet absorption spectra were determined with a UV–Vis spectrophotometer (UV-2550, Shimadzu, Tokyo, Japan). Matched 1-cm quartz absorption cells were used.
The difference spectrum was determined by measuring the absorbance of the alkaline solution (1 or 2) relative to that of the neutralized solution which was placed in the reference cell of the spectrophotometer as the “blank”. Readings were taken from 220 to 450 nm, spaced 0.5 nm apart.
Difference spectra were plotted in terms of absorbance (ΔA) or absorptivity (Δa, L.g−1.cm−1):
where ΔA – difference absorbance readings, C, g. L−1 – concentration of the lignin samples solutions; l, cm – path length.
The content of hydroxyl groups was calculated with four Δε-IDUS methods that were previously developed (Chen et al. 2022; Gärtner et al. 1999; Goldschmid 1954; Lin and Dence 1992; Zakis 1994). The equations used to calculate the phenolic content were derived from the differential molar absorptivitie (∆ε, L.mol−1.cm−1):
where ΔA – difference absorbance readings, C * , (mol of –OH) .L−1 - concentration of the solutions of phenolic model compounds (Table 2); l, cm – path length.
Model compounds used in varieties of Δε-IDUS method.
| Method | Model phenol | Type of Ph-OH according Figure 1 | References |
|---|---|---|---|
| Δε-IDUS 1 |
|
I | Goldschmid (1954) |
| Δε-IDUS 2 |

|
I | Lin and Dence (1992) |

|
II | ||

|
III | ||

|
IV | ||
| Δε-IDUS 3 |

|
I | Zakis (1994) |

|
II | ||

|
III | ||

|
IV | ||
| Δε-IDUS 4 |

|
I | Chen et al. (2022) |

|
II | ||

|
III | ||

|
IV |
The concentration of the solutions of phenolic model compounds were calculated according to:
Where m, g – weighted amount of the model compound; M r , g.mol−1 – molecular weight of model solution equivalent to one –OH group, V, L – the total volume of solution used for absorbance reading.
The Δε-IDUS 1 method was based on equation obtained in the work (Goldschmid 1954). Only one lignin alkali solution (with buffer pH 12) was used, and calculation was based on the value of maximal absorptivity (∆amax) of the band centered near 300 nm.
where c (OHTotal), mol.g−1 – total number of Ph-OH; Δa, L.g−1.cm−1 – the maximal value of difference absorptivity of lignin samples and ∆εmax, L.mol−1.cm−1 – the maximal value of difference molar absorptivity of the model compounds. Both number were calculated according equations (2) and (3) at λmax of the band centered near 300 nm.
The Δε-IDUS 2 method was based on the proposal of Lin and Dence (Goldmann et al. 2017; Lin and Dence 1992). This method also uses only one ionization level of Ph-OH (with alkali solution 1 with buffer pH 12) and describe six possible model structures. The formula for calculation were:
Where c (OHname), mol.g−1 – number of varied –OH structures per gram of substance; name – unconjugated (structure I + III), conjugated (structure IIa + IVa), weakly acidic C5-substituted (structure III), uncondensed (structure I + IIa) and total (structure I + IIa + III + IVa) (Figure 1).

Types of phenolic structures determined by the UV method (Gärtner et al. 1999; Zakis 1994) I – unconjugated-uncondensed. IIa, IIb – conjugated-uncondensed. III – unconjugated-condensed. IVa, IVb – conjugated-condensed.
The Δε-IDUS 3, the third variation used, was based on the work (Gärtner et al. 1999; Zakis 1994), was utilize two ionization levels and two alkali solutions, 1 and 2, with buffer pH 12 and with 0.2 mol L−1 NaOH respectively. Calculation based on the formula:
where c (OHname), mol.g−1 – number of varied–OH structures per gram of substance; name – unconjugated (structure I + III), conjugated (structure IIa + IVa), C5-substituted (structure III, IVa and IVb), uncondensed (structure I + IIa) and total (structure I + IIa + III + IVa + IVb) (Figure 1).
Δε-IDUS 4 was used the implementation made by (Chen et al. 2022). According to this work the total Ph-OH content was calculated as a sum:
Where CI – CIV, mmol g−1 are contributions of different types of phenolic structures (structures I–IV according to Figure 1).
These numbers were calculated by measuring the difference absorption (ΔA) at 300, 320, 350, and 370 nm of super alkaline (0.2 N NaOH) solution of model compounds listed in Table 2 and solving the linear system of equations:
For each lignin sample, six parallel measurements were made, varying the initial weighted amount of sample in the stock solution and the aliquot of the stock solution taken to prepare the diluted solution. The result of the analysis was presented as a Confidence Limit (CL):
where c
i
(OHTotal) and
2.3.2 31P NMR
31P NMR analysis was used for the quantification of the functional groups in the lignin fractions (Argyropoulous 1994; Granata and Argyropoulos 1995; Tagami et al. 2019). A lignin sample (0.028–0.032 g) was weighed and dissolved in 100 μL of DMF and 100 μL of pyridine. Endo-N-hydroxy-5-norbornene-2,3-dicarboximide (e-HNDI) (Sigma-Aldrich, 40 g L−1) and chromium (III) acetylacetonate (Aldrich, 5 g L−1) were used as an internal standard and relaxation reagent, respectively. In addition, 2-chloro-4,4,5,5-tetramethyl-1,3,2-dioxaphospholane was used as a phosphorylating reagent, and the derivatized sample was dissolved in CDCl3 before analysis. The 31P NMR experiment was performed with a 90° pulse angle, inverse-gated proton decoupling, and a delay time of 10 s. For analysis, 256 scans with a time delay of 5 s were collected for a total runtime of 29 min.
The NMR analysis was performed within 1 h after the sample preparation. The internal standard was prepared the same week as it was used to avoid the process of its degradation.
3 Results and discussion
3.1 Analysis of Δε-IDUS approaches of UV–vis method
The most popular approach of UV–vis spectroscopy method of determination of Ph-OH groups in lignins was used in this work, namely ionization difference spectroscopy (Δε-IDUS, Δε-method according to Goldmann et al. (2017). The Δε-IDUS method is based on the fact that Ph-OH of lignin can absorb electromagnetic radiation in the UV range. On the other hand, they dissociate in an alkaline environment, which causes a shift in the absorption spectrum toward longer wavelengths (Jablonsky et al. 2015). It is well known that the non-phenolic, aliphatic (Lundquist and Parkås 2011) lignin units produce identical UV–vis spectra in the neutral and alkaline solutions (Aulin-Erdtman 1952; Goldschmid 1954; Lin and Dence 1992). Therefore, the difference between the spectra of lignin solutions with the same concentration but different pH, the difference absorption spectrum (Δε-spectrum), represents only the absorbance from the phenolic units that are ionized under the alkaline condition. So, it became the basis for creating a group of methods for UV determination of the Ph-OH content in lignins (Cybulska et al. 2012; Goldmann et al. 2017; Jablonsky et al. 2015; Stark et al. 2016).
Two approaches to obtaining the Δε-spectrum are known in the literature. According to the first (Lin and Dence 1992), absorption spectra of alkaline and neutralized lignin solutions were measured separately. Then the Δε-spectrum was calculated by subtracting the UV–visible spectrum of the sample dissolved in the neutral solution from the comparison in the alkaline solution. The second possibility (Goldschmid 1954) consists of measuring the absorbance of the alkaline solution relative to the neutralized solution, which was placed in the reference cell of the spectrophotometer as a “blank”. In the presented work, the second method was used, as it is less time-consuming.
Although the Δε-IDUS method is notable for its simplicity, rapidity, and cost-effectiveness, positioning it as the most promising candidate for quick phenolic –OH group analysis (Goldmann et al. 2017) without any preliminary treatment, the challenge lies in selecting appropriate solvents, pH level, and wavelengths for characterizing different types of phenolic–OH groups (Chen et al. 2022).
The best solvent should completely dissolve the sample and interfere with the adsorption of lignin in the UV range of wavelengths. In addition, as was shown in (Ruwoldt et al. 2022), the nature of the solvent significantly affects the peak location and amplitude of the Δε-spectra due to the change of Hansen solubility parameters. According to Chen et al. (2022) 2-methoxyethanol/water/acetic acid and 2-methoxyethanol/water was the ideal solvent system for UV–vis determination of Ph-OH in technical lignins. Ruwoldt et al. (2022) suggested that DMSO, ethylene glycol, and a mixture of propylene carbonate or ethanol and water are less hazardous alternatives to traditional lignin solvents in UV–visible spectrometry. In addition, Ruwoldt et al. (2022) showed that the shape of spectra of lignin samples were similar when alkali and neutralized water or 2-methoxyethanol/water solutions were used. Water has a cutoff below 200 nm and is the best solvent for UV measurements. Water is the safest solvent also. Therefore, all studies in the presented work were carried out in aqueous solutions.
According to recommendations (Chen et al. 2022; Goldschmid 1954; Gärtner et al. 1999; Lin and Dence 1992; Ruwoldt et al. 2022; Zakis 1994), solutions with pH 6.0, pH 12, and 0.2 N NaOH were used. Generally accepted Ph-OH groups were non-dissociated at pH 6, mainly dissociated at pH 12, and fully dissociated at 0.2 NaOH.
Initially, the quantification of Ph-OH was based on the difference in absorption at 300 and 380 nm between phenolic units in neutral and alkaline solutions. The content of ionizing phenol hydroxyl groups can be quantitatively evaluated by comparing the values of substances studied at certain wavelengths to the values of the respective model compounds. In the original work by (Zakis et al. 1975; Zakis 1994) all phenolic structures were divided into four groups (I, IIa, III, and IVa types), as shown in Figure 1. So, only α-carbonyl groups were mentioned as a source of conjugation, and the maximum absorbance was measured at 360 nm. In technical lignin samples, the presence of other conjugated structures such as stilbenes (Yamasaki et al. 1981) and enol ethers (Gellerstedt and Lindfors 1987), may be significant, and the maximum absorbance in the 350–370 nm region can be assumed to reflect the content of all types of conjugated structures. So, measurement of the analytical signal and calculation of the total content of phenolic groups was carried out as described in Section 2.3.1 according to equation (4)–(7).
Difference spectra of sample solutions in units of absorption (ΔA) and absorptivity (Δa, equation (2)) are presented in Figure 2.

Difference spectra of sample solutions. (a) In units of absorptivity. (∆a = apH12-apH6) (b) in units of absorptivity. (∆a = a0.2MNaOH-apH6) (c) in units of absorption. (ΔA = A0.2 M NaOH – ApH 6).
There are three groups of peaks in spectra in Figure 2. First group with maxima at wavelengths between 230 and 260 nm. This wavelength range is common for technical lignins and originates from the presence of aromatic rings and non-conjugated phenolic –OH groups in the lignin structure. Second group: The peaks in this group have maxima at wavelengths around 300 nm. The maxima in this range indicate the presence of unconjugated Ph-OH in the lignin samples. Third group: The peaks in this group have maxima at wavelengths between 350 and 380 nm. The presence of maxima in this range indicates the presence of conjugated phenolic –OH groups in the lignin samples. So, the absorbance at this wavelength range can be valuable in identifying and characterizing the chemical structures present in the samples being analyzed. Specifically, the presence of peaks in the second and third ranges (300–360 nm and 350–380 nm, respectively) indicates the occurrence of unconjugated and conjugated phenolic –OH groups in the lignin samples. This spectroscopic data can be useful for understanding the composition and properties of the lignin samples in various applications. The values of the total Ph-OH content calculated from Δε-IDUS 1 – Δε-IDUS 4 methods were demonstrated in Table 3 and Figure 3a.
Results of Ph-OH total content, mmol.g−1, determinations by Δε-IDUS methods.
| Method | Sample | ||||||
|---|---|---|---|---|---|---|---|
| SL | ELA | EL | OSS | OSE | OS | ||
| Δε-IDUS 1 | Average C(OHtotal), mmol.g−1 | 1.72 | 1.84 | 1.27 | 1.66 | 0.95 | 0.24 |
| rsd, % | 21.6 | 22.8 | 15.0 | 18.4 | 24.1 | 95.3 | |
| Δε-IDUS 2 | Average C(OHtotal), mmol.g−1 | 2.85 | 2.78 | 2.82 | 2.60 | 1.49 | 0.95 |
| rsd, % | 9.1 | 13.3 | 13.8 | 15.4 | 22.4 | 54.1 | |
| Δε-IDUS 3 | Average C(OHtotal), mmol.g−1 | 4.28 | 3.72 | 4.45 | 2.31 | 1.36 | 0.67 |
| rsd, % | 4.5 | 7.9 | 7.9 | 9.9 | 11.9 | 28.5 | |
| Δε-IDUS 4 | Average C(OHtotal), mmol.g−1 | 4.34 | 6.08 | 5.22 | 3.46 | 2.38 | 1.41 |
| rsd, % | 4.4 | 4.6 | 4.6 | 5.0 | 5.0 | 4.8 | |
| C(OHtotal)max- C(OHtotal)min, mmol.g−1 | 2.62 | 4.24 | 3.95 | 1.80 | 1.43 | 1.17 | |

Results (a) and relative uncertainty toward the 31P NMR (b) of total Ph-OH content determined by various Δε-IDUS methods.
It can be seen that the calculated amount of Ph-OH differed depending on the method. In particular, the value of the total phenolic content increases by 1–4 mmol g−1 for all samples when moving from method Δε-IDUS 1 to method Δε-IDUS 4. The minimum values of C(OHtotal) were observed in the case of calculations using method Δε-IDUS 1. This can be explained by the fact that Goldschmid (1954) used as the model compounds (Table 2), eugenol and conidendrin, which have a type I structure (Figure 1) according to (Gärtner et al. 1999; Zakis 1994). So, using this approach we will only be able to estimate the content of unconjugated uncondenced Ph-OH groups. Methods Δε-IDUS 2 and Δε-IDUS 3 use model compounds that represent the full spectrum of phenolic OH groups of lignins. It is this fact that ensures an increase in the specified number of OH groups. The increase in the result when going from Δε-IDUS 2 to Δε-IDUS 3 can be explained by a more complete dissociation of C5-substituted OH. The thing is that Lin and Dence (1992) use only one ionization level (pH 12) and describe six possible model structures, of which two types cannot be predicted accurately due to ionization resistance caused by steric hindrance. C5-substituted (or so-called weakly acidic) structures have been assumed by (Goldmann et al. 2017) to be condensed, although this is not always the case. The variation Δε-IDUS 3 utilizes two ionization levels, the first solution being alkaline at pH 12 and the second super-alkaline at 0.20 mol L−1 NaOH. Their approaches differ only conceptually with respect to the model structures. Zakis (1994) describes four structure types of phenolic units based on conjugation (α-carbonyl) and C5-substitution (which resist ionization at pH 12). Gärtner et al. (1999) utilize the same model structures of Zakis et al. (1975) (i.e. do not recalibrate the method) and reinterpret the conjugated structures to include the structures with an α-β double bond. Gärtner (Gärtner et al. 1999) also added a term to the calculation equations which had been missing from the method by Zakis (1994). It is possible, however, that other structures also affect the degree of ionization and the difference in absorption in the two alkaline solutions is therefore preferably interpreted as reflecting the proportion of weakly acidic phenols in general. The proportion of “weakly acidic” phenols can thus be estimated by using the two alkaline solutions. The increase in the calculation result when using Δε-IDUS 4 can be explained by two factors. First, it was the choice of wavelengths for measuring the light absorption of the lignin solution, which corresponded to the characteristic maximum of each model compound: 300 nm for the model I, 320 for II, 370 for III, and 350 for IV). Second, Chen et al. (2022) proposed a mathematical model that accounted for the additional contribution of each type of phenolic group to the total light absorption of the solution.
A second trend that can be seen when analyzing the data in Table 3 is the improvement in precision of determination when going from Δε-IDUS 1 to Δε-IDUS 4. The relative standard deviation (% rsd) was used to express precision (Milne et al. 1992):
where s was calculated according equation (9).
It can be seen that the % rsd in these series decreases from 15–95.3 % for Δε-IDUS 1 to 4.4–5.0 % for Δε-IDUS 4 method. The explanation for the reduction of the indeterminate error lies in the peculiarities of the measurement and mathematical processing of the analytical signal. In particular, all calculations in method Δε-IDUS 1 were based on the maximal absorptivity of the solution at only one wavelength. In addition, its location was not clearly defined. It was only defined as the maximum of a band with a center near 300 nm. Instead, a multi-point wavelength measurement was adopted in Δε-IDUS 4.
In our opinion, the Δε-IDUS 4 model most fully describes the spectrochemical properties of the phenolic groups of lignin. As can be seen from Table 4 method Δε-IDUS 3 was the most time-effective method. Therefore, Δε-IDUS 3 and Δε-IDUS 4 seem to be the most promising for rapid assessment of the total Ph-OH content in lignin in industrial laboratories.
Time required for a single measurement of total Ph-OH.
| Method | Time | ||
|---|---|---|---|
| Preparation of solutions | Measurement | Calculations | |
| Δε-IDUS 1 | 0.5 h 24 ha |
15 min | 10 min |
| Δε-IDUS 2 | 20 min | ||
| Δε-IDUS 3 | 10 min | 10 min | |
| Δε-IDUS 4 | 30 min | ||
-
a- when the sample was partly insoluble in buffer solution with pH 12.
3.2 The reference method of Ph-OH quantification
To control the accuracy of the results of the Ph-OH determination in lignins by the UV–vis method, classical methods of FTIR (Ruwoldt et al. 2022), non-aqueous titration (El Mansouri and Salvado 2007), aminolysis (Gärtner et al. 1999) and 31P NMR (Chen et al. 2022) were used. In our opinion, the last of the listed methods is the best option for use as a referee. The 31P NMR is a powerful tool for the structural elucidation of Ph-OH. This accurate, quantitative, and highly reproducible analytical procedure, which quantifies and differentiates different types of hydroxy, phenolic, and carboxyl groups in lignins, has now become a common analytical tool (Wen et al. 2013). Quantitative 31P NMR makes it possible to reliably identify unsubstituted, o-monosubstituted, and o-dissubstituted phenols (Granata and Argyropoulos 1995), aliphatic –OH, and part of the carboxylic acid in lignins with a wide application potential. At the same time, 31P NMR is not sensitive to impurities that are not active after phosphorylation. It is the most mentioned method (Serrano et al. 2018) for determining phenols in lignins. However, the preparation of the lignin samples is time-consuming, extremely expensive, and needs professional maintenance. Thus, the 31P NMR method cannot quantify the Ph-OH content in lignin quickly, economically, and extensively, but it is widely used as a reference when comparing the results obtained by other methods.
In this study, the results obtained by modified Δε-IDUS methods were compared with ones from 31P NMR.
The 31P NMR spectra of all samples are presented in Figure 4, the results of calculations based on these spectra can be seen in Table 5. As can be seen in Figure 3a, the results of the NMR determination of total phenolic content agree with published data (Gordobil et al. 2016; Tagami et al. 2019). The relative uncertainty of data obtained (rsd, %, calculated according equation (10)) does not exceed 9.5 % for all samples, except for OSE, which was not completely dissolved during the sample preparation process. This fact showed that the NMR method is reliable and the result can be used as a reference for quantitative determination of Ph-OH by UV–vis methods.

31P-NMR spectra of lignin samples. Condensed OH include syringyl and 5-substituted Ph-OH.
Comparison of results of Ph-OH total content, mmol.g−1, determinations. by Δε-IDUS and 31P-NMR methods
| Tested Method (n = 6, P = 0.95) | 31P-NMR Method this work (n = 3, P = 0.95) | |||||
|---|---|---|---|---|---|---|
| Δε-IDUS 1 (Goldschmid 1954) | Δε-IDUS 2 (Lin and Dence 1992) | Δε-IDUS 3 (Gärtner et al.1999) | Δε-IDUS 4 (Chen et al.2022, Ruwoldt et al. 2022) | Average | rsd, % | |
| SL | 1.72 ± 0.39 | 2.85 ± 0.27 | 4.28 ± 0.20 | 4.34 ± 0.20 | 4.1 | 1.2 |
| ELA | 1.84 ± 0.44 | 2.78 ± 0.39 | 3.72 ± 0.21 | 6.08 ± 0.29 | 4.5 | 1.1 |
| EL | 1.27 ± 0.20 | 2.82 ± 0.41 | 4.45 ± 0.37 | 5.22 ± 0.25 | 4.3 | 2.3 |
| OSS | 1.66 ± 0.32 | 2.60 ± 0.42 | 2.31 ± 0.24 | 3.46 ± 0.18 | 3.2 | 9.3 |
| OSE | 0.95 ± 0.24 | 1.49 ± 0.35 | 1.36 ± 0.17 | 2.38 ± 0.12 | 2.6 | 32.7 |
| OS | 0.24 ± 0.24 | 0.95 ± 0.54 | 0.67 ± 0.20 | 1.41 ± 0.07 | 1.3 | 7.7 |
3.3 Comparison of 31P NMR and Δε-IDUS methods
It can be observed that the types of phenolic–OH groups, as determined by 31P NMR (Figure 5) and UV–vis methods (Figure 1), are different. As a result, we can compare only the total quantity of phenolic –OH groups. The main criteria for comparing was the quality of the obtained results (the coincidence of the amount of Ph-OH determined by variety Δε-IDUS and 31P NMR methods). The relative error (RE) parameter was used in the presented work to express the accuracy of the results obtained. RE was calculated as:
Where

Types of phenolic structures determined by the 31P-NMR method.
In the presented work, a relative error of ± 10 % was considered an acceptable deviation of the tested method. A deviation of ≤10 % was considered to be sufficient to recommend the method for further use.
One can see in Figure 3b that the Δε-IDUS 1 and Δε-IDUS 2 methods gave significantly lower (compared to the 31P NMR result) values of the Ph-OH content. Such a tendency in case Δε-IDUS 1 can be explained by a natural limitation of the applied model. In particular, Goldschmid (1954) calculated the content of Ph-OH using equations based on only non-conjugated phenolic groups. The main reason for underestimated results in the case of the Δε-IDUS 2 method is the incomplete dissociation of phenolic hydroxides when using an alkaline buffer solution with a pH of 12 (Gärtner et al. 1999; Goldmann et al. 2017). Also, some authors assumed (Zakis 1994) that phenolic groups are partially ionizied in the neutral solvent (when lignin is dissolved in a buffer with pH 6). However, subsequent studies and our observations did not confirm this fact.
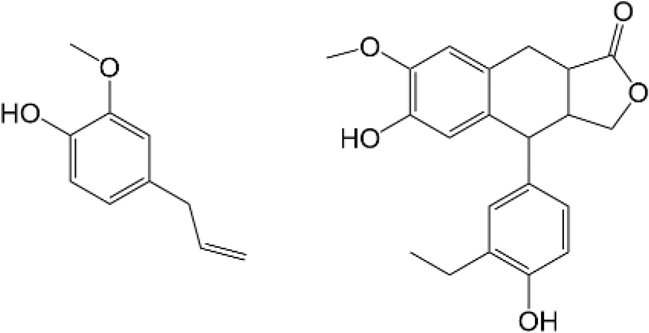
The extractive approach used for isolation dramatically affects the structure of the resulting lignin (Adler 1957). Argyropoulos et al. (2021) show two lignin structures that differ in the isolation approach used (see Figure 6). Some considerations regarding the impact of the extraction method could be highlighted. First, kraft lignin is an alkylated, highly fragmented, and condensed lignin, while organosolv lignin has a structure similar to ground wood lignin (isolated using the Björkman approach) (Björkman 1956, 1957a, 1957b). Accordingly, the nature of phenolic hydroxyl groups is also different.

Representative structures for technical lignins (Argyropoulos et al. 2021), kraft (a) and organosolv (b).
UV–vis-spectroscopy determines only some phenolic structures, so the phenolic groups might be underestimated. The equations used in the calculations are based on molar extinction values of model compounds representing typical phenolic structures present in lignin (Table 2). It is not therefore recommended to use the UV–vis method on highly modified lignins, oxlignin particularly, or lignins of very exotic origin since these may contain structures that have not been included in the model.
Results presented in Table 5 and Figure 3b show a good correlation between the modified Δε-IDUS 3 with two alkali solutions and the 31P NMR method for EL, ELA, SL, and OS samples. When using the Δε-IDUS 3 method, a significant deviation of the results is observed only for samples of organosolv lignins (OSS and OSE). The most probable reason is that the reference compounds chosen for this model do not correspond to the peculiarities of the structure of organosoluble lignins. The deterioration of the analysis result in the case of organosolve eucalyptus lignin (OSE) can be additionally influenced by its incomplete solubility in NaOH solution with pH 12.
The Δε-IDUS 4 method gives the best results (see Table 5) for the determination of total Ph-OH in spruce lignin samples (OS, OSS, and SL). As it is known (Ragauskas et al. 2014), the lignin of softwood, especially spruce, consists mainly of G units. In contrast, eucalyptus hardwood contains a significant proportion of S units. Large errors in the results of the analysis of eucalyptus lignins were expected. These are obviously explained by the natural limitation of the method, which was developed specifically for the quantification of guaiacyl-type Ph-OH.
Considering the satisfactory accuracy, the absence of complex preliminary sample preparation and environmental friendliness modified Δε-IDUS 3 and Δε-IDUS 4 could be recommended for rapid evaluation of total phenolic hydroxyl structures in common types of technical lignins and in lignins originated from softwood, respectively.
4 Conclusions
Technical lignin, a natural polymer, exhibits significant variability in the quantity and quality of its phenolic hydroxyl (Ph-OH) groups depending on factors such as plant species, cultivation, growth conditions, and isolation methods. This variability poses challenges in developing a universal and straightforward method for evaluating Ph-OH in lignins. The ultraviolet ionization difference spectrophotometry (Δε-IDUS) emerges as a rapid, simple, and cost-effective technique for estimating total Ph-OH groups in lignins. This study explored four modifications of the Δε-IDUS method, proposing a more ecological approach by completely excluding organic solvents. The effectiveness of this new approach was validated through good agreement with results obtained from 31P NMR analysis.
Six lignin samples from different origins (spruce and eucalyptus) and isolation processes (Kraft, organosolv, and oxy) were analyzed using this new Δε-IDUS approach. The results confirmed that optimal ionization of Ph-OH in lignins occurs in a superalkaline solution of 0.2 M NaOH. Despite its natural limitations, this method provides competitive data for determining total Ph-OH content in common types of technical lignins. Additionally, the Δε-IDUS method which employs multi-point wavelength measurement, was verified as the most efficient for calculations of guaiacyl-type Ph-OH groups. This method effectively analyzes softwood lignins regardless of the extraction method. Therefore, this paper proposes these two modified Δε-IDUS methods as eco-friendly, rapid, and cost-effective UV–vis methods for evaluating total Ph-OH, making them suitable for extensive application in industrial laboratories.
Acknowledgments
NS, GH and OS acknowledge funding from the Knut and Alice Wallenberg Foundation (KAW) through the Wallenberg Wood Science Center. JS acknowledges funding from the industrial graduate school Resource-smart Processes, which was obtained through participation by industry, academia, and Vinnova in the strategic innovation program BioInnovation.
-
Research ethics: Not applicable.
-
Author contributions: The authors have accepted responsibility for the entire content of this manuscript and approved its submission.
-
Competing interests: The authors state no conflict of interest.
-
Research funding: Knut and Alice Wallenberg Foundation (KAW 2022.0216), Vinnova 2021–02087.
-
Data availability: The data can be obtained on request from the corresponding author.
References
Adler, E. (1957). Structural elements of lignin. Ind. Eng. Chem. 49: 1377–1383, https://doi.org/10.1021/ie50573a031.Search in Google Scholar
Aminzadeh, S., Lauberts, M., Dobele, G., Ponomarenko, J., Mattsson, T., Lindström, M.E., and Sevastyanova, O. (2017). Membrane filtration of kraft lignin: structural properties and anti-oxidant activity of the low-molecular-weight fraction. Ind. Crops Prod. 112: 200–209, https://doi.org/10.1016/j.indcrop.2017.11.042.Search in Google Scholar
Argyropoulos, D.S., Pajer, N., and Crestini, C. (2021). Quantitative 31P NMR analysis of lignins and tannins. J. Vis. Exp. 174, https://doi.org/10.3791/62696.Search in Google Scholar PubMed
Argyropoulous, D.S. (1994). Quantitative phosphorus-31 NMR analysis of lignins, a new tool for the lignin chemist. J. Wood Chem. Technol. 14: 45–63, https://doi.org/10.1080/02773819408003085.Search in Google Scholar
Aro, T. and Fatehi, P. (2017). Production and application of lignosulfonates and sulfonated lignin. ChemSusChem 10: 1861–1877, https://doi.org/10.1002/cssc.201700082.Search in Google Scholar PubMed
Aulin-Erdtman, G. (1952). Spectrographic contributions to lignin chemistry. II. Preliminary report. Sven. Papperstidn. 55: 745–749.Search in Google Scholar
Biermann, C.J. (1993). Essentials of pulping and papermaking. Academic Press, Great Britain.Search in Google Scholar
Björkman, A. (1956). Studies on finely divided wood. Part 1. Extraction of lignin with neutral solvents. Sven. Papperstidn. 59: 477–85.Search in Google Scholar
Björkman, A. (1957a). Studies on finely divided wood. Part 3. Extraction of lignin-carbohydrate complexes with neutral solvents. Sven. Papperstidn. 60: 243–51.Search in Google Scholar
Björkman, A. (1957b). Studied on finely divided wood. Part 5. The effect of milling. Sven. Papperstidn. 60: 329–335.Search in Google Scholar
Boerjan, W., Ralph, J., and Baucher, M. (2003). Lignin biosynthesis. Annu. Rev. Plant Biol. 54: 519–546, https://doi.org/10.1146/annurev.arplant.54.031902.134938.Search in Google Scholar PubMed
Chen, L., Wei, X., Wang, H., Yao, M., Zhang, L., Gellerstedt, G., Lindström, M.E., Ek, M., Wang, Sh., and Min, D. (2022). A modified ionization difference UV–vis method for fast quantitation of guaiacyl-type phenolic hydroxyl groups in lignin. Int. J. Biol. Macromol. 201: 330–337, https://doi.org/10.1016/j.ijbiomac.2022.01.035.Search in Google Scholar PubMed
Constant, S., Wienk, H.L., Frissen, A.E., de Peinder, P., Boelens, R., Van Es, D.S., Grisel, R.J., Weckhuysen, B.M., Huijgen, W.J., Gosselink, R.J., et al.. (2016). New insights into the structure and composition of technical lignins: a comparative characterization study. Green Chem. 18: 2651–2665, https://doi.org/10.1039/c5gc03043a.Search in Google Scholar
Cybulska, I., Brudecki, G., Rosentrater, K., Julson, J.L., and Lei, H. (2012). Comparative study of organosolv lignin extracted from prairie cordgrass, switchgrass and corn stover. Bioresour. Technol. 118: 30–36, https://doi.org/10.1016/j.biortech.2012.05.073.Search in Google Scholar PubMed
De Sousa, F., Reimann, A., Björklund, M., Nivelbrant, J., and Nivelbrant, N.O. (2001). Proceedings of 11th ISWPC international symposium on wood and pulping chemistry. Nice, FR. Saint Martin d’Heres.Search in Google Scholar
Dence, C.W. (1992) The determination of lignin. In: Lin, S.Y. (Ed.). Methods in lignin chemistry. Springer-Verlag, Berlin, pp. 33–61.10.1007/978-3-642-74065-7_3Search in Google Scholar
Diment, D., Tkachenko, O., Schlee, Ph., Kohlhuber, N., Potthast, A., Budnyak, T.M., Rigo, D., and Balakshin, M. (2024). Study toward a more reliable approach to elucidate the lignin structure–property–performance correlation. Biomacromolecules 25: 200–212, https://doi.org/10.1021/acs.biomac.3c00906.Search in Google Scholar PubMed PubMed Central
Dizhbite, T., Telysheva, G., Jurkjane, V., and Viesturs, U. (2004). Characterization of the radical scavenging activity of lignins–natural antioxidants. Bioresour.Technol. 95: 309–317, https://doi.org/10.1016/j.biortech.2004.02.024.Search in Google Scholar PubMed
Dos Santos, P.S.B., de Cademartori, P.G., Prado, R., Gatto, D.A., and Labidi, J. (2014). Composition and structure of organosolv lignins from four eucalypt species. Wood Sci. Technol. 48: 873–885, https://doi.org/10.1007/s00226-014-0646-z.Search in Google Scholar
Duan, X., Wang, X., Chen, J., Liu, G., and Liu, Y. (2022). Structural properties and antioxidation activities of lignin isolated from sequential two-step formosolv fractions. RSC Adv. 12: 24242–24251, https://doi.org/10.1039/d2ra02085h.Search in Google Scholar PubMed PubMed Central
Duval, A., Vilaplana, F., Crestini, C., and Lawoko, M. (2016). Solvent screening for the fractionation of industrial kraft lignin. Holzforschung 70: 11–20, https://doi.org/10.1515/hf-2014-0346.Search in Google Scholar
El Mansouri, N.-E. and Salvado, J. (2007). Analytical methods for determining functional groups in various technical lignins. Ind. Crops Prod. 26: 116–124, https://doi.org/10.1016/j.indcrop.2007.02.006.Search in Google Scholar
Folin, O. and Looney, J.M. (1922). Colorimetric methods for the separate determination of tyrosine, tryptophane, and cystine in proteins. JBC 57: 421–437, https://doi.org/10.1016/s0021-9258(18)85884-7.Search in Google Scholar
Folin, O. and Ciocalteu, V. (1927). On tyrosine and triptophone determinations in proteins. JBC 73: 627–650, https://doi.org/10.1016/S0021-9258(18)84277-6.Search in Google Scholar
Folin, O. and Denis, W. (1912). On phosphotungstic-phosphomolybdic compounds as color reagents. JBC 12: 239–243, https://doi.org/10.1016/S0021-9258(18)88697-5.Search in Google Scholar
Gärtner, A., Gellerstedt, G., and Tamminen, T. (1999). Determination of phenolic hydroxyl groups in residual lignin using a modified UV-method. Nord. Pulp Pap. Res. J. 14: 163–170, https://doi.org/10.3183/NPPRJ-1999-14-02-p163-170.Search in Google Scholar
Gellerstedt, G. and Lindfors, E.-L. (1987). On the formation of enol ether structures in lignin during kraft cooking. Nord. Pulp Pap. Res. J. 2: 71–75, https://doi.org/10.3183/npprj-1987-02-02-p071-075.Search in Google Scholar
Giummarella, N., Lindgren, C., Lindström, M., and Henriksson, G. (2016). Lignin prepared by ultrafiltration of black liquor: investigation of solubility, viscosity, and ash content. BioResources 11: 3494–3510, https://doi.org/10.15376/biores.11.2.3494-3510.Search in Google Scholar
Giummarella, N., Pu, Y., Ragauskas, A.J., and Lawoko, M. (2019). A critical review on the analysis of lignin carbohydrate bonds. Green Chem. 21: 1573–1595, https://doi.org/10.1039/c8gc03606c.Search in Google Scholar
Goldmann, W.M., Ahola, J., Mankinen, O., Kantola, A.M., Komulainen, S., Telkki, V.-V., and Tanskanen, J. (2017). Determination of phenolic hydroxyl groups in technical lignins by ionization difference ultraviolet spectrophotometry (Δε-IDUS method). Period. Polytech. Chem. Eng. 61: 93–101, https://doi.org/10.3311/PPch.9269.Search in Google Scholar
Goldschmid, O. (1954). Determination of phenolic hydroxyl content of lignin preparations by ultraviolet spectrophotometry. Anal. Chem. 26: 1421–1423, https://doi.org/10.1021/ac60093a009.Search in Google Scholar
Gordobil, O., Moriana, R., Zhang, L., and Sevastyanova, O. (2016). Assesment of technical lignins for uses in biofuels and biomaterials: structure-related properties, proximate analysis and chemical modification. Ind. Crops Prod. 83: 155–165, https://doi.org/10.1016/j.indcrop.2015.12.048.Search in Google Scholar
Gosselink, R., van Dam, J., de Jong, E., Scott, E., Sanders, J., Li, J., and Gellerstedt, G. (2010). Fractionation, analysis, and PCA modeling of properties of four technical lignins for prediction of their application potential in binders. Holzforschund 64: 193–200, https://doi.org/10.1515/HF.2010.023.Search in Google Scholar
Granata, A. and Argyropoulos, D.S. (1995). 2-Chloro-4,4,5,5-Tetramethyl-1,3,2-Dioxaphospholane, a reagent for the accurate determination of the uncondensed and condensed phenolic moieties in lignins. J. Agric. Food Chem. 43: 1538–1544, https://doi.org/10.1021/jf00054a023.Search in Google Scholar
Hatakeyama, H. and Hatakeyama, T. (2009) Lignin structure, properties, and applications. In: Abe, A., Dusek, K., and Kobayashi, S. (Eds.). Biopolymers: lignin, proteins, bioactive nanocomposites. Springer, Berlin, Heidelberg, pp. 1–63.10.1007/12_2009_12Search in Google Scholar
Heitner, C., Dimmel, D., and Schmidt, J. (Eds.) (2010). Lignin and lignans. Advances in chemistry. CRC Press, Boca Raton.Search in Google Scholar
Henriksson, G. (2017). What are the biological functions of lignin and its complexation with carbohydrates? Nord. Pulp Pap. Res. J. 32: 527–541, https://doi.org/10.3183/NPPRJ-2017-32-04-p527-541.Search in Google Scholar
Jablonsky, M., Kocis, J., Haz, A., and Sima, J. (2015). Characterization and comparison by UV spectroscopy of precipitated lignins and commercial lignosulfonate. Cellul. Chem. Technol. 49: 267–274.Search in Google Scholar
Kazzaz, A.E. and Fatehi, P. (2020). Technical lignin and its potential modification routes: a mini-review. Ind. Crops Prod. 154, https://doi.org/10.1016/j.indcrop.2020.112732.Search in Google Scholar
Korntner, Ph., Sumerskii, I., Bacher, M., Rosenau, T., and Potthast, A. (2015). Characterization of technical lignins by NMR spectroscopy: optimization of functional group analysis by 31P NMR spectroscopy. Holzforschung 69: 807–814, https://doi.org/10.1515/hf-2014-0281.Search in Google Scholar
Lauberts, M., Sevastyanova, O., Ponomarenko, J., Dizhbite, T., Dobele, G., Volperts, A., Lauberte, L., and Telysheva, G. (2017). Fractionation of technical lignin with ionic liquids as a method for improving purity and antioxidant activity. Ind. Crops Prod. 95: 512–520, https://doi.org/10.1016/j.indcrop.2016.11.004.Search in Google Scholar
Lawoko, M. and Samec, J.S. (2022). Kraft lignin valorization: biofuels and thermoset materials in focus. Curr. Opin. Green Sustain. Chem. 40, https://doi.org/10.1016/j.cogsc.2022.100738.Search in Google Scholar
Lin, S.Y., and Dence, C.W. (Eds.) (1992). Methods in lignin chemistry. Springer Verlag, Berlin, Heidelberg.10.1007/978-3-642-74065-7Search in Google Scholar
Lundquist, K. and Parkås, J. (2011). Different types of phenolic units in lignins. BioRes 6: 920–926, https://doi.org/10.15376/biores.6.2.920-926.Search in Google Scholar
Meng, X., Crestini, C., Ben, H., Hao, N., Pu, Y., Ragauskas, A.J., and Argyropoulos, D.S. (2019). Determination of hydroxyl groups in biorefinery resources via quantitative 31P NMR spectroscopy. Nat. Protoc. 14: 2627–2647, https://doi.org/10.1038/s41596-019-0191-1.Search in Google Scholar PubMed
Milne, T.A., Chum, H.L., Agblevor, F., and Johnson, D.K. (1992). Standardized analytical methods. Biomass Bioenergy 2: 341–366, https://doi.org/10.1016/0961-9534(92)90109-4.Search in Google Scholar
Pan, X., Arato, C., Gilkes, N., Gregg, D., Mabee, W., Pye, K., Xiao, Z., Zhang, X., and Saddler, J. (2005). Biorefining of Softwood using ethanol organosolv pulping: preliminary evaluation of process streams for manufacture of fuel-grade ethanol and co-products. Biotechnol. Bioeng. 90: 473–481, https://doi.org/10.1002/bit.20453.Search in Google Scholar PubMed
Puziy, A.M., Poddubnaya, O.I., and Sevastyanova, O. (2020) Carbon materials from technical lignins: recent advances. In: Serrano, L., Luque, R., and Sels, B. (Eds.). Lignin chemistry. Topics in current chemistry collections. Springer, Cham, pp. 95–128.10.1007/978-3-030-00590-0_5Search in Google Scholar
Pylypchuk, I.V., Suo, H., Chucheepchuenkamol, Ch., Jedicke, N., Lindén, P.A., Lindström, M.A., Manns, M.P., Sevastyanova, O., and Yevsa, T. (2022). High-molecular-weight fractions of spruce and Eucalyptus lignin as a perspective nanoparticle-based platform for a therapy delivery in liver cancer. Front. Bioeng. Biotechnol. 9, https://doi.org/10.3389/fbioe.2021.817768.Search in Google Scholar PubMed PubMed Central
Ragauskas, A.J., Beckham, G.T., Biddy, M.J., Chandra, R., Chen, F., Davis, M.F., Davison, B.H., Dixon, R.A., Gilna, P., Keller, M., et al.. (2014). Lignin valorization: improving lignin processing in the biorefinery. Science 344: 1–10, https://doi.org/10.1126/science.1246843.Search in Google Scholar PubMed
Ruwoldt, J., Tanase-Opedal, M., and Syverud, K. (2022). Ultraviolet spectrophotometry of lignin revisited: exploring solvents with low harmfulness, lignin purity, hansen solubility parameter, and determination of phenolic hydroxyl groups. ACS Omega 7: 46371–46383, https://doi.org/10.1021/acsomega.2c04982.Search in Google Scholar PubMed PubMed Central
Serrano, L., Esakkimuthu, E.S., Marlin, N., Brochier-Salon, M.-Ch., Mortha, G., and Bertaud, F. (2018). Fast, easy, and economical quantification of lignin phenolic hydroxyl groups: comparison with classical techniques. Energy Fuels 32: 5969–5977, https://doi.org/10.1021/acs.energyfuels.8b00383.Search in Google Scholar
Sjöström, E. (1993). Wood chemistry. In: Fundamentals and applications, 2nd ed. Academic Press Inc, San Diego.Search in Google Scholar
Sjöström, J., Brandt, L., Henriksson, G., and Sevastyanova, O. (2023). Proceedings of the twenty-first international Symposium on wood, Fiber and pulp chemistry. Ca’ Foscari University of Venice, Venice.Search in Google Scholar
Stark, N.M., Yelle, D.J., and Agarwal, U.P. (2016) Techniques for characterizing lignin. In: Faruk, O., and Sain, M. (Eds.). Lignin in polymer composites. Elsevier Inc, pp. 49–66.10.1016/B978-0-323-35565-0.00004-7Search in Google Scholar
Svärd, A., Sevastyanova, O., Dobele, G., Jurkjane, V., and Brännvall, E. (2016). COST Action FP1105: effect of raw materials and pulping conditions on the characteristics of dissolved kraft lignins. Holzforschung 7: 1105–1114, https://doi.org/10.1515/hf-2016-0057.Search in Google Scholar
Tagami, A., Giola, C., Lauberts, M., Budnyak, T., Moriana, R., Lindström, M.E., and Sevastyanova, O. (2019). Solvent fractionation of softwood and hardwood kraft lignins for more efficient uses: compositional, structural, thermal, antioxidant and adsorption properties. Ind. Crops Prod. 129: 123–134, https://doi.org/10.1016/j.indcrop.2018.11.067.Search in Google Scholar
Tomani, P. (2010). The lignoboost process. Cellul. Chem. Technol. 44: 53–58.Search in Google Scholar
Vallejos, M.E., Felissia, F.E., Curvelo, A.A.S., Zambon, M.D., Ramos, L., and Area, M.C. (2011). Chemical and physico-chemical characterization of lignins obtained from ethanol-water fraction of bagasse. BioResources 6: 1158–1171, https://doi.org/10.15376/biores.6.2.1158-1171.Search in Google Scholar
Vikman, M., Fearon, O., and Kalliola, A. (2022). Biodegradation of alkali-O2 oxidized lignins used as dispersants. BioResources 17: 6079–6093, https://doi.org/10.15376/biores.17.4.6079-6093.Search in Google Scholar
Wen, J.L., Sun, S.L., Xue, B.L., and Sun, R.C. (2013). Recent advances in characterization of lignin polymer by solution-state nuclear magnetic resonance (NMR) methodology. Materials (Basel) 6: 359–391, https://doi.org/10.3390/ma6010359.Search in Google Scholar PubMed PubMed Central
Yamasaki, T., Hosoya, S., Chen, C.-L., Gtratzl, J., and Chang, H.-M. (1981). Proceedings of the ekman-days, int. Symp. Wood pulping chem. SPCI, Stockholm.Search in Google Scholar
Yang, J.-M., Yean, W.Q., and Goring, D.A.I. (1981). The phenolic hydroxyl content of the lignin residual in spruce wood cooked by sulphite and kraft. Cell. Chem. Technol. 15: 337–342.Search in Google Scholar
Yao, L., Xiong, L., Yoo, C.G., Dong, Ch., Meng, X., Dai, J., Ragauskas, A.J., Yang, Ch., Yu, J., Yang, H., et al.. (2020). Correlations of the physicochemical properties of organosolv lignins from Broussonetia papyrifera with their antioxidant activities. Sustain. Energy Fuels 4: 5114–5119, https://doi.org/10.1039/D0SE00940G.Search in Google Scholar
Zakis, G.F. (1994). Functional analysis of lignins and their derivatives. TAPPI Press, Atlanta Ga.Search in Google Scholar
Zakis, G.F., Mozheiko, L.N., and Telysheva, G.M. (1975). Methods for determining functional Groups of lignin. Zinatne, Riga [in Russian].Search in Google Scholar
Zhu, H., Luo, W., Ciesielski, P.N., Fang, Z., Zhu, J.Y., Henriksson, G., Himmel, M.E., and Hu, L. (2016). Wood-derived materials for green electronics, biological devices, and energy applications. Chem. Rev. 116: 9305–9374, https://doi.org/10.1021/acs.chemrev.6b00225.Search in Google Scholar PubMed
© 2024 the author(s), published by De Gruyter, Berlin/Boston
This work is licensed under the Creative Commons Attribution 4.0 International License.
Articles in the same Issue
- Frontmatter
- Chemical Pulping
- Evaluation of oxygen delignified fibers with high water absorbency, as a greener alternative to fully bleached fibers for tissue paper
- Effects of partial lignin extraction on rheological characteristics and combustion performance of high solids bamboo kraft black liquor
- A preliminary investigation of banana pseudo-stem (Musa cavendish) for pulp and paper production: morphology, chemical composition, FTIR, XRD and thermogravimetric analysis
- Sodium carbonate pulping of oil palm empty fruit bunches for paperboard production
- Mechanical Pulping
- Development of fibre properties in mill scale: high- and low consistency refining of thermomechanical pulp (part 2) – Importance of fibre curl
- Paper Technology
- Multi-objective optimization design of a circular core paper sandwich panel
- Paper Physics
- Effects of xylan-modified precipitated calcium carbonate filler on the properties of paper
- Influence mechanism of paper mechanical properties: numerical simulation and experimental verification based on a fiber network
- Enhancing the strength of tissue paper through pulp fractionation and stratified forming
- Paper Chemistry
- Effects of surfactants on the wettability of sodium propionate aqueous deacidification agent
- Coating
- Biobased nanocomposite coating of paper for packaging
- Printing
- Improving the lightfastness of paperboard prints with pearlescent pigments
- Packaging
- Preparation of environmentally friendly hydrophobic paper by coating method
- Recycling
- Hybrid solar drying of sludge from kraft pulp mills
- Chemical Technology/Modifications
- Effect of pre-hydrolysis on the dissolution of hardwood pulp in double salt ionic liquid
- Lignin
- Comparison of three different industrial lignin-based porous carbon electrodes for electrochemical applications
- UV–vis spectroscopy as a rapid method for evaluation of total phenolic hydroxyl structures in lignin
- Miscellaneous
- Paper fingerprint by forming fabric: analysis of periodic marks with 2D lab formation sensor and machine learning for forensic paper-identification