Teaching Spatial Data Analysis: A Case Study with Recommendations
-

 und
und

Abstract
Learning from data is a valuable skill for nonprofit professionals and researchers. Often, data have a spatial component, and data relevant to the nonprofit sector are no exception. Understanding spatial aspects of the nonprofit sector may provide immense value to social entrepreneurs, funders, and policy makers, by guiding programmatic decisions, facilitating resource allocation, and development policy. As a result, spatial thinking has become an essential component of critical thinking and decision making among nonprofit professionals. The goal of this case study is to support and encourage instruction of spatial data analysis and spatial thinking in nonprofit studies. The case study presents a local nonprofit data set, along with open data and code, to assist the instructors teaching spatial aspects of the nonprofit sector. Pedagogical approaches are discussed.
1 Introduction
Data are an increasingly important component of nonprofit operations, as managers and other organizational members regularly employ a range of data in an effort to evaluate or improve programs, communicate with stakeholders and donors, and satisfy accountability concerns (Mayer and Fischer 2023). Educational programs focused on nonprofit management have taken note of this emphasis; a search of existing course offerings in the Seton Hall University database, which provides a census of nonprofit management courses, revealed 10 courses at 10 different universities focused on working with data (Mirabella 2022). Importantly, data increasingly have a spatial component which can provide crucial context and assist in decision making (Huang and Wang 2020). Consistent with repeated calls of nonprofit scholars for increased attention to spatial aspects of the nonprofit sector (MacIndoe and Oakley 2022; Mayer 2023c; Never 2011; Never and Westberg 2016) as well as in organizational studies more broadly (van Wissen 2004), this paper presents a teaching case study for spatial data analysis in nonprofit studies. The paper includes data and code instructors may use in their courses, aimed at enhancing instruction related to spatial data analysis and spatial reasoning in nonprofit studies. While we anticipate the case study to most useful to graduate students, it may well be applicable to any course on data analysis.
2 The Importance of a Spatial Perspective
Nonprofit organizations often provide benefits to those in proximity to their service locations. These benefits may be part of services associated with the mission of the organization, or auxiliary benefits, such as employment, improved communication and goal alignment, or good will (Haslam, Nesbit, and Christensen 2019; Marwell 2004; McQuarrie and Marwell 2009). The local benefits nonprofit organizations provide have resulted in a pragmatic emphasis on their spatial arrangement (Joassart-Marcelli and Wolch 2003; Yan, Guo, and Paarlberg 2014). This has led to consideration of metrics such as the concentration of nonprofits in counts and as a per capita measure. However, the spatial distribution of nonprofits is of theoretical interest as well, providing opportunities to test a range of theories (Carroll and Hannan 2000). Yet, MacIndoe, and Oakley (2022) suggest spatial dynamics of the nonprofit sector remain understudied and provide a number of example questions that require spatial thinking and spatial data analysis. Among others, these questions relate to the changing spatial dynamics over time, the relationship between nonprofit location and volunteer access, and the clustering of nonprofits in neighborhoods. Spatial analysis may take many forms including analysis of accessibility or measures of distance, analysis of points over space (point-reference), however, this case study focuses on the analysis of areal data, which consists of a finite set of bounded regions with measurements aggregated at the regions, as these data have been most valuable to researchers (Never and Westberg 2016; Wo 2018; Yan, Guo, and Paarlberg 2014).
Incorporating data into decision making and planning processes is increasingly important in management activities in nonprofit organizations (Mayer and Fischer 2023). Never (2011) argued that maps are an essential tool for understanding the nonprofit sector and can help with identifying service gaps. Nonprofit professionals, including foundations, have taken note of these needs and over the past decade several initiatives have responded to the need for integrating spatial information (see Roudebush, Fischer, and Brudney 2013). For example, in 2010 the Urban Institute’s National Center for Charitable Statistics procured a grant to create a “Community Data Platform,” a data tool with the purpose of facilitating the use of local information with a spatial dimension (e.g. through geographic information systems, GIS) by nonprofit organizations. Brudney, Russell, and Fischer (2016) interviewed key nonprofit stakeholders that used this GIS platform and found the organizations procured the local information to understand their community, seek collaboration, support programming, and obtain funding. In their study of spatial data use among UK nonprofits, Bowles (2021) finds environmental nonprofits often make use of spatial data, including aerial imagery of habitat conditions, while other nonprofits are often interested in the distribution of service delivery, and grant making organizations are may be interested in the spatial distribution of their grant beneficiaries. Although highly valued by nonprofits, these initiatives often fail to persist as the implementation may lack community engagement or the nonprofits may lack the technical ability or financing to fully embrace the sustained use of the technology (Brudney, Russell, and Fischer 2016; Mayer and Fischer 2023).
Spatial information has the potential to provide substantial value to nonprofit professionals, including managers, and they may also alter the conclusions for policy makers, philanthropists, and managers (MacIndoe and Oakley 2022; Never and Westberg 2016). Yet our search revealed few case studies and materials available for instructors in nonprofit studies to illustrate the importance of spatial thinking. In the next section, this paper presents a case study, with open data and code, intended to be used to illustrate the advantages of entering a spatial dimension into nonprofit studies. For this case study, the key learning objectives include understanding the value of a spatial perspective, understanding the creation maps, and learning to identify spatial correlation and clustering.
3 Case Study
The case study in this article is computational in nature with the purpose of facilitating the teaching of spatial thinking to nonprofit professionals. Accordingly, the accompanying code can be found in the Supplementary Materials. It is recommended that readers download the associated zip file from the repository, which can be used to reproduce the analyses and figures in this paper, as well as facilitate or enhance instruction. Although the data found in the repository is in a general format (e.g. csv), the associated code is written in R (R Core team 2020), an open-source language that is compatible with a range of existing analysis platforms. R is a dialect of the S language developed in Bell Laboratories in the 1970s and is supported by the R foundation, a nonprofit established to provide support for the R project. R is one of several open-source programming languages that have become highly valued by employers across sectors. The flexibility of R allows our spatial case study to fit within a broader agenda focused on data analysis, which may be delivered in R. While R is a programming language and students may have higher anxiety when first introduced, that anxiety often dissipates after instruction (Rode and Ringel 2019). R is unique as it is primarily used by non-programmers, and recent developments following human-centered design principles have enhanced its learning curve for those beginning in programming and data analysis (Wickham et al. 2019).
The case study focuses on the spatial arrangement of the nonprofit sector, by census tract, in Cuyahoga County Ohio (USA) in 2016. The census tract is an apt choice of geography, as it is a widely used proxy for neighborhood and corresponds to theories related to the local benefits of nonprofit organizations, such as their capacity to improve nearby conditions, enhance collective efficacy, and solve collective action problems (Brandtner and Dunning 2020; Crubaugh 2020; Mayer 2023a, 2023b). Further, while spatial dynamics may be at play in a range of situations, accounting for them is often most important with smaller, clustered units (Dale 2014).
Cuyahoga County is just over 1200 square miles in land mass with a population over 1.2 million. Cuyahoga County is also an interesting location for a study of the nonprofit sector as it maintains a rich philanthropic history, it is home to some of the oldest community foundations and federated organizations, including the Cleveland Foundation (founded in 1914) and the United Way of Greater Cleveland (founded in 1913 as the nation’s first Community Chest), and consequently has previously received scholarly attention in this journal (Roudebush and Brudney 2012). Cuyahoga County’s nonprofit sector regularly ranks the largest among Ohio counties in terms of total organizations, revenue, and assets. In 2016, Cuyahoga County accounted for 13.5 percent of the Ohio’s nonprofits, 28.9 percent of the state’s nonprofit revenue, which account for just over 4 percent of the state’s GDP. Nationally, Cuyahoga ranked 35th in nonprofits per capita among those with at least 1000 residents. Cuyahoga County also contains the city of Cleveland, which although often considered to be among the poorest large cities in the country (Campbell 2020), is also home to a robust nonprofit presence, ranking third among Ohio cities (behind Columbus and Cincinnati).
This case study focuses on two measures of the size of the nonprofit sector: density and mass. Consistent with the extant literature, density is defined as the number of active nonprofits in the census tract (Carroll and Hannan 2000; Wo 2018). Yet, density presents a single dimension of the nonprofit sector; it is not a direct measure of activity and neglects the variable size of organizations (Amburgey 1996; Carroll and Hannan 2000). Responding to this, several scholars have considered alternative measures that draw on nonprofits’ financial information (Joassart-Marcelli and Wolch 2003; Never and Westberg 2016). Accordingly, this case study considers mass in addition to density, defined as the total revenue received by nonprofits in the census tract. All nonprofit information is drawn from the 2016 Business Master File (BMF) provided by the National Center for Charitable Statistics. The addresses of all nonprofits that have submitted tax documents in the previous two years, after extensive cleaning, were geocoded. Consistent with prior research, in the event that a nonprofit lists a post-office as their location, the post-office address is used (Mayer 2023a, 2023b; Yan, Guo, and Paarlberg 2014). The successful geocoding rate was over 99 percent. The BMF is limited insofar as it may undercount the smallest organizations and those focused on religious services, however, is the best available data source for scholars working on the broader population of nonprofits in a region (Crubaugh 2020; Mayer 2023c; Wo 2018; Yan, Guo, and Paarlberg 2014).
Given the local benefits of nonprofit organizations, a crucial question for the development of a nonprofit sector is the location of nonprofits in relation to need (Joassart-Marcelli and Wolch 2003; Never and Westberg 2016; Yan, Guo, and Paarlberg 2014), and scholars have taken different approaches to quantifying underlying community need. This case study uses the Neighborhood Deprivation Index (NDI) first developed by Messer et al. (2006) investigating neighborhood effects on health. The measure reflects the multidimensional nature of deprivation, and includes a series of variables from the US Census: the percent of the tract that is unemployed, the percent with less than a high school education, the percent earning less than 30 thousand dollars a year, the percent on public assistance, the percent under the federal poverty line, the percent of households that are female headed with dependents, the percent of housing that is crowded, and the percent of males in management, science, and arts occupations. Given this set of variables, the NDI is found by taking the first principal component, providing a relative measure of deprivation. Higher levels of the NDI indicate a higher level of deprivation and need in the geographic area. Three census tracts have been removed from the sample for having a resident population of zero in 2016, which makes several variables used in the NDI undefined (e.g. percent of the population under the federal poverty line). The final sample contains 443 tracts within Cuyahoga County.
Table 1 shows the descriptive statistics for the variables in the case study. The table shows the average tract has a population of just under 3,000, with 8.5 nonprofits and just under 40 million in revenue. The table also includes the distribution of nonprofits by primary purpose, showing the most common nonprofit types, on average, are human service nonprofits, or those in “other.” The NDI appears in Table 1 as well, which is unitless and ranges from just below 0 to 0.21.
Descriptive statistics for Case Study Variables (Cuyahoga County 2016, N = 443).
| Variable | Mean | SD | Min | Max |
|---|---|---|---|---|
| Resident population | 2841.33 | 1348.65 | 145 | 10,687 |
| NDI | 0.01 | 0.053 | −0.07 | 0.21 |
| Total revenuea | 3903.89 | 41,003.48 | 0 | 754,438.30 |
| Nonprofit density | 8.58 | 24.66 | 0 | 455.00 |
| Human services | 2.40 | 3.84 | 0 | 37.00 |
| Education | 1.26 | 3.83 | 0 | 69.00 |
| Public | 1.27 | 3.24 | 0 | 58.00 |
| Religious | 0.54 | 3.25 | 0 | 63.00 |
| Arts | 1.71 | 18.21 | 0 | 383.00 |
| Health | 0.56 | 1.36 | 0 | 11.00 |
| Other | 2.11 | 4.48 | 0 | 75.00 |
-
All nonprofit information is from the 2016 BMF provided by the NCCS. NDI, neighborhood deprivation index. aIn units of 10,000 2016 dollars.
Several scholars have emphasized the benefits of exploratory data analysis when spatial components are present in data (MacIndoe and Oakley 2022; Never and Westberg 2016). Good (1983) suggests the goal of exploratory data analysis is to present the data in a way that matches our ability to process information, identify non-random patterns, develop and refine hypotheses, and maximize expected utility by estimating the cost of computation and thinking. Although Table 1 gives a variety of information about the distribution of each variable, it does not describe the spatial relationship, and may obscure any spatial clustering or high-density regions.
The presence of relevant spatial information suggests a map may be a better way to understand these data. Figure 1 shows four maps, where panel A displays the spatial distribution of nonprofit density and panel B shows the spatial distribution of nonprofit revenue log transformed, mean centered, and scaled by the standard deviation. Panel A shows the relative presence of nonprofit organizations across the county, with higher density in in the north-central regions (this is the city of Cleveland). Panel B shows the relative financial capacity of the nonprofits, with greater revenue in the city center and in the eastern suburbs. These maps are straightforward, however, additional descriptive statistics can be helpful to understand the spatial dimension of the county’s nonprofit sector. There are a number of well-developed measures of spatial autocorrelation which make different assumptions and provide different interpretations (see, Bivand and Wong 2018 for a more comprehensive review of these measures and their implementation). Calculating spatial autocorrelation requires information about the proximity of a unit to surrounding units. This is done with the information provided in the shapefile (see the case study documents), a simple format used to store geographic information. After reading the shapefile, we have several functions available to process the information for data analysis in the spdep package (see, namely, spdep::poly2nb in the associated code, Bivand, Pebesma, and Gómez-Rubio 2013).

Panel A shows nonprofit density (discretized) by census tract, panel B shows log revenue, after mean centering and scaling to variance of 1. Panel C shows the local Moran’s I for nonprofit density, while D shows the local Moran’s I for log revenue.
Autocorrelation describes the correlation of a variable with itself, typically over time or space. MacIndoe and Oakley (2022) encourage the use of Moran’s I, a measure of global spatial autocorrelation, which is typically between −1 and 1. A positive Moran’s I suggests that values in a region are positively correlated with their neighbors, for example, that nonprofits may cluster due to economic networks, while a negative Moran’s I suggests the values are negatively correlated 1 . In this case study, the global Moran’s I for nonprofit density and mass are 0.08 (p < 0.001) and 0.12 (p < 0.001), respectively. These suggest spatial autocorrelation is positive and significant, although relatively weak. However, the global measure of spatial autocorrelation may belie important patterns across subgeographies that average out to a given global measure. To further explore spatial patterns, Panels C and D show the local Moran’s I, relaxing the homogeneity assumption of the global measure by providing a measure of spatial autocorrelation in each spatial unit (Anselin 1995). Clearly, the figures identify spatial patterns that are likely to be non-random. Panel C shows several regions where nonprofit density tends to be positively clustered. The local Moran’s I for revenue in Panel D show very different patterns over space. The pattern of revenue is generally smoother, (i.e. closer to homogenous) across the county, with several negative areas, suggesting revenue may be concentrated in one tract in those regions.
3.1 Bivariate Spatial Exploratory Data Analysis
The preceding discussion illustrates the importance of the spatial dimension of a county’s nonprofit sector. It shows that nonprofit density and mass are not uniformly distributed over space and may be concentrated in specific areas. However, Never (2011) argues that for funders and managers, effective maps must contain measures of organizational presence as well as “measures of public problem intensity” to allow donors and foundations to ensure “their funds are reaching organizations that are providing the services to a specific population at a time of need” (p. 177). This suggests that looking exclusively at measures of density and mass are inadequate for an exploratory analysis of the nonprofit sector, and scholars have long considered the co-occurrence of density and need (Joassart-Marcelli and Wolch 2003; McDonnell, Mohan, and Norman 2020; Never and Westberg 2016; Yan, Guo, and Paarlberg 2014).
In 2016, nonprofit density and the NDI have a correlation of −0.16 (p < 0.001). While this suggests that regions with higher deprivation may have slightly fewer nonprofits on average, it does not help guide investment for managers, planners, or foundations. A map that meets the requirements proposed by Never (2011) will help redress these limitations, and may involve a bivariate scale, which can be accomplished in either ggplot2 or the biscale package, used for simplicity in this case study (Prener 2022; Wickham 2016). By splitting the data into evenly spaced quantiles, Figure 2 illustrates that many tracts with higher nonprofit density have lower deprivation, particularly near the outer fringes of the county. In Figure 2, the darkest areas on the map indicate levels of high deprivation and high density, while lightly shaded regions are low in both respects. Higher deprivation, with lower density, is found in the units with a darker shade of magenta, while high density and low deprivation corresponds with a more pronounced blue.
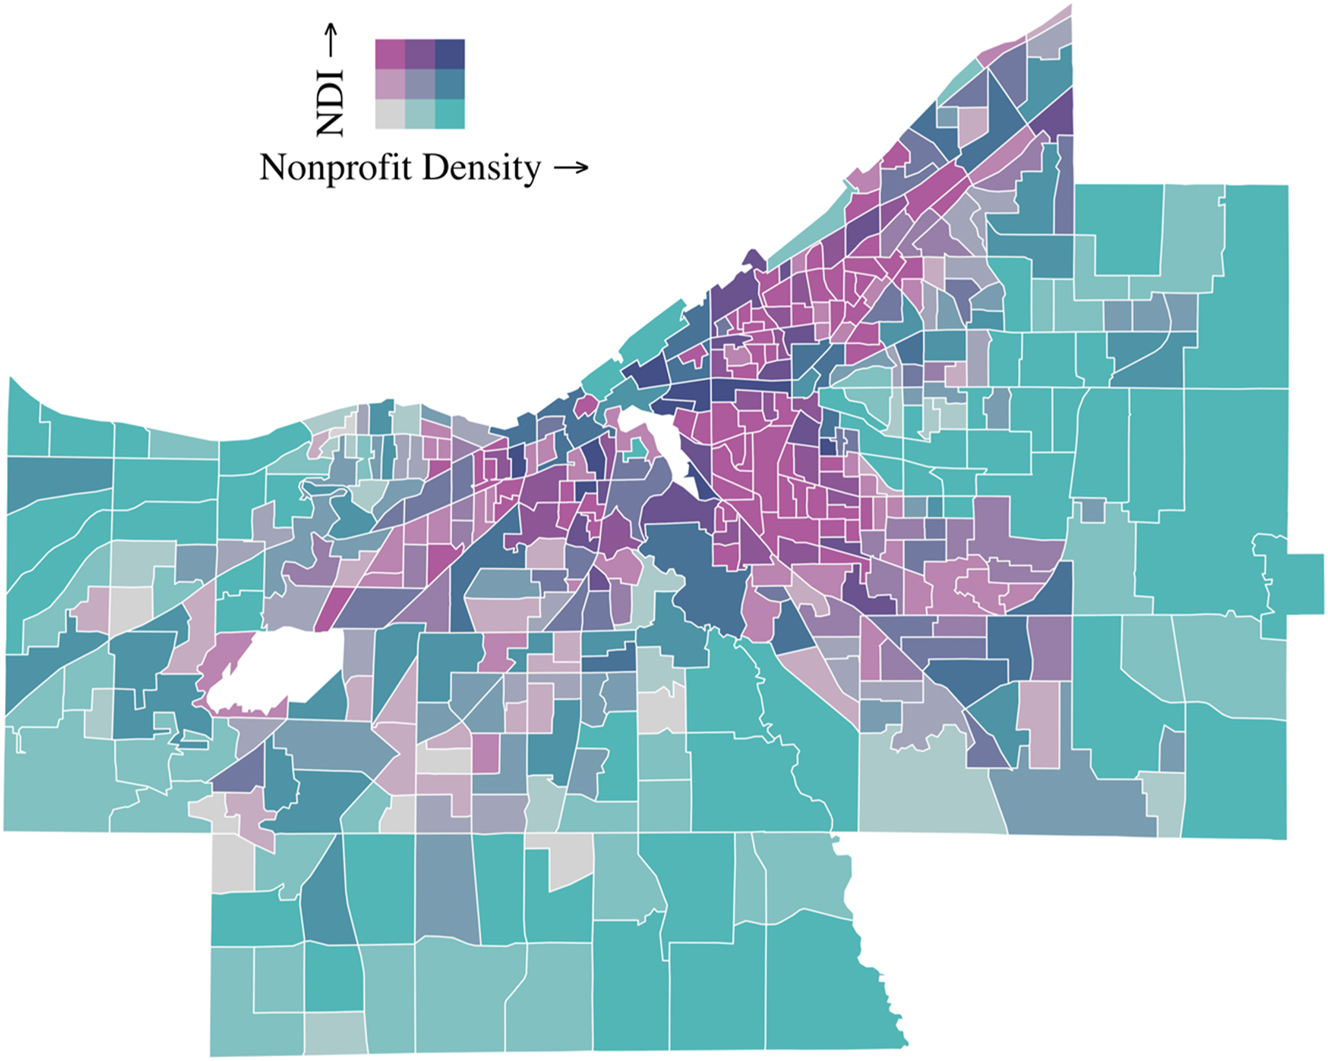
Bivariate map showing the neighborhood deprivation index developed by Messer et al. (2006), and nonprofit density by census tract.
4 Discussion and Suggestions for Instruction
Data are increasingly important to the operations of nonprofit organizations, including tasks typically undertaken by managers such as community need assessment, program design, outreach and engagement. Accordingly, several nonprofit education programs have undertaken efforts to increase data literacy among nonprofit professionals. Yet, the spatial element, which benefits nonprofit professionals by providing essential context for philanthropic efforts, has received less attention in this area. This paper has presented a case study, with associated code and data, which can be used to illustrate the benefits of incorporating a spatial perspective in nonprofit work. By encouraging a hands-on approach, this case study is consistent with theories of adult learning which suggest adults learn best when learning is applied and experiential (Merriam and Bierema 2013). Engaging students in a experiential learning creates opportunities for a feedback loop, where experience itself brings further learning opportunities (Merriam and Bierema 2013). For example, instructors may follow this case study and use students’ past experience to discuss information that may benefit the managers, foundations, or policy makers. These conversations can prompt discussion regarding communication with executives and policy makers in this area, for example, regarding the best ways to communicate the information to relevant stakeholders. Additionally, the associated data and existing code provide students a foundation to begin exploring finer-grain level considerations or alternative representations, sparking self-directed learning (Brookfield 1991). Short of a hands-on experiential approach to this case study, instructors may incorporate the maps used in this case study to illustrate the importance of the spatial dimension, using these data to raise questions related to equity in access to nonprofit organizations, and the benefits they provide.
This paper also identified three learning objectives: understanding the value of a spatial perspective, understanding the creation maps, and learning to identify spatial correlation and clustering. The second and third objectives are achieved through the computational case study. For example, given a map of density, the instructor may ask students to identify industrial clusters and ask how they decide what constitutes a cluster. Introducing a measure of spatial autocorrelation provides an opportunity to concretize this intuition. Regarding the first objective, some specific prompts to attain the learning objectives may include the following: Showing students descriptive statistics regarding the county’s sector and asking what other information they desire to understand the sector? What additional information would they want before presenting this data to a policy maker? Further maps may be refined in this way as well: given a map of nonprofit density – what other information would be helpful in understanding the sector. This may lead to further exploration of the data, for example, focusing on the locations of specific types of nonprofits (e.g. educational, human services) and any differences in clustering.
5 Notes
Given a N units with W is the sum of the weights defined in the adjacency matrix, the global measure of Moran’s I is found as:
References
Amburgey, T. L., and H. Rao. 1996. “Organizational Ecology: Past, Present, and Future Directions.” Academy of Management Journal 39 (5): 23. https://doi.org/10.5465/256999.Suche in Google Scholar
Anselin, L. 1995. “Local Indicators of Spatial Association—LISA.” Geographical Analysis 27 (2): 93–115. https://doi.org/10.1111/j.1538-4632.1995.tb00338.x.Suche in Google Scholar
Bivand, R. S., and D. W. S. Wong. 2018. “Comparing Implementations of Global and Local Indicators of Spatial Association.” TEST 27 (3): 716–48. https://doi.org/10.1007/s11749-018-0599-x.Suche in Google Scholar
Bivand, R. S., E. Pebesma, and V. Gómez-Rubio. 2013. Applied Spatial Data Analysis with R (2nd Ed. 2013 Edition), 2nd ed. New York, NY: Springer.10.1007/978-1-4614-7618-4Suche in Google Scholar
Bowles, J. J. 2021. “Spatial data Use in the UK Nonprofit Sector: A Sociotechnical Exploration.” Diss., University of Birmingham. Also available at: https://etheses.bham.ac.uk/id/eprint/12557/.Suche in Google Scholar
Brandtner, C., and C. Dunning. 2020. “Nonprofits as Urban Infrastructure.” In The Nonprofit Sector: A Research Handbook. 3rd ed. edited by W. W. Powell, and P. Bromley, 270–91. Stanford University Press.Suche in Google Scholar
Brookfield, S. D. 1991. Understanding and Facilitating Adult Learning: A Comprehensive Analysis of Principles and Effective Practices (Reprint edition). San Francisco, CA: Jossey-Bass.Suche in Google Scholar
Brudney, J. L., A. Russell, and R. L. Fischer. 2016. “Using Data to Build Community: Exploring One Model of Geographically Specific Data Use in the Non-profit Sector.” Community Development Journal 52: 354–7, https://doi.org/10.1093/cdj/bsw008.Suche in Google Scholar
Campbell, E. 2020. Cleveland Is Now the Poorest Big City in the Country. The Center for Community Solutions. Also available at: https://www.communitysolutions.com/cleveland-now-poorest-big-city-country/.Suche in Google Scholar
Carroll, G., and M. T. Hannan. 2000. The Demography of Corporations and Industries. Princeton, NJ: Princeton University Press.10.1515/9780691186795Suche in Google Scholar
Crubaugh, B. 2020. “Neighborhood Development Organizations and Neighborhood Disadvantage: Race, Resources, and Inequality in Chicago.” Nonprofit and Voluntary Sector Quarterly 50 (1): 27. https://doi.org/10.1177/0899764020941928.Suche in Google Scholar
Dale, M. R. T. 2014. Spatial Analysis: A Guide for Ecologists, 2nd ed. Cambridge: Cambridge University Press.10.1017/CBO9780511978913Suche in Google Scholar
Good, I. J. 1983. “The Philosophy of Exploratory Data Analysis.” Philosophy of Science 50 (2): 283–95. https://doi.org/10.1086/289110.Suche in Google Scholar
Haslam, A., R. Nesbit, and R. K. Christensen. 2019. “The Dynamic Impact of Nonprofit Organizations: Are Health-Related Nonprofit Organizations Associated with Improvements in Obesity at the Community Level?” Nonprofit Policy Forum 10 (3): 1–12, https://doi.org/10.1515/npf-2018-0040.Suche in Google Scholar
Huang, B., and J. Wang. 2020. “Big Spatial Data for Urban and Environmental Sustainability.” Geo-Spatial Information Science 23 (2): 125–40. https://doi.org/10.1080/10095020.2020.1754138.Suche in Google Scholar
Joassart-Marcelli, P., and J. R. Wolch. 2003. “The Intrametropolitan Geography of Poverty and the Nonprofit Sector in Southern California.” Nonprofit and Voluntary Sector Quarterly 32 (1): 70–96. https://doi.org/10.1177/0899764002250007.Suche in Google Scholar
MacIndoe, H., and D. Oakley. 2022. “Encouraging a Spatial Perspective in Third Sector Studies: Exploratory Spatial Data Analysis and Spatial Regression Analysis.” VOLUNTAS: International Journal of Voluntary and Nonprofit Organizations 34: 64–75, https://doi.org/10.1007/s11266-022-00459-6.Suche in Google Scholar
Marwell, N. P. 2004. “Privatizing the Welfare State: Nonprofit Community-Based Organizations as Political Actors.” American Sociological Review 69 (2): 265–91. https://doi.org/10.1177/000312240406900206.Suche in Google Scholar
Mayer, D. J. 2023a. “Social Capital and the Nonprofit Infrastructure: An Ecological Study of Child Maltreatment.” Journal of Community Psychology 16: 1961–76. https://doi.org/10.1002/jcop.22984.Suche in Google Scholar
Mayer, D. J. 2023b. “Understanding Social Disorganization and the Nonprofit Infrastructure; an Ecological Study of Child Maltreatment Rates.” Social Currents 19: 1–19. https://doi.org/10.1177/23294965231159317.Suche in Google Scholar
Mayer, D. J. 2023c. “Understanding Location and Density: A Spatial Analysis of Cuyahoga County Ohio’s Nonprofit Sector.” Nonprofit and Voluntary Sector Quarterly 1–23. https://doi.org/10.1177/08997640231171074.Suche in Google Scholar
Mayer, D. J., and R. L. Fischer. 2023. “Exploring Data Use in Nonprofit Organizations.” Evaluation and Program Planning 97: 10. https://doi.org/10.1016/j.evalprogplan.2022.102197.Suche in Google Scholar
McDonnell, D., J. Mohan, and P. Norman. 2020. “Charity Density and Social Need: A Longitudinal Perspective.” Nonprofit and Voluntary Sector Quarterly 49 (5): 1082–104. https://doi.org/10.1177/0899764020911199.Suche in Google Scholar
McQuarrie, M., and N. P. Marwell. 2009. “The Missing Organizational Dimension in Urban Sociology.” City & Community 8 (3): 247–68. https://doi.org/10.1111/j.1540-6040.2009.01288.x.Suche in Google Scholar
Merriam, S. B., and L. L. Bierema. 2013. Adult Learning: Linking Theory and Practice, 1st ed. San Francisco, CA: Jossey-Bass.Suche in Google Scholar
Messer, L. C., B. A. Laraia, J. S. Kaufman, J. Eyster, C. Holzman, J. Culhane, I. Elo, J. G. Burke, and P. O’Campo. 2006. “The Development of a Standardized Neighborhood Deprivation Index.” Journal of Urban Health 83 (6): 1041–62. https://doi.org/10.1007/s11524-006-9094-x.Suche in Google Scholar
Mirabella, R. 2022. Nonprofit Management Education; Current Offerings in University-Based Programs. Seton Hall University. Also available at: https://academic.shu.edu/npo/.Suche in Google Scholar
Never, B. 2011. “The Case for Better Maps of Social Service Provision: Using the Holy Cross Dispute to Illustrate More Effective Mapping.” Voluntas: International Journal of Voluntary and Nonprofit Organizations 22 (1): 174–88. https://doi.org/10.1007/s11266-010-9123-y.Suche in Google Scholar
Never, B., and D. Westberg. 2016. “Place Matters: The Spatial Effects of Human Service Expenditures.” Nonprofit Policy Forum 7 (3): 20. https://doi.org/10.1515/npf-2015-0025.Suche in Google Scholar
Prener, C. 2022. Biscale: Tools and Palettes for Bivariate Thematic Mapping.Suche in Google Scholar
R Core team. 2020. R: A Language and Environment for Statistical Computing (4.0.2). R Foundation for Statistical Computing. Also available at: https://www.R-project.org/.Suche in Google Scholar
Rode, J. B., and M. M. Ringel. 2019. “Statistical Software Output in the Classroom: A Comparison of R and SPSS.” Teaching of Psychology 46 (4): 319–27. https://doi.org/10.1177/0098628319872605.Suche in Google Scholar
Roudebush, M. M., and J. L. Brudney. 2012. “Making Policy without Parameters: Obtaining Data on the Nonprofit Sector in a Local Community.” Nonprofit Policy Forum 3 (1): 1–23, https://doi.org/10.1515/2154-3348.1044.Suche in Google Scholar
Roudebush, M. M., R. L. Fischer, and J. L. Brudney. 2013. “Adding Assets to Need; Creating a Community Data Landscape.” J. Nonprofit Manag. 1 (16): 14.Suche in Google Scholar
van Wissen, L. 2004. “A Spatial Interpretation of the Density Dependence Model in Industrial Demography.” Small Business Economics 22 (3/4): 253–64. https://doi.org/10.1023/B:SBEJ.0000022232.12761.a9.10.1023/B:SBEJ.0000022232.12761.a9Suche in Google Scholar
Wickham, H. 2016. ggplot2: Elegant Graphics for Data Analysis. New York: Springer-Verlag. Also available at: https://ggplot2.tidyverse.org.10.1007/978-3-319-24277-4_9Suche in Google Scholar
Wickham, H., M. Averick, J. Bryan, W. Chang, L. D. McGowan, R. François, G. Grolemund, A. Hayes, L. Henry, J. Hester, M. Kuhn, T. L. Pedersen, E. Miller, S. M. Bache, K. Müller, J. Ooms, D. Robinson, D. P. Seidel, V. Spinu, K. Takahashi, D. Vaughan, C. Wilke, K. Woo, and H. Yutani. 2019. “Welcome to the Tidyverse.” Journal of Open Source Software 4 (43): 1686. https://doi.org/10.21105/joss.01686.Suche in Google Scholar
Wo, J. C. 2018. “Understanding the Density of Nonprofit Organizations across Los Angeles Neighborhoods: Does Concentrated Disadvantage and Violent Crime Matter?” Social Science Research 65 (7): 56–71. https://doi.org/10.1016/j.ssresearch.2018.01.001.Suche in Google Scholar
Yan, J., C. Guo, and L. E. Paarlberg. 2014. “Are Nonprofit Antipoverty Organizations Located where They Are Needed? A Spatial Analysis of the Greater Hartford Region.” The American Statistician 68 (4): 243–52. https://doi.org/10.1080/00031305.2014.955211.Suche in Google Scholar
Supplementary Material
This article contains supplementary material (https://doi.org/10.1515/npf-2022-0044).
© 2023 the author(s), published by De Gruyter, Berlin/Boston
This work is licensed under the Creative Commons Attribution 4.0 International License.
Artikel in diesem Heft
- Frontmatter
- Research Articles
- Three Models of US State-Level Charity Regulation
- Analytical Lens for Investigating CSOs and State Relations: The Contributions of Coproduction and Institutional Logics Perspectives
- How to Leverage Action Research to Develop Context-specific Capacity Building for Civil Society Organizations
- Case Study
- Teaching Spatial Data Analysis: A Case Study with Recommendations
- Book Review
- B. Gidron & A. Domaradzka: The New Social and Impact Economy: An International Perspective