An improved image processing algorithm for automatic defect inspection in TFT-LCD TCON
-
Liyuan Yan


Abstract
The demand to improve image display in TFT-LCD, implementation of design for image processing is important. In order to meet the specific requirements of low-end Thin Film Transistor-Liquid-Crystal-Display (TFT-LCD) image display. This paper adopts a novel algorithm to conduct subsequent processing of the medical image after SCALER scaling, including contrast adjustment, gamma correction and dithering. Dithering algorithm is the focus of our research. After the study of some classical video image processing algorithms, and considering the real-time requirements, an intelligent algorithm is implemented for hardware implementation and improvement. For each part, MATLAB language is firstly used for advanced simulation to verify its feasibility, and then Right-To-Left (RTL) hardware language description is carried out. The characteristics extraction from images is performed implementing RGB standard and grayscale images. The pixel intensity is analyzed for each RGB component and the variance is calculated. When a panel displays a variation of 6% related with their reference values, the panel is rejected. The results obtained from classification shows a 95.24% accuracy rate in the detection of defects. The results of the two simulations show that the design achieves the expected goal, and the processing time is shorter.
1 Introduction
Thin Film Transistor-Liquid-Crystal-Display (TFT-LCD) is the first to enter the display market with its characteristics of low working voltage, low power consumption, good display effect, easy integration, good light, and portable. The internal circuit of TFT-LCD is mainly composed of two parts. One is the "LCD control chip module", which includes SCALER, Analog-to-Digital Converter (ADC), On-Screen Display (OSD), and Micro Controller Unit (MCU). The other part mainly includes the driver IC and timing control IC, which are the circuits attached to the panel to form the so-called LCD panel module. As the timing controller Timer Control Register (TCON) connecting SCALER, SOURCE, and GATE driver chip, it is mainly responsible for receiving and processing medical image data after SCALER scaling and providing correct timing control and display data for downstream driver chip. At present, the existing finished TCON chips on the market mainly include 1004C and 1004D of PVI; AU's UPS015, UPS017, etc.
In daily life, medical images cannot be ignored play a vital role. Medical image processing refers to the external processing and processing of relevant medical images through electronic devices such as computers. Since 1920, digital medical image processing technology began to appear, the initial processing technology for digital compression technology, its application is more and more widely, such as the medical field, aerospace, communication technology, and military and other fields. In the field of medicine, common X-ray is an important expression of medical image processing technology, the scientists through medical image processing technique, the original medical image clarity and resolution to improve, make doctors can observe patients more clearly through scientific instruments of illness, doctors can fast and convenient to the preliminary diagnosis of the patient; In the field of aerospace, the normal operation of space vehicles has been inseparable from medical image processing technology.
Medical image processing technology can help the aircraft correctly judge the direction during flight and play a role in navigation, as well as help it safely avoid risks. Similarly, in the military field, medical image processing technology can help weapons accurately judge the target of attack and improve the accuracy and success rate of combat [1]. In addition, medical image processing technology can also help the police to solve cases and identify and deal with the traces of the crime scene. In recent years, with the development of science and technology, the application fields of medical image processing technology have gradually increased, which will make great contributions to the progress and development of society. After the 1960s, medical image processing technology developed rapidly. After about a decade, medical image processing technology began to form a relatively complete discipline system. In recent years, medical image processing technology is developing at an unprecedented speed along with the increasing demand for medical image processing technology in related fields.
For a long time, visual information is the most important information that people feel in nature. The results show that the visual system accounts for more than 70 percent of all information received by humans. Images have been widely used in daily life because of their large amount of information, intuitionistic, accurate, and higher efficiency. In the information age, images are acquired and sampled, quantified, and compressed. Image processing has become an effective tool for the study of visual perception, which is widely used in medicine, engineering, remote sensing, military, meteorology, space, transportation, and many other fields. However, in our daily life, due to external factors such as insufficient light, we often find that the brightness of the obtained image is not enough; resulting in the scene cannot be seen clearly.
To study and analyze the image, it is necessary to process the obtained image. The common processing method for digital images is to use image contrast enhancement technology to improve image quality. Image contrast enhancement refers to the processing method that highlights some information of an image according to specific needs and weakens or removes some unnecessary information at the same time. Its main purpose is to make the processed image more suitable than the original image for some specific applications, and the results after processing make the image more suitable for human visual characteristics or machine recognition systems. This paper mainly studies and processes the medical image after SCALER scaling, mainly including contrast adjustment, gamma correction, and dithering, and realizes the improved medical image processing algorithm in TFT-LCD TCON. In this paper, the Floyd-Steinberg error diffusion theory is applied to de-jitter medical image processing of TCON, and the problem of medical image blur caused by shortening the length of pixel word is solved.
In order to meet the distinct demand for improving image display in TFT-LCD, this work demonstrates a synthesis design and its employment for image processing in time controlling of TFT-LCD. This article implements a novel algorithm to conduct subsequent processing of the medical image. The steps involved scaling, contrast adjustment, gamma correction and dithering. An intelligent algorithm is implemented for hardware implementation and improvement after the study of some classical video image processing algorithms, and considering the real-time requirements. The simulation is carried out in MATLAB to verify its feasibility, and then Right-To-Left (RTL) hardware language description is analyzed. The characteristics extraction from images is performed implementing RGB standard and grayscale images and at last pixel intensity is analyzed for each RGB component and the variance is calculated.
2 Literature review
With the rapid development of computer medical image processing algorithms, the detection of Mura defects by machine vision has become the focus of people's attention. In recent years, researchers at home and abroad have conducted many studies on machine detection of Mura defects. TFT-LCD manufacturers’ mainstream detection methods for Mura defects are to train a group of inspectors to judge Mura defects, and these inspectors make visual judgments and ratings based on experience. On the one hand, human eye detection is subjective, so different detection personnel cannot guarantee the complete consistency of detection standards.
On the other hand, this detection method is low in inefficiency and high in cost. Generally, it takes even 40 seconds to detect a 2.4-inch LCD medical image. After a long time of detection, the detection personnel will suffer from visual fatigue and even harm to the eyes. Therefore, people began to pursue more efficient and more standardized detection methods [2]. Tiwari et al. proposed an effective method to enhance the contrast of medical images. Image contrast enhancement is a pre-processing step that improves the efficiency of other image processing applications, such as pattern recognition and computer vision. The method USES natural gamma correction and holomorphic filtering to enhance image contrast and maintains image brightness. Experimental results show that the method can enhance the contrast of medical images without affecting brightness. This makes the algorithm a flexible medical image enhancement tool [3].
Gupta and Tiwari proposed an effective way to enhance the contrast of digital images. Image contrast enhancement is a preprocessing step to improve the efficiency of image processing such as computer vision and pattern recognition. The method USES the weighted probability distribution of brightness pixels and gamma correction to enhance the contrast and brightness of the image. Experimental results show that this method can enhance the contrast of various color images without affecting the visual and color information of the image [4]. Gracheva and Kopylov believe that under the framework of the Bayesian method, the general problem of image processing can be expressed as the estimation problem of the hidden component of the two-component random field [5].
Jin believes that model-based image processing technology is the system framework to solve the inverse problem of an imaging system [6]. Ladkat et al. believed that every pixel must be operated for image processing. If this is done sequentially, it will take too much time. To reduce time, all pixels need to be processed in parallel. Therefore, instead of working on each pixel one at a time, all pixels are worked on in parallel [7]. Maggio and Iocchi proposed a system to automatically optimize the image target classification algorithm and parameters simultaneously. More specifically, the system can process a tagged image data set and return the best-configured image processing and classification algorithm and its parameters in terms of classification accuracy [8].
The computer devices usually offers display data of 8 bit width. Therefore this pixel width of 8 bit should be converted to width of 6 bit for the advanced operation. Dithering matrix provides one easy solution to solve such problem in comparison with bayer matrix [9]. However there still exists some issues that brings effect of adjacent squares in an image present on edge of matrix. In this proposed work an efficient solution based on diffusion algorithm is implemented instead of bayer [10, 11]. Based on Rajinikanth et al., [12] and Kim et al., [13] the histogram for each component is computed for the RGB scale. Elguebaly et al., [14] use Bayes theory, allied to previous knowledge to estimate the absence of pixels, with a statistical and modeling or residual approach to images such as a Gaussian distribution of Laplace. Oliveira et al., [15] used a calculation technique for the average intensity of the images. The result of which is acquired and influenced by diversified environmental factors. Huang et al., [16] presented a program of qualification of 14 steps and presents zero for the organization, within the all, is found to be necessary for the identification of anomalies before the acquisition of the product of the last client.
3 Design of image processing system in TFT-LCD TCON
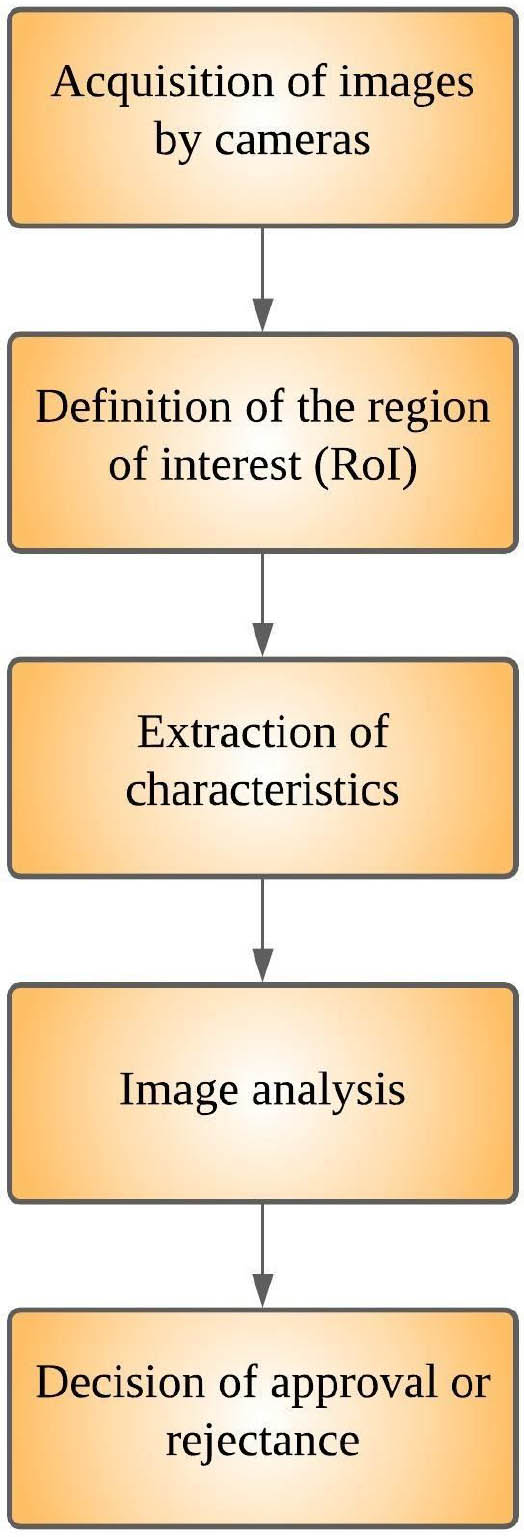
The stages of the proposed algorithm consist of the acquisition of images by cameras, the definition of the region of interest, extraction of characteristics, analysis of images for decision making. The operational stages are presented in Figure 1 and the detailed algorithm is presented in Algorithm 1.
Block diagram for the system of automatic defect inspection
| for i = 2 : Last_line |
| for j = 2 : (Last_column − 1) |
| red_error_sum |
| = int8(red_error (i − 1j − 1) |
| *
|
| red (i, j) = red_error_sum + int8(bitshift(red(i, j), −2)); |
| red_error(I, j) = int8(bitshift(bitshift(red(i, j), 6), −6))− |
| red_error_sum; |
| end |
| end; |
The captured image is digitized through ADC and then assembled in a buffer for the transmission as packets to PC. A region of interest belongs to that area of an image that we want to focus on for analysis. A region of interest can be defined on an interactive basis, through programming, or with an image mask. The area of interest is segmented from the input image and in the next step, the characteristics are extracted from patterns. It attributes the quality associated with the pattern that allows characterization. In the fourth step, the images are analyzed for the perception and understanding of image features. In the last step based on the analysis of image, the decision is made for approval.
3.1 Medical image enhancement
In the process of medical image generation and transmission, inevitably affected by the external environment and generate some noise, affects the final medical image effect, so to guarantee the effect of the medical image, the effects of reducing noise, medical image enhancement algorithm arises at the historic moment, medical image enhancement algorithm, not only can effectively reduce the influence of the noise, and can also enhance medical image clarity, achieve the visual effect. On medical image enhancement algorithms, there are many different ways, some of these methods in medical image denoising, some in gray medical image enhancement and color medical image enhancement has prominent effect in different aspects, such as, according to the relevant data contrast found Jourlin and Pinoli study algorithm is more general, on the one hand, can effectively abate the noise, on the other hand, can improve medical image clarity, sound processing medical image detail, and also can enhance the medical image grayscale and color, at the same time the medical image is not so and distortion, is now a better calculation method in the field of medical image processing [17].
3.2 Edge detection
Medical image processing, edge of mishandling would happen often lead to a medical image, medical image edge is due to the uneven distribution of medical image grayscale, texture or caused by improper handling, at this time to detect the edges of the medical image, the edge method also has many, but this among them, the Canny method is the most ideal effect, but this kind of algorithm for noise treatment effect is bad, therefore, the improved Robert comes edge detection algorithm, the improved Robert algorithm overcomes the problem of improper handling Canny method for noise. At the same time, it overcomes the disadvantage of the traditional Robert algorithm in rough medical image edge processing and can make the processed medical image have a clear viewing effect.
3.3 TFT-LCD system structure
TCON timing signal is generated based on the needs of the TFT-LCD Panel. To understand the principle of TCON, one should first understand the display principle of the LCD Panel. The internal structure of a typical TFT-LCD panel is shown in Figure 2. Liquid crystal has light transmittance controllability, change the voltage applied on both ends of liquid crystal; liquid crystal transmittance will change accordingly.
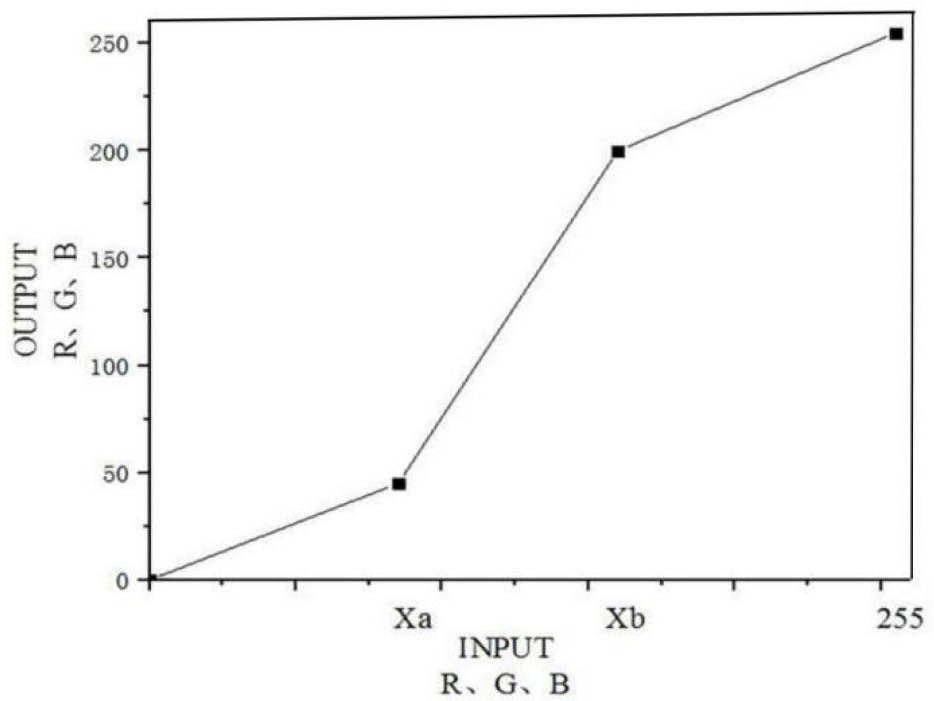
Contrast adjustment relationship
A liquid crystal unit displays a sample point, so a medical image can be displayed if it is arranged in a matrix according to the data structure of the binary medical image into a crystal array. In general, LCD arrays can be arranged in two ways: Strip and Delta. Different arrangements determine different Red Green Blue (RGB) sampling orders, and a pixel consists of three liquid crystal units (RGB). Therefore, the number of liquid crystal elements in the liquid crystal array determines the display resolution. TFT-LCD is formed by separating display pixels and scanning electrodes through TFT transistor on the basis of super-distorted STN, which is characterized by overcoming the crossover effect of STN-LC9 [18].
TFT-LCD system consists of two parts: LCD control module TCON and LCD panel module. The LCD display adopts the active matrix driving mode according to the row and column. The row lines are connected to the gate of the pixel NMOS tube, and the column lines are connected to the Source of the NMOS tube. In the LCD module, the line and column line are driven separately. The circuit that drives the column line is called the Source Driver. The source driver and the gate driver together control the charging and discharging process of the liquid crystal unit. When the scan signal is valid, all TFT cells on this line are turned on at the same time, and the RGB voltage charges the memory capacitor through TFT. Therefore, the voltage difference between RGB and Vcom determines the voltage of the liquid crystal column. When the scanning signal is invalid, the TFT unit on this line is disconnected, and the charge of the storage capacitor can remain basically unchanged in one frame time, thus achieving the static display effect of the duty cycle approaching 100%. The main function of TCON is to provide the necessary timing control signals for the source and gate drivers in TFT-LCD panels. According to the requirements of the Panel, the most basic output signals of TCON are STV, OEV, CPV, STH, CPH, OEH, PLC, etc. In addition, in order to achieve different display modes, there are L/R, U/D, MOD, Q2H, and other control signals [19].
3.4 TCON module design of timing controller
TCON module of timing controller includes PLL, I2C interface, DIV of the frequency divider, HSB of line synchronization module, VSB of field synchronization module, and CSB of control signal output module. The field synchronization module VSB generates the control signal needed by the gate driver. Line synchronization module HSB generates the control signal required by the source driver. The control signal output module CSB generates the scanning direction control signal.I2C interface is introduced in the design of this system. The control signal can be controlled through the internal register, and the change of display mode can be realized by changing the software, thus greatly reducing the number of pins of the external hardware circuit. PLL can provide system clocks with 1920, 1440, 1200, and 1152 resolutions, while 960, the corresponding clocks of 480, 400, and 320 resolutions are obtained by frequency division of the DIV module [20].
Since output control signals required by different LCD resolutions and working modes are different, TCON should first make a judgment and choose the correct working mode to generate appropriate control signals. These options include LCD resolution, external/PLL clock mode, split/composite mode, NTSC/PAL mode. LCD resolution selection: in the actual display system, TFT-LCD has different sizes and resolutions. The resolution of general medium and small size TFT-LCD is 480×234 (2.5″, 3.5″), 960×234 (3.6″, 5″, 6.4″), 1200×234 (6.5″), 1400×234 (6.2″, 7″), 1920×234 (9″), etc. For different resolutions of LCD, the need for some control signals will be different. External /PLL clock mode selection: the working clock source is provided in two ways, PLL mode, and external clock mode. In the PLL working mode, the VCO circuit generates oscillations, which are transferred to TCON by a phase-locked loop circuit a working clock for stability; in external working mode, the working clock is provided externally.
Separate/compound mode selection: the input synchronization signal can be divided into compound synchronization signal and separate synchronization signal. The synchronization pulse flag bit of these two kinds of synchronization signals is different. NTSC/PAL options: NTSC and PAL options have completely different lines per frame and sync pulse flags, so a decision should be made before the input signal is processed and the control signal is generated. Display mode selection under high resolution: there are 8 different display modes under high resolution, including FULL, Center, Wide, Zoom1, Zoom2, Left, Right, and Zoom3. Under different display modes, the display area, output control performance, and pulse width will be different.
4 Adjust technology and hardware design
4.1 Contrast adjustment
The contrast of the display is defined as: in a dark room, the brightness under the white screen is divided by the brightness under the black screen so the brighter the white and the darker the black, the higher the ratio. Contrast enhancement adjustment tries to increase the contrast between different colors, making bright pixels brighter and dark pixels darker. Contrast reduction reduces the contrast between colors, darkening bright pixels and brightening dark ones. There are two ways to change the contrast in an LCD display:
The contrast of an LCD panel. High contrast means a relatively high level of brightness and color. In fact, it is determined by the optical properties of LCD back-light and LCD panel. Once determined, it cannot be adjusted.
The contrast of the image itself reflects the distribution of the image from light color to dark color, and reflects the transition characteristics of the image in the gray level. This article discusses the contrast of the image itself. There are two methods of image contrast enhancement: spatial domain method and frequency domain method. After dividing the image into target area, background area and transition area through min value segmentation, the piecewise linear transformation method based on double min value segmentation can adjust the image contrast by adjusting the weight value W. The method is not only simple to adjust, but also considers the information characteristics of the image itself.
In the implementation of the circuit, since every frame of image in the continuous video stream always enters the contrast processing module one pixel at a time according to the order of horizontal and vertical scanning, to calculate the current frame's min value, it is necessary to store one frame of image. However, due to the continuity of the image, there is no need or need to increase the frame memory. We can use the value of the previous frame to adjust the contrast value of the current frame, which will not affect the adjustment effect.
Contrast adjustment refers to Figure 2. Contrast adjustment mode is shown in Figure 2. Here mainly involves the design of a multiplier, in view of the requirement of real-time, we adopt a pulsating array, due to the combination of the multiplier delay is bigger, can’t meet the requirements of our high speed, so we skillfully to pulse array of joined the level 4 trigger to form the structure of the assembly line, to reduce the delay time of each level. The L1, L2 and L3 in the figure are limited in scope, L1L3 ∈ {1/42/43/415/46/47/424}, the precision of L2 is relatively high, because it involves the connection problem of curves where L1 and L3 are located. We use 8 bits, L2 ∈ {0.0000000 ~ 1.1111111}, namely {0~1.9921875}.
The corresponding functional expressions are as follows: (1) to (3)
4.2 Gamma correction
4.2.1 Principle of Gamma correction
Gamma correction is a parameter value used to express the nonlinearity of the display, but in fact, Gamma correction exists even if the display is linear. The reason is that the perception of brightness, or RGB, in the human visual system is more of a pair-to-number relationship than a linear one. Gamma correction is a transfer function introduced to overcome this non-linearity and is widely used in video streaming, computer graphics and other imaging systems. In general, due to differences in visual environment and display device characteristics, the Gamma value is between 2.2 and 2.5. Generally, when the value used for Gamma correction is greater than 1, the highlight part of the image is compressed and the dark part is expanded. When the value used for Gamma correction is less than 1, the highlight part of the image is expanded and the dark part is compressed. Gamma correction is generally used to smooth out the dark details.
Without Gamma correction equipment will affect the color of the final output image brightness, such as a kind of color is composed of red and green, the brightness of the red 50%, green 25% brightness, if one is not after Gamma correction of the monitor Gamma value is 2. 5, so the brightness of the output will be 18% and 3%, respectively, the intensity is greatly reduced.
To compensate for this deficiency, we need to use the counter-effect compensation curve to make the display as much as possible to output the same image as the input image, so as to get a better output on the display. This process of using the inverse compensation curve to make the input and output images consistent is called Gamma correction. The principle of correction is described as follows: the ideal display system is linear; in other words, the intensity of the light output of the display system should be proportional to the amplitude of the video signal input. Let the output light intensity of the display system is Lout and the input value
The input voltage (v) of the LCD display drive circuit and the light intensity (L) of the LCD display usually have a non-linear relationship L = vc (index c is between 1 and 2.5, which is set by the display manufacturer according to different environmental needs and constraints). This feature makes the SOURCE driver chip have a special set of resistors to solve the nonlinear problem. Simulation to solve the non-linear is not accurate to digital technology, in order to solve this problem, the LCD display system to add digital gamma correction, the display of the light intensity and drive circuit input voltage into a linear relationship, effectively reduce the medical image distortion, also make the SOURCE drive design simple. The core algorithm of gamma correction is the lookup table. We configured the pre-calculated corresponding output data into ROM to realize a linearization process. In the initial debugging stage, E2PROM could be used to facilitate chip debugging.
4.2.2 Sub-channel LCD Gamma correction
Compared with the traditional CRT display, the photoelectric characteristics of LCD display are very different. The transfer function between the output light intensity and the input signal of the liquid crystal display system without Gamma correction is irregular "S" shape, and the corresponding transmittance is basically unchanged for the step signals of 50% lower and 20% higher. The intermediate step signal range of 30% corresponds to the transmittance range of about 90%, which seriously affects the gray level and color reproduction effect of the output image. The purpose of Gamma correction is to compensate for this nonlinearity; so that the liquid crystal display has the power response characteristics of the ordinary Cathode-Ray Tube (CRT) display system.
The Gamma curves of LCD are Red, Green and Blue, which are inherent to LCD, not random. The X-axis represents the gray level of the input image, which ranges from 0 to 255 and is divided into 16 equal parts, each representing 16 gray levels. The Y-axis is the normalized light intensity. The three Gamma curves of Red, Green and Blue are quite different from the curve with a Gamma coefficient of 2.2 commonly used in China. Therefore, the normal compensation curves with a Gamma coefficient of 2.2 cannot be used to correct the LCD display. Moreover, the Gamma curves of the three channels of RGB are also different, which makes it more difficult to correct LCD Gamma. In addition, since the current video and computer graphics generation systems still use the previous Gamma precreation method with a Gamma coefficient of 2.2, the color cannot be accurately restored when the LCD is connected to these systems. Therefore, in the LCD image engine, the linear RGB must be again specially Gamma corrected according to the LCD's Gamma curve to calibrate the LCD display image color.
Based on the above reasons, the LCD Gamma correction method proposed in this paper is as follows:
Sub-channel Gamma correction; since the Gamma curves of the three channels of RGB are different, compensation is made for the Gamma curves of the three channels of R, G and B.
Consider the modification of the pre-compensation method with a Gamma coefficient of 2.2
Since the current video and computer graphics generation system still follows the previous pre-correction method with a Gamma coefficient of 2.2, it is not possible to directly use the Gamma curves of R, G and B channels to perform Gamma correction, so the pre-correction method with a Gamma coefficient of 2.2 needs to be considered. The specific Gamma correction method is as follows (take any point P in the figure as an example):
Make a horizontal line through point P and cross the Red channel curve at point N;
The input value of pixel gray value at point P is 122;
The input value of pixel gray value of read N point is 149;
Fill 149 into address unit 122 of the Look upon Table (LUT) Red component lookup table to complete the correction of the Gamma coefficient of 2.2 for the input value 122-’ 149.
According to the above principle, the above 4 steps of correction are completed for each pixel's gray scale of 0~255, and a complete Gamma corrected color lookup table of the Red component can be obtained.
According to the above five steps, the establishment of the Green and Blue channel color lookup table can be completed. The Gamma correction of LCD is realized by dividing channels, and the pre-compensation method with the current Gamma coefficient of 2.2 is modified.
This shows that when the input Red component of the pixel gray level 122, in the hope of light intensity on the LCD should be Gamma 2.2 P point on the curve of the light intensity, but it is when the input value is 149, N point on the Red channel Gamma curve produced with the P point of light intensity, it can complete the above mentioned methods the Gamma correction of LCD, and make the color of the LCD display system to get accurate reduction.
4.2.3 Hardware design and image simulation of Gamma correction
First, the possible value of RGB component of 8bit was taken as the independent variable, and the correction value was calculated according to the correction step, and then stored in LUT (still 256 grades). During use, the RGB component value is taken as the address offset, and the Gamma correction of the input signal can be completed by looking up the table.
The realization of Gamma correction is through the Gamma correction processing of the three color component values of the input pixel, R, G and B, and the Look up Table (LUT) method is used on the hardware to realize the Gamma correction. The 256 possible values within the value range of 0~255 of each component are pre-calibrated and the calculated results are written into the on-chip Read Only Memory (ROM). When carrying out Gamma correction, according to the values of each component of the input pixel, the corresponding correction value is read from ROM as the output of the component, thus realizing the Gamma correction of the image.
4.3 To shake
In many practical applications of LCD displays, affected by the accuracy of specific display terminals, the digital images represented by multi-bit bits in the processing process need to reduce the number of pixels before display to meet the requirements of display terminals, which results in a problem of conversion from high-precision display space to low-precision display space. This paper firstly analyzes the shortcomings of the basic methods to realize this transformation - direct interception. In order to obtain higher image display quality, the commonly used error diffusion halftone algorithm is discussed.
The appearance of "block effect" is intolerable to the display system because it greatly reduces the display effect of the image. The research on the principle of human eye vision shows that the ability of human retina to recognize the gray level is 1, that is, under the condition of 100 gray levels, if there is a change of 1 level, it can be recognized. Therefore, when an 8bits of gray scale information is converted to 6bits, its gray scale change rate is 1/64(1.56%). When an 8bits of gray scale information is converted to Obits, its gray scale change rate is 1/16 (6.25%). Therefore, the algorithm directly intercepting the redundant bits will inevitably cause the image quality recognized by human eyes to decline. However, in terms of the cost of hardware implementation, the 6bit LCD panel can reduce the cost compared with the 8bit LCD panel, and the pseudo-true color panel can reduce the maximum number of driving IC, thus reducing the difficulty in visual Angle and contrast design. Therefore, in many applications, such as small and medium sized LCDS equipped with portable devices and mid - and low-end desktop LCDS, fake color panels with 6 bits or less are used. As a result, there is a contradiction between saving cost and greatly reducing image quality.
In order to improve the display quality of the image as much as possible, many algorithms are proposed, which are uniformly classified as digital halftone technology. The basic function of halftone processing is to eliminate the stepped striations caused by the discontinuous tone output of the image, so as to achieve the effect of image color enhancement, and effectively eliminate the inherent block-effect defects of the image, so as to make the image smoother and softer, and further improve the quality of the image. The basis of digital halftone processing is that the human eye has a "spatial proximity characteristic" at the initial stage of processing visual information, so that spatially adjacent parts of the image are treated as a whole. In this way, the human eye has a low resolution of details within a certain visual Angle (also known as the low-pass property), and at the same time, the perception of the gray or color of a small facet by the human eye is the perception of the total gray or color of the facet at a certain distance. The gray image or color image is binaries by using this characteristic of human eye. As long as the binary pixel points are close enough in space, the human eye can see the continuous tone.
In halftone processing, gray is not provided by the halftone all source image gray level, there is a similar problem, with an approximate gray instead of the original gray level, there must be error, and simply give up, if this error is bound to affect the image processing effect, such as the change of the grey value and color value of jumping, etc. Therefore, how to deal with the error becomes the key of the problem, and the error diffusion algorithm comes into being.
Error diffusion is based on a single principle. Once a pixel is quantized, it has errors that affect the pixels around it. The process by which the error affects the surrounding pixels is called diffusion, which means that the error is divided into components that are added to the gray scale values of the adjacent pixels. A negative feedback system is the system in which the system is in a self-correcting state through the diffusion of errors. This algorithm is a neighborhood processing process, which diffuses the quantization error of the current pixel to the neighboring pixel in a certain proportion. In this way, the local quantization error is a compensation for the adjacent pixel points, so the error diffusion system has the ability of self-correction. Moreover, it can guarantee that the total gray scale or total color of the image before and after processing is consistent on the whole.
Simple dithering can be achieved by using dithering matrix, like a typical BAYER matrix. However, the medical image processing effect of this scheme is not very good. After matrix processing, the medical image produces block effect. Therefore, we adopt the better Floyd-Steinberg error diffusion algorithm. We adopt {1/16, 5/16, 3/16, 7/16} coefficient combination Floyd-Steinberg error diffusion algorithm based on delta-sigma modulation. Noise-shaping feedback coder is a DSM for word length compression, and f–s algorithm is one of NSFC. The algorithm of NSFC is shown in Figure 3.
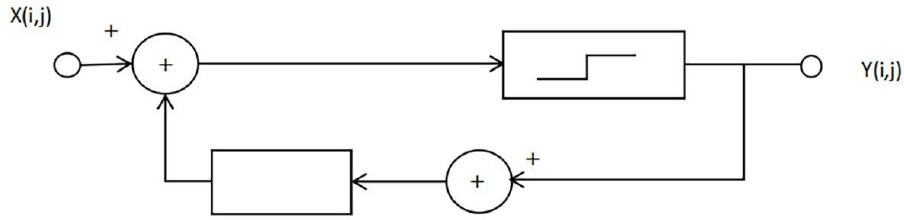
Algorithm structure diagram of NSFC
The corresponding transfer function is: Y(x) = X(z) + [1 − H(z)]* N(z)
The noise transfer function corresponding to Floyd-Steinberg algorithm is: NTFz1, z2) = 1 − 1/16(z1−1z2−1 + 5z2−1 + 3z1z2−1 + 7z1−1)
Error diffusion algorithm is mainly composed of column and column counting module, control module, data path and First Input and First Output (FIFO) memory. The control module solves the sequence of reading and writing of FIFO. The data path mainly completes a weighted average of error diffusion coefficient to obtain the current pixel value and calculate the corresponding diffusion error. FIFO is used for error storage of adjacent two lines. Given that the error can be negative, a 3bit FIFO is used to store the signed error. Dual-ports Random Access Memory (RAM) automatically generated by VeriSilicon is adopted to produce FIFO that can read and write simultaneously.
4.3.1 Simulation results and discussion
In order to verify the effectiveness of the above algorithms, we respectively used MATLAB language and Verilog language to simulate some algorithms of contrast adjustment, brightness adjustment and dithering, and provided the core code of MATLAB simulation and the comparison before and after medical image processing.
Figure 4, presents the spectral response of the images. An image offers resources as a global shutter and control of exposure time. Either the start or the exposure time can be controlled by parameters transmitted through interface. There are also parameters available to adjust single image acquisition or acquisition of continuous images. The start of exposition can also be controlled through a signal generated externally, and that is applied to entrance. The proposed algorithm is described below and simulation results are explained.
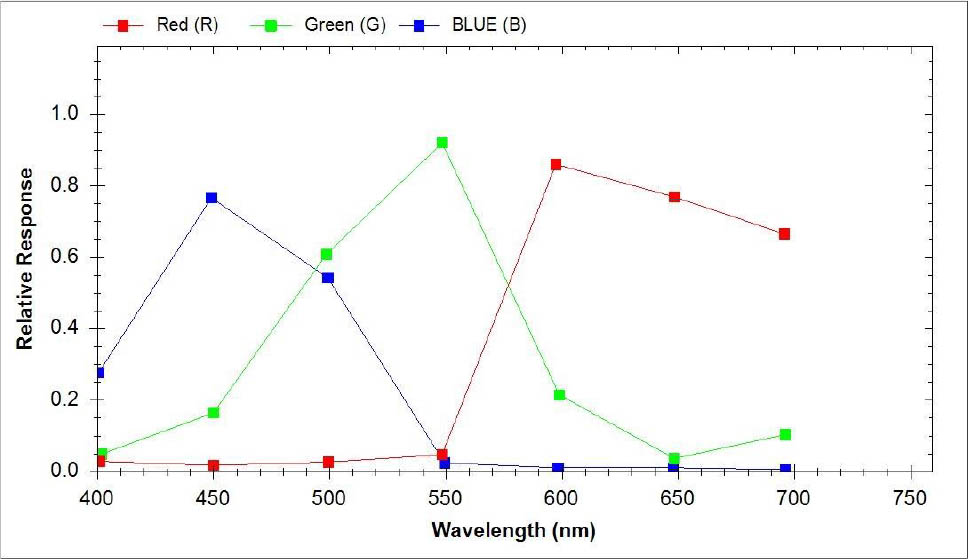
Spectral response of RGB extraction
Figure 5 represents the experimental analysis of proposed scheme to evaluate the sparsity rank under various values of ρ for different defects in images. On the other hand the evaluated running time for various defects in images is depicted in Figure 6.
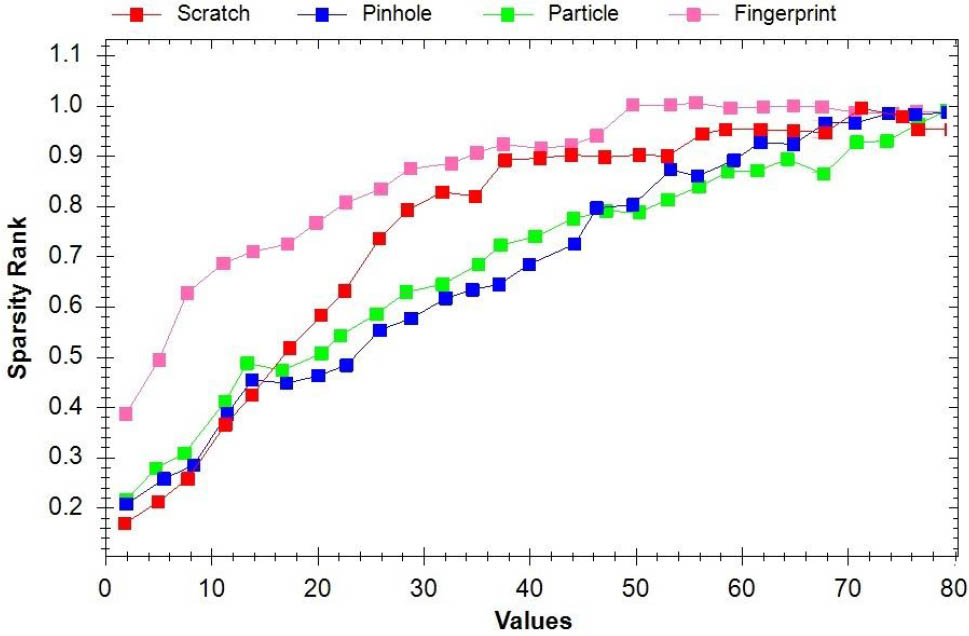
Analysis of sparsity rank under various values of ρ for different defects in images
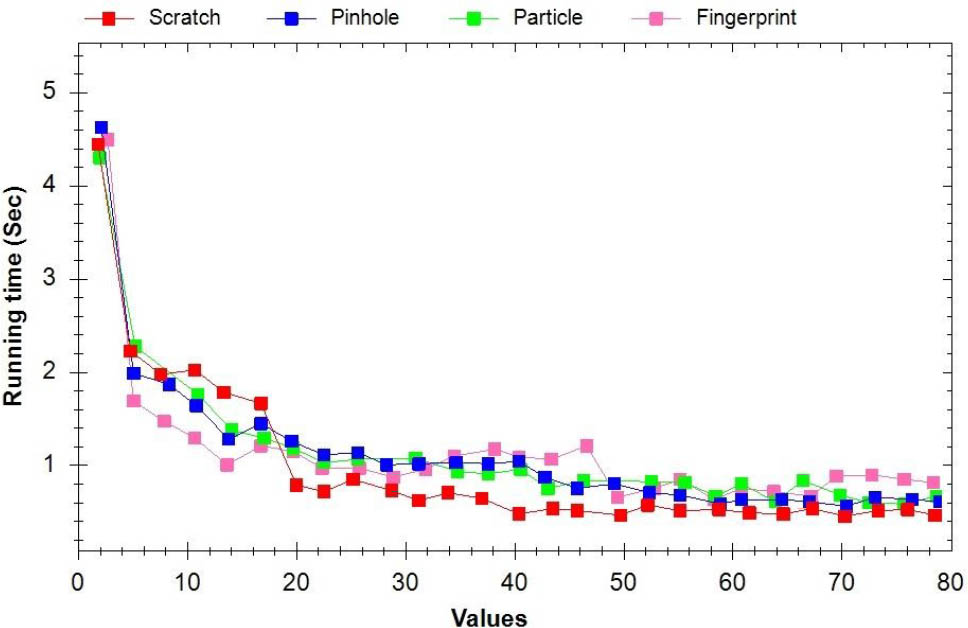
Analysis of running time under various values of ρ for different defects in images
The evaluation of running time is an important parameter that is essential for the manufacturing process of industrial application. Figure 5, depicts the relation between the sparsity rank and values of ρ. Here ρ is considered as {2, 4, 8, 10,. .., 78, 80} and the corresponding sparsity rank is calculated as SRk, where k = 1,2,3,. .. ,length (ρ). Length (ρ) represents the length of vector ρ.
The experimental analysis of designed model, which is implemented in FPGA reveals that with much improved modules, it can be substituted in commercial LCD. The practical implementation of proposed model reveals that it can be substituted with LCD for obtaining video image at high speed and absolute improved definition. MATLAB simulation results are as follows: "LCD output image without correction" is smaller than the gray value of the source image, and the image appears darker, while the image processed by the algorithm proposed in this paper is darker. The "corrected image" has a higher gray value than the source image, and the image appears brighter, while the image processed by the algorithm proposed in this paper is brighter. The "corrected LCD output image" processed by the pre-modified sub-channel correction method proposed in this paper is closer to the original image than the "corrected LCD output image" processed by the Gamma=2.2 correction method. Compared with the 8bit image, the 6bit image is slightly fuzzy, and there is a lack of detail in the image, but basically it has achieved a better effect. The processing effect of Floyd-Steinberg diffusion matrix method is better than that of Bayer jitter method, and the "block effect" is further improved. The dynamic error diffusion method based on the edge has the best processing effect, and its "block effect" is controlled to the maximum extent. Moreover, the edge details of the image are richer and finer than those of other algorithms, and the image edge is clearer.
5 Conclusion and future work
The synthesis design that involves adjustment of contrast and luminance along with Gamma correction, an improved image processing algorithm is presented in this article. With the development of science and technology, the medical image processing technology in our country is also in continuous progress, providing a lot of convenience for our daily life, but also happy our mood. However, there are still some defects in many medical image processing technologies at present. For example, medical image edge processing is too rough, color contrast is not strong, gray scale is not enough, etc., which makes the visual effect of multi-degree medical images in practice not good, which not only affects the aesthetic degree of its appearance, but also affects its function. In this design, the timing of TCON is different for different LCD panels, but the display principle is basically the same. Although the improved algorithm of image processing designed in this paper is deficient in the details of the image, it has achieved relatively ideal results. The improved algorithm overcomes the problem of improper noise processing by traditional methods, and the disadvantage of rough image edge processing, so that the processed image has a clear viewing effect. In addition, the design is versatile and supports LCD panels from most manufacturers in the market, such as AU, PVI, Samsung, LG, Sharp, Panasonic, Toshiba and Foxconn. The design of the timing controller has been successfully streamed separately by SMIC018 process and integrated with Video Processor, which has been applied in portable DVD, car TV and other fields, hoping to provide theoretical significance for better medical image processing in practice and convenient people's life.
Based on the current research and design, further research can be made in the two aspects. First is considering the Gamma correction process, study how to adopt multiple Gamma curves on the same picture to improve the animation quality, and adjust the Gamma curves dynamically based on the image content and color temperature. The second aspect is considering for the research of halftone technology algorithm, the current domestic research and the algorithm mentioned in this paper only focus on the processing of gray scale image. Therefore, the same processing method is adopted for the three color channels of RGB. However, in fact, human eyes have different visual characteristics for different colors and different color Spaces. In the future work, we can combine color space transformation and human vision characteristics to study the color image halftone algorithm.
Funding information: The authors state no funding involved.
Author contributions: All authors have accepted responsibility for the entire content of this manuscript and approved its submission.
Conflict of interest: The authors state no conflict of interest.
References
[1] Li Y, Liu X, Liu Y. Adaptive local gamma correction based on mean value adjustment. In2015 Fifth International Conference on Instrumentation and Measurement, Computer, Communication and Control (IMCCC) 2015 Sep 18 (pp. 1858–1863). IEEE.10.1109/IMCCC.2015.395Search in Google Scholar
[2] Zhou M, Jin K, Wang S, Ye J, Qian D. Color retinal image enhancement based on luminosity and contrast adjustment. IEEE Transactions on Biomedical engineering. 2017 May 3;65(3):521–7.10.1109/TBME.2017.2700627Search in Google Scholar PubMed
[3] Tiwari M, Gupta B. Brightness preserving contrast enhancement of medical images using adaptive gamma correction and homomorphic filtering. In2016 IEEE Students’ Conference on Electrical, Electronics and Computer Science (SCEECS) 2016 Mar 5 (pp. 1–4). IEEE.10.1109/SCEECS.2016.7509287Search in Google Scholar
[4] Gupta B, Tiwari M. Minimum mean brightness error contrast enhancement of color images using adaptive gamma correction with color preserving framework. Optik. 2016 Feb 1;127(4):1671–6.10.1016/j.ijleo.2015.10.068Search in Google Scholar
[5] Gracheva I, Kopylov A. Image processing algorithms with structure transferring properties on the basis of gamma-normal model. InInternational Conference on Analysis of Images, Social Networks and Texts 2016 Apr 7 (pp. 257–268). Springer, Cham.10.1007/978-3-319-52920-2_24Search in Google Scholar
[6] Jin P. Model-based image processing algorithms for CT image reconstruction, artifact reduction and segmentation (Doctoral dissertation, Purdue University).Search in Google Scholar
[7] Ladkat AS, Date AA, Inamdar SS. Development and comparison of serial and parallel image processing algorithms. In2016 International Conference on Inventive Computation Technologies (ICICT) 2016 Aug 26 (Vol. 2, pp. 1–4). IEEE.10.1109/INVENTIVE.2016.7824894Search in Google Scholar
[8] Maggio VN, Iocchi L. Auto-SEIA: simultaneous optimization of image processing and machine learning algorithms. InSeventh International Conference on Machine Vision (ICMV 2014) 2015 Feb 14 (Vol. 9445, p. 94450X). International Society for Optics and Photonics.10.1117/12.2180688Search in Google Scholar
[9] Ran F, Wang LZ. FPGA Implementation for Image Processing Module in TCON. In2009 2nd International Congress on Image and Signal Processing 2009 Oct 17 (pp. 1–4). IEEE.10.1109/CISP.2009.5301236Search in Google Scholar
[10] Lu RS, Shi YQ, Li Q, Yu QP. AOI techniques for surface defect inspection. InApplied mechanics and Materials 2010 (Vol. 36, pp. 297–302). Trans Tech Publications Ltd.10.4028/www.scientific.net/AMM.36.297Search in Google Scholar
[11] Noh CH, Lee SL, Kim DH, Chung CW, Kim SH. An effective and efficient defect inspection system for TFT-LCD polarised films using adaptive thresholds and shape-based image analyses. International journal of production research. 2010 Sep 1;48(17):5115–35.10.1080/00207540903117899Search in Google Scholar
[12] Rajinikanth V, Couceiro MS. RGB histogram based color image segmentation using firefly algorithm. Procedia Computer Science. 2015 Jan 1;46:1449–57.10.1016/j.procs.2015.02.064Search in Google Scholar
[13] Kim H, Hwang SH, Park IC, Kyung CM. Digital signal processor with efficient RGB interpolation and histogram accumulation. IEEE Transactions on Consumer Electronics. 1998 Nov;44(4):1389–95.10.1109/30.735842Search in Google Scholar
[14] Elguebaly T, Bouguila N. Bayesian learning of finite generalized Gaussian mixture models on images. Signal Processing. 2011 Apr 1;91(4):801–20.10.1016/j.sigpro.2010.08.014Search in Google Scholar
[15] Oliveira H, Correia PL. CrackIT—An image processing toolbox for crack detection and characterization. In2014 IEEE international conference on image processing (ICIP) 2014 Oct 27 (pp. 798–802). IEEE.10.1109/ICIP.2014.7025160Search in Google Scholar
[16] Huang JY, Chou TC, Lee GG. Imitative innovation strategies: understanding resource management of competent followers. Management Decision. 2010 Jun 29.10.1108/00251741011053488Search in Google Scholar
[17] Chochia PA. Transition from 2D-to 3D-images: Modification of two-scale image model and image processing algorithms. Journal of Communications Technology and Electronics. 2015 Jun;60(6):678–87.10.1134/S1064226915060054Search in Google Scholar
[18] Bellavia F, Colombo C. Dissecting and reassembling color correction algorithms for image stitching. IEEE Transactions on Image Processing. 2017 Sep 27;27(2):735–48.10.1109/TIP.2017.2757262Search in Google Scholar PubMed
[19] Oliva D, Cuevas E. Advances and applications of optimised algorithms in image processing. Springer International Publishing; 2017.10.1007/978-3-319-48550-8Search in Google Scholar
[20] Di Febbo P, Mattoccia S, Dal Mutto C. Real-time image distortion correction: Analysis and evaluation of FPGA-compatible algorithms. In2016 International Conference on ReConFigurable Computing and FPGAs (ReConFig) 2016;Dec:1–6. IEEE.10.1109/ReConFig.2016.7857182Search in Google Scholar
© 2021 Liyuan Yan et al., published by De Gruyter
This work is licensed under the Creative Commons Attribution 4.0 International License.
Articles in the same Issue
- Nonlinear absolute sea-level patterns in the long-term-trend tide gauges of the East Coast of North America
- Insight into the significance of Joule dissipation, thermal jump and partial slip: Dynamics of unsteady ethelene glycol conveying graphene nanoparticles through porous medium
- Numerical results for influence the flow of MHD nanofluids on heat and mass transfer past a stretched surface
- A novel approach on micropolar fluid flow in a porous channel with high mass transfer via wavelet frames
- On the exact and numerical solutions to a new (2 + 1)-dimensional Korteweg-de Vries equation with conformable derivative
- On free vibration of laminated skew sandwich plates: A finite element analysis
- Numerical simulations of stochastic conformable space–time fractional Korteweg-de Vries and Benjamin–Bona–Mahony equations
- Dynamical aspects of smoking model with cravings to smoke
- Analysis of the ROA of an anaerobic digestion process via data-driven Koopman operator
- Lie symmetry analysis, optimal system, and new exact solutions of a (3 + 1) dimensional nonlinear evolution equation
- Extraction of optical solitons in birefringent fibers for Biswas-Arshed equation via extended trial equation method
- Numerical study of radiative non-Darcy nanofluid flow over a stretching sheet with a convective Nield conditions and energy activation
- A fractional study of generalized Oldroyd-B fluid with ramped conditions via local & non-local kernels
- Analytical and numerical treatment to the (2+1)-dimensional Date-Jimbo-Kashiwara-Miwa equation
- Gyrotactic microorganism and bio-convection during flow of Prandtl-Eyring nanomaterial
- Insight into the significance of ramped wall temperature and ramped surface concentration: The case of Casson fluid flow on an inclined Riga plate with heat absorption and chemical reaction
- Dynamical behavior of fractionalized simply supported beam: An application of fractional operators to Bernoulli-Euler theory
- Mechanical performance of aerated concrete and its bonding performance with glass fiber grille
- Impact of temperature dependent viscosity and thermal conductivity on MHD blood flow through a stretching surface with ohmic effect and chemical reaction
- Computational and traveling wave analysis of Tzitzéica and Dodd-Bullough-Mikhailov equations: An exact and analytical study
- Combination of Laplace transform and residual power series techniques to solve autonomous n-dimensional fractional nonlinear systems
- Investigating the effects of sudden column removal in steel structures
- Investigation of thermo-elastic characteristics in functionally graded rotating disk using finite element method
- New Aspects of Bloch Model Associated with Fractal Fractional Derivatives
- Magnetized couple stress fluid flow past a vertical cylinder under thermal radiation and viscous dissipation effects
- New Soliton Solutions for the Higher-Dimensional Non-Local Ito Equation
- Role of shallow water waves generated by modified Camassa-Holm equation: A comparative analysis for traveling wave solutions
- Study on vibration monitoring and anti-vibration of overhead transmission line
- Vibration signal diagnosis and analysis of rotating machine by utilizing cloud computing
- Hybrid of differential quadrature and sub-gradients methods for solving the system of Eikonal equations
- Developing a model to determine the number of vehicles lane changing on freeways by Brownian motion method
- Finite element method for stress and strain analysis of FGM hollow cylinder under effect of temperature profiles and inhomogeneity parameter
- Novel solitons solutions of two different nonlinear PDEs appear in engineering and physics
- Optimum research on the temperature of the ship stern-shaft mechanical seal end faces based on finite element coupled analysis
- Numerical and experimental analysis of the cavitation and study of flow characteristics in ball valve
- Role of distinct buffers for maintaining urban-fringes and controlling urbanization: A case study through ANOVA and SPSS
- Significance of magnetic field and chemical reaction on the natural convective flow of hybrid nanofluid by a sphere with viscous dissipation: A statistical approach
- Special Issue: Recent trends and emergence of technology in nonlinear engineering and its applications
- Research on vibration monitoring and fault diagnosis of rotating machinery based on internet of things technology
- An improved image processing algorithm for automatic defect inspection in TFT-LCD TCON
- Research on speed sensor fusion of urban rail transit train speed ranging based on deep learning
- A Generalized ML-Hyers-Ulam Stability of Quadratic Fractional Integral Equation
- Study on vibration and noise influence for optimization of garden mower
- Relay vibration protection simulation experimental platform based on signal reconstruction of MATLAB software
- Research on online calibration of lidar and camera for intelligent connected vehicles based on depth-edge matching
- Study on fault identification of mechanical dynamic nonlinear transmission system
- Research on logistics management layout optimization and real-time application based on nonlinear programming
- Complex circuit simulation and nonlinear characteristics analysis of GaN power switching device
- Seismic nonlinear vibration control algorithm for high-rise buildings
- Parameter simulation of multidimensional urban landscape design based on nonlinear theory
- Research on frequency parameter detection of frequency shifted track circuit based on nonlinear algorithm