Infra-sound cancellation and mitigation in wind turbines
-
Albert Boretti
 ,
Andrew Ordys
,
Andrew Ordys

Abstract
The infra-sound spectra recorded inside homes located even several kilometres far from wind turbine installations is characterized by large pressure fluctuation in the low frequency range. There is a significant body of literature suggesting inaudible sounds at low frequency are sensed by humans and affect the wellbeing through different mechanisms. These mechanisms include amplitude modulation of heard sounds, stimulating subconscious pathways, causing endolymphatic hydrops, and possibly potentiating noise-induced hearing loss. We suggest the study of infra-sound active cancellation and mitigation to address the low frequency noise issues. Loudspeakers generate pressure wave components of same amplitude and frequency but opposite phase of the recorded infra sound. They also produce pressure wave components within the audible range reducing the perception of the infra-sound to minimize the sensing of the residual infra sound.
1 Introduction
Sound is the propagation of pressure waves through compressible fluids such as air, but also incompressible fluids and solids. Sound waves are often simplified to a description in terms of sinusoidal plane waves, characterized by their frequency, the inverse of the period, and the amplitude. Sound that is sensed by human ears was believed to have only frequencies from 20 Hz to 20,000 Hz of pressure waves travelling in air at standard temperature and pressure. Sound pressure level is a measure of the pressure amplitude in the sound wave and the local pressure. The sound pressure level (SPL) is defined as 10 times the logarithm in base 10 of (p2/pref2), where p is the root-mean-square of the sound pressure fluctuation and pref is the reference sound pressure, and it is measured in decibel (dB).
Acoustic, from the Greek word akoustos meaning audible, that is the theory of propagation of sound waves, in principle includes the analysis of vibration, sound, ultrasound and infra sound. However, as hearing and speech are two of the most distinctive, interrelated, characteristics of humans, acoustic has been mostly focused on the study of pressure waves travelling in air with frequencies within the audible range of human ears, from 20 Hz to 20,000 Hz. Frequencies above and below the audible range are called ultrasonic and infrasonic, respectively.
Since the human ear does not have a flat spectral response, a recorded sound pressure level spectrum vs. frequency is unfortunately often frequency weighted when focusing on unwanted sounds or noise. The A-weighting is a simple approximation of the human hears sensitivity. The approximation was obtained for pure tones – i.e. a pressure wave of one single frequency – and very small amplitudes. This weighting basically overrates the sound pressure levels in the range of frequencies 1,000 to 7,000 Hz and tends to cancel the effects of pressure fluctuations occurring at other frequencies. The contribution of the sound pressure levels of frequencies below 1,000 Hz is then reduced, with everything below 20 Hz filtered out. Similarly, above 7,000 Hz, the contribution of sound pressure levels reduces approaching the 20,000 Hz and above 20,000 Hz, the A-weighting is simply undefined. The A-weighted sound pressure level is measured in dBA.
Other weightings as B-, C- of D- weightings have been around for years to better cover especially the low frequency sound pressure levels, and the effects on humans of pressure waves are certainly not simply detectable by global filtered averaging.
The dogmatic use of the A-weighting for environmental measurements to dismiss the claims of health issues due to the pressure waves produced by wind farm installations is everything but acceptable, but this is the ongoing practice.
In the following sections, we will show typical noise spectra recorded within homes nearby wind farm installations. We will then discuss the human perception of the low frequency noise. Finally, we will examine the opportunity to cancel and mitigate the infra-sound.
2 Typical noise spectra within homes
The typical signature of a wind turbine is a sound pressure level vs. frequency curve with the sound pressure level generally increasing by reducing the frequency up to values even more than 100 dB at low frequencies and in the infra sound. If the traditional A-weighted measurement of the noise does not properly account for the large pressure wave fluctuations in the infra-sound and the low end of the audible range, not necessarily this means there is no opportunity for humans to sense these sounds.
Images in Figure 1, courtesy of Rickard James (personal communication, email of August 9, 2015) present the sound pressure levels vs. frequency inside houses several kilometers away from a wind turbine installation. a) is a sample sound pressure level vs. frequency in the infra-sound and lower frequency audible ranges recorded at a given time. b) are the contours of recorded sound pressure levels vs. frequency and time in the lower infra sound. When the turbines are on, the infra-sound is much more intense than when the turbines are off, as the naturally occurring infra-sound is usually minimal. The sound pressure level spectrum is not constant but subject to fluctuations of different time scales. As shown in figure a), the fluctuation in the amplitude may be significant vs. the average value especially for the lower frequencies. Several harmonics are clearly evidenced in the contours. Within homes located at distance of several kilometers from the wind farm, humans may therefore still be exposed to continuous infra-sound and lower frequency audible sounds with sound pressure levels of considerable intensity 24 hours a day, 7 days a week.
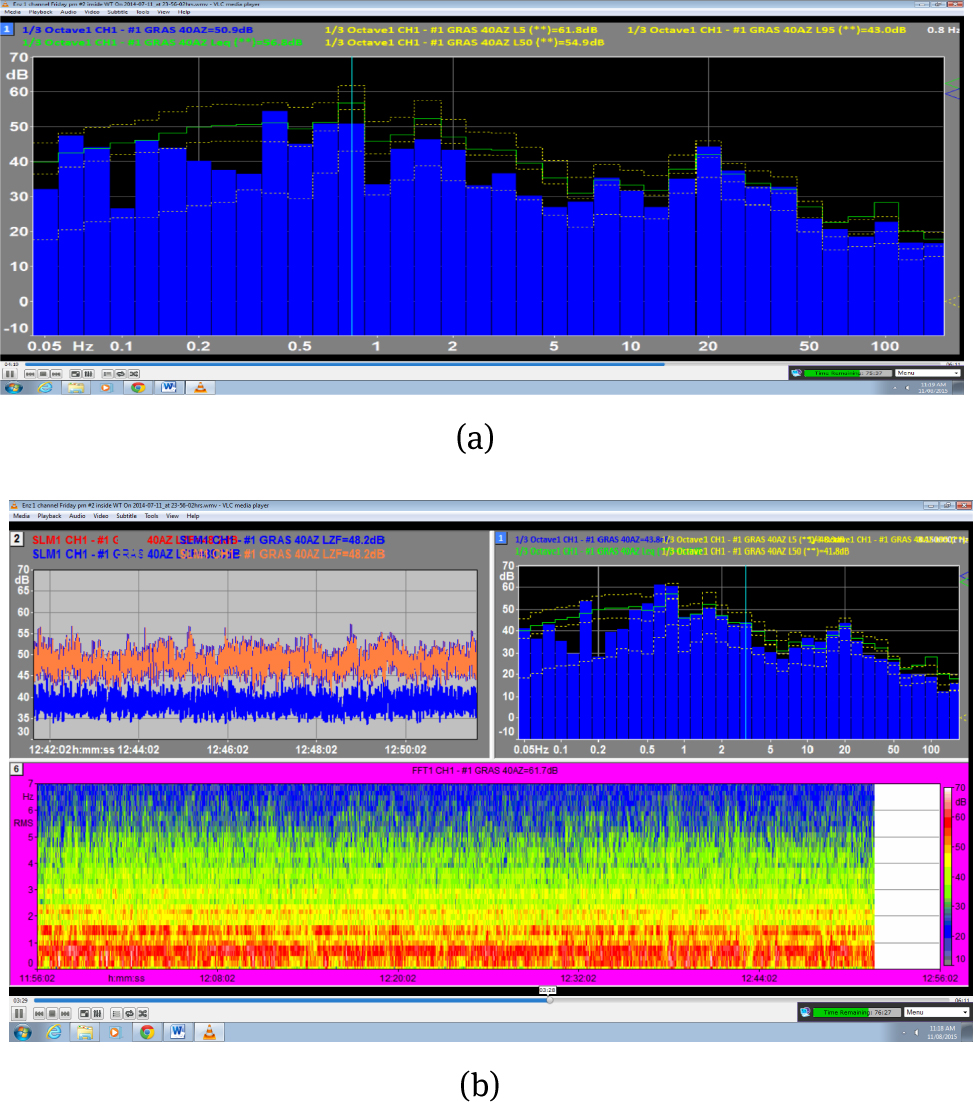
Sample sound pressure levels recorded inside houses several kilometers away from wind farms (Rick James, personal communication, October 2015). a) Sample sound pressure level (SPL) in dB vs. frequency in Hz for the infra-sound and lower frequency audible ranges recorded at a given time. b) Contours of recorded SPL in dB vs. frequency in Hz and time (time window of one hour, from 11:56 to 12.56).
Recording of the infra-sound produced by wind farm installation requires micro barometers rather than traditional microphones, and the recorded signal has not to be filtered with the A-weighting procedure. The A-weighting is a filter applied in effort to account for the relative loudness perceived by the human ear less sensitive to low frequencies. Although formerly intended only for the measurement of low level sounds, this filter is now used for the measurement of environmental noise, even though it is badly suited for these purposes. The A-weighting devalues the effects of low frequency noise, and completely filter out every pressure fluctuation that may occur below 20 Hz.
As the A-weighted measurement is only a conventional expression of the relative loudness of sounds as perceived by the human ear, this overrates the importance of the sound pressure level about the center of the audible range, but underrates the sound pressure level approaching the infra-sound or the ultrasound, and filters out every component with a frequency lower or higher than threshold values. This approach brings to the absurd that any pressure wave whatever is the amplitude should have no influence on humans if occurring at frequencies below or above the threshold.
Regarding the recording of the infra-sound signal, most of the infra-sound pressure fluctuations within homes nearby wind farms are characterized by an amplitude of less than 1 Pa. The highest and lowest pressures inside a home are generally within the ± 5 Pa range. Products such as the Infiltec INFRA-20 [30] have a resolution 0.001 Pa over the range of ± 25 Pa at 50 samples per second. This covers sound pressure levels from 30 to over 100 dB with a frequency pass-band of 0.05 Hz to 20.0 Hz bandwidth. These instruments are used for the records of Figure 1.
The noise generated by wind turbines is therefore rather unusual, containing high levels (over 90 dB SPL) of very low frequency sound (infrasound) as also shown by [3] and [36].
3 Human perception of low frequency noise
In the last few decades, the expansion of renewable energy installations has translated in the displacement of more and more wind farms, and many citizens living nearby the wind turbines have claimed health issues related to the presence of the turbines, mostly because of the wind turbine noise.
As the analysis of the pressure waves produced by the wind farm installations revealed low A-weighted sound pressure levels, i.e. only small amplitude of the pressure waves within the classic audible range of frequencies, some quickly dismissed these claims, downplaying the fact that significant sound pressure levels where conversely very evident in the infra-sound [1,2,3].
As infra-sound designates very low frequency sounds, below the thought limit of hearing, which is around 20 hertz, the wind energy sector and the authorities tend to declare that the sounds generated are inaudible and much too weak to be the source of health problems. However, others supported the claims that inaudible sounds at low frequency are very strong in terms of sound pressure level and may be sensed by humans affecting wellbeing through different mechanisms, including amplitude modulation of heard sounds, stimulating subconscious pathways, causing endolymphatic hydrops, potentiating noise-induced hearing loss.
There is a significant literature that explains the reasons why the wind turbine infra-sound may translate in health issues for the peoples living nearby wind farm installations thus confirming the subjective claims by thousands of citizens worldwide [4,5,6,7,8,9,10,11,12,13,14,15,16,17,18,19,20,21,22,23,24,25,26,27,28,29].
An international team of experts, part of the European Metrology Research Programme (EMRP) coordinated by the Physikalisch-Technische Bundesanstalt (PTB) and involving excellent research centers as the Max Planck Institut für Bildungsforschung (MPI) has now dealt with the fundamentals of hearing in the lower limit range of the audible frequency range (infra sound, below approx. 16 hertz), but also in the upper limit range (above approx. 16 000 hertz) [31].
Experts of acoustics, bio magnetism (MEG) and functional magnetic resonance imaging (fMRI) have found out that humans can hear sounds lower than what had been previously assumed, and that different areas of the human brain react to sounds of different frequencies. An infrasonic source of sounds that are free from harmonics was constructed. Trial persons were asked about their subjective hearing experience. Their statements were compared with results of magneto encephalography (MEG) and functional magnetic resonance imaging (fMRI).
The results show that excitation of the primary auditory cortex is detectable from 8 hertz on, which is an octave less than what has been assumed so far. All the trial persons affirmed that they heard something whereas the observations showed a reaction in certain parts of the brain playing a role in emotions. Different parts of the brain were shown to react to different frequencies of sound. Figure 2 (courtesy Christian Kock, Physikalisch-Technische Bundesanstalt (PTB)) shows the sample activation of auditory cortex during stimulation of the ear by low-frequency sound and infra sound. The figure shows the areas of the brain stimulated by the simple sounds generated at the given frequencies.
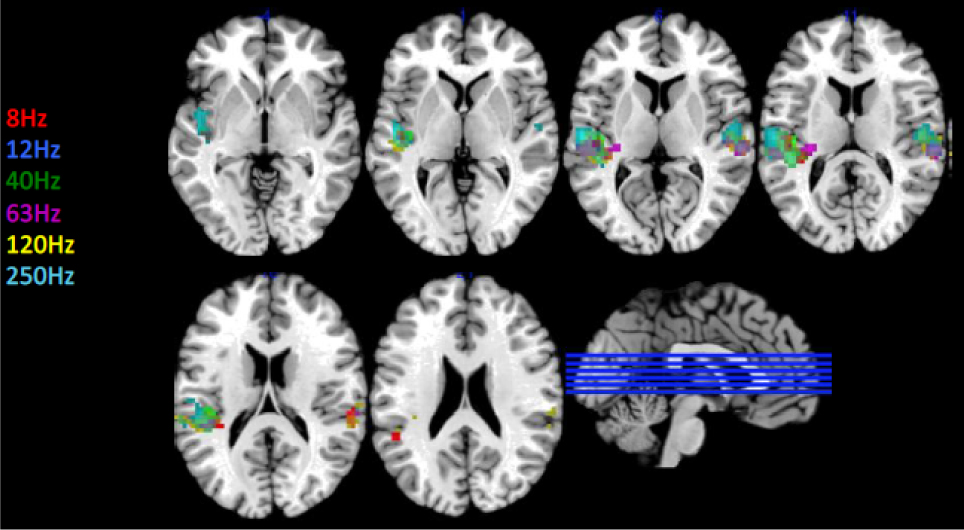
Sample activation of auditory cortex during stimulation of the ear by low-frequency sound and infra-sound (courtesy of Christian Kock, Physikalisch-Technische Bundesanstalt (PTB)). The brain activation at stimulus frequencies between 8 Hz and 250 Hz is detected by using fMRI images in various sectional planes through the brain.
While the mechanisms of pressure waves’ perception appear to be much more complex than previously thought, the results of [4,5,6,7,8,9,10,11,12,13,14,15,16,17,18,19,20,21,22,23,24,25,26,27,28,29] and [31] prove that the A-weighting approach to compute nuisance of pressure waves filtering out the low and high frequencies is incorrect. As it appears that sounds of small amplitudes and short application times are sensed by the brain down to frequencies as low as 8 Hz, the logic evolution of the experiments undertaken in [31] is to include the effects of amplitude and duration of the generated pressure wave on the human response.
Humans may indeed sense much more than what is then recognized as sound. The ear is sensitive and responds to low frequency pressure fluctuations at levels that are not heard. In addition, the low frequency pressure fluctuations modulate the cochlear response to higher frequency pressure fluctuations.
As shown in [32], the human audibility curve is characterized by a sound pressure level (SPL) in dB that increases reducing the frequency, from values of very few dB at 1000 Hz to values of more than 70 dB at 20 Hz. Within the infra sound, the audibility only requires higher SPL, for example 100 dB at 10 Hz.
If we accept the fact that there may be some analogy in between the hearing of guinea pig and humans, as proved by electrical recording from the guinea pig ear through cochlear micro phonic sensors, the outer hair cells of the ear respond to infra-sound stimuli at moderate levels below the audibility curve and outer hair cell responses to infra-sound are maximal when ambient sound levels are low [33].
The most part of the papers reviewed in the present literature survey of the effects of wind farm noise are from the medical sector. As also synthetically shown in http://oto2.wustl.edu/cochlea/, there is indeed a significant body of evidence in the medical sector that the high amplitude low frequency fluctuations may create health issues. It is therefore certain that the low frequency noise deserves further investigations.
4 Is There an Opportunity to Cancel and Mitigate Infra sound?
If the low frequency noise is an issue, role of engineers is to properly monitor the issue, and eventually find a solution through cancellation and/or mitigation.
Anti-sound is certainly not a novelty [34]. Anti-sound devices work by analyzing the sound waves recorded from an array of microphones and generating sound waves from an array of speakers that are exactly same amplitudes and frequencies but out of phase to cancel the sound waves within a given enclosed volume. For sake of simplicity, every noise may be approximated as the sum of n sinusoidal pressure waves of the form:
with Ak, ωk and φk the amplitude, frequency and phase of the k component. The active sound cancellation device emits sound of same amplitude and frequency but opposite phase of the recorded infra-sound φk +π.
Problem of the technique, the instantaneous incoming sound may differ considerably from the instantaneous generated sound, and therefore the noise may be reduced but not completely cancelled. It is indeed nearly impossible to reproduce a wind farm waveform using speakers or other devices, as reproducing the accurate infra-sound waveforms that respects the original phase relationships and rapid pressure changes has already proven to be extremely challenging, even if not reported yet in the literature. As the creation of an active anechoic chamber, apart from being difficult, is not even wanted, as humans do not like such quietness even worse than they do not like the high amplitude infra sound, there is therefore the need to carefully shape the sound spectra by cancellation and mitigation, where mitigation refers to the generation of sounds in the audible frequency range to improve well-being.
While by applying the same anti sound concept including the frequencies lower than the classic audible (i.e. below 20 Hz) is not certainly a novelty, it is an innovation of the Wind Farm Infra-sound Active Cancellation and Mitigation device proposed in [?] to record the infra-sound pressure fluctuations with appropriate devices, micro barometers more than classic microphones, and generate about same amplitudes and frequencies but opposed phase infra-sound pressure fluctuations, and additionally to generate sound pressure fluctuations to reduce the sensing of the residual infra-sound and improve well-being.
The proposed device builds on the following principles:
For every frequency ω, there is one audible amplitude A.
By reducing the frequency ω the amplitude A for audibility increases.
Humans may sense sounds of amplitudes below what they hear.
Infra sounds may be sensed if the amplitudes are large enough.
The sensing of every individual component in a pressure wave train is not independent.
A pressure fluctuation of a given amplitude in the classic audible range > 20 Hz may reduce the sensing of a pressure fluctuation of larger amplitude in the infra-sound range < 20 Hz.
Figure 3 presents the principle of this active infra-sound cancellation and mitigation device.
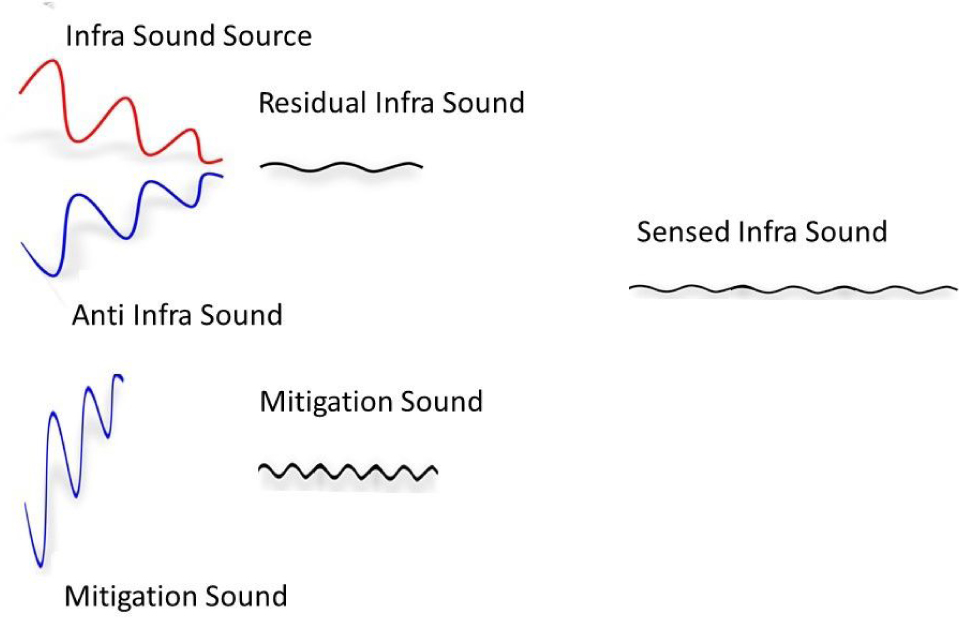
Principle of the active infra-sound cancellation and mitigation device. The amplitudes of the residual infra-sound components are reduced. Small amplitude mitigation sounds further reduce their sensing by humans.
An array of devices controlled by a single control unit is needed to mitigate the infra-sound perception in a room. The active infra-sound cancellation and mitigation device targets the reduction of the infra-sound and the further reduction of the residual infra-sound sensing by producing anti infra-sound plus sound of very low amplitude that mask the residual infra-sound and improve wellbeing.
Regarding active noise control, two methods are prominent in active noise control: feedforward and feedback. The feedforward method is relevant to situation when the noise can be measured at the source, for instance, close to the rotating machinery. Next, a model is developed, to calculate how this noise will be received at the point of interest. This is normally achieved by means of a transfer function. Because the noise which is measured is sampled at specified time intervals (sampling time), it is suitable to use discrete time models and a transfer function based on Laurent transformation:
Where z is the time shift operator, i.e. z–1 shifts the original signal backwards by one sample time and k is the time delay – propagation time between the measuring device and the point of interest. This latter can normally be assumed to equal the distance divided by speed of sound. The polynomials: A(z–1) and B(z–1) represent respectively the moving average and auto-regressive parts of the transfer function model.
It is noted that the model may be an approximate representation of the noise path, hence the symbol
Next, a system of noise cancellation is constructed based on the diagram in Figure 4.
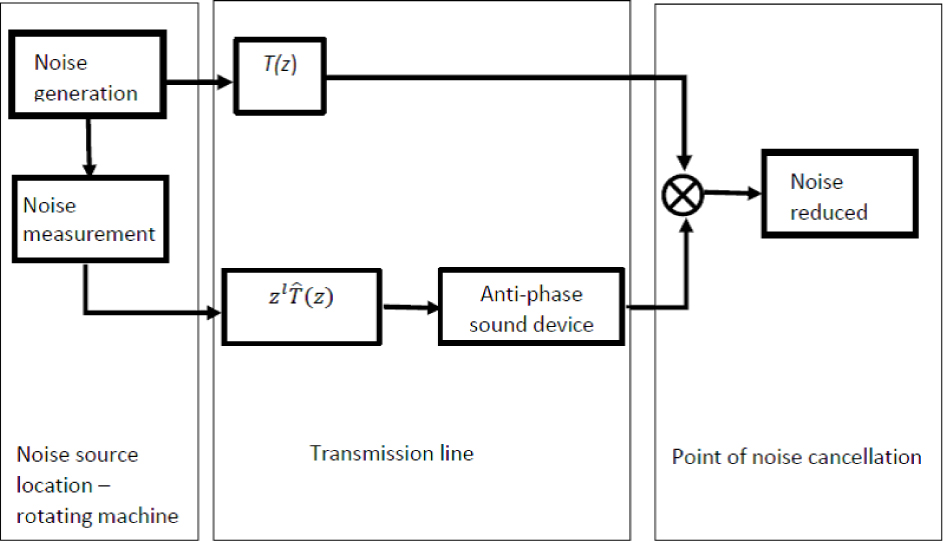
Feedforward noise cancellation.
The estimated transfer function must be multiplied by zl (shift forward the signal by l samples), where l represents the signal’s processing time. If l<k this does not cause problems. When l>k a prediction of future signal values would need to be used, which would reduce accuracy of cancellation.
If the noise generated by the rotating machine is described by a time-series n(t) which is transformed to Z-domain as n(z), and if there is an ideal anti-phase filter, the noise at the point of cancellation nc(z) is given by the equation:
The quality of noise cancellation will depend on the accuracy of estimating the noise path transfer function. The power spectral density of the reduced noise signal nc (t) can be easily calculated from the above equation as:
If the noise cannot be measured at the source but, instead, is measured at the point of interest (the noise cancellation point) an active noise control feedback algorithm, as presented in Figure 5, can be considered.
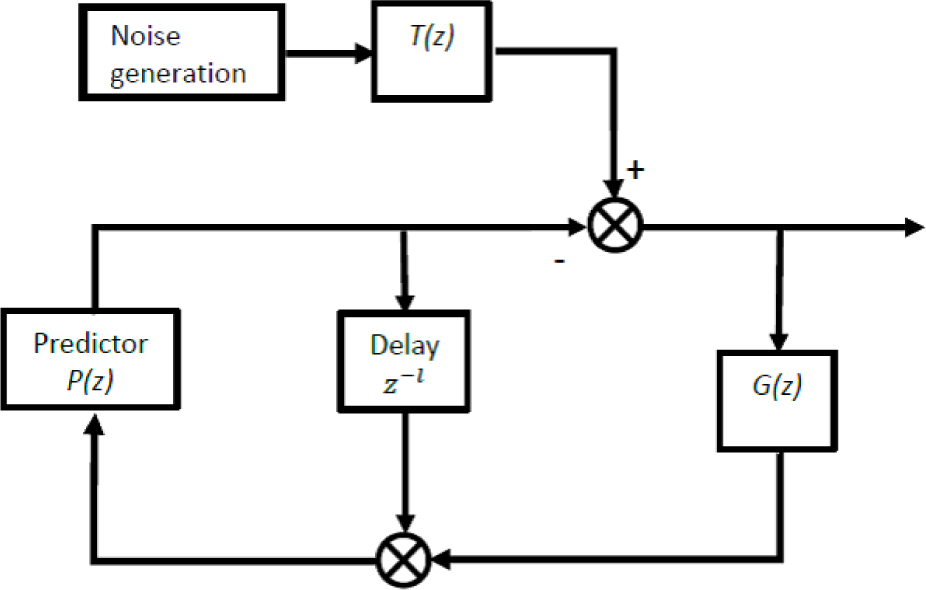
Feedback noise cancellation.
In this approach, the signal is measured at the point of interest. When it is measured, it is already too late to counteract it. Hence, instead, a predictor is used, which calculates the value of signal l steps ahead (l is the processing time of the predictor – expressed as the number of samples). Then, the anti-phase device will apply the inverse of the predicted signal at the exact time when the actual signal appears at the point of interest (measuring device). The transfer function between the noise and the noise at the point of cancellation, based on Figure 5 is:
where G(z) represents the transfer function of the measuring device.
Note that, in equation (9) the term: T(z)n(z) represents the noise arriving at the measuring device if no noise cancellation algorithm is applied. The equation above will enable calculation of power spectral density of the signal nc(z).
In the predictor design, for simplicity, we may assume that the predictor is a finite impulse response (FIR) system, hence defined by the equation:
or, in Z-domain:
where u is the input signal to the filter, hence equals:
The task is to design/select the coefficients hi, i = 0, 1, …, r, so that after substituting to the transfer function in equation (9) the power spectral density of the reduced noise signal is minimized.
As an example of applying feedback noise cancellation, the infrasound recorded by using micro-barometer described in [30] has been used here for illustration purposes. Data are courtesy of Rickard James (personal communication, email of February 19, 2016). Here, the reading of micro-barometer has not been converted to decibels, instead the original readings in millipascal are used. The algorithm presented in Figure 5 has been applied for noise cancellation.
In the simulation, the readings from the micro-barometer represent the noise arriving at the measuring point when no cancellation is applied, i.e. T(z)n(z). The transfer function of the measuring device (micro-barometer) is assumed to be a one-sample time delay, i.e. G(z) = z–1, and a zero-order FIR predictor is used. The infrasound was applied to the noise cancellation system step by step, with sampling rate of 50 Hz. The attenuated signal was recorded as a time series. Next, the square root of the signal’s power has been calculated, for both the original signal and the attenuated signal.
This was done in batches of the width of k samples, from the beginning to the end of the time series. Two values of k were used – for comparison: k = 100, i.e. power is calculated every two seconds and K = 5,000, i.e. power is calculated every 100 seconds. Figure 6 presents results for k = 5,000. The first part of the figure is the original signal, the second part is the attenuated signal and, finally, two signals are compared on the third part. Similar layout is used in Figure 7, which shows results for 100 seconds. It can be seen than, for this noise signal, approximately ten-fold attenuation can be obtained with a relatively simple feedback noise control design. The result is very similar, regardless how many samples are used for the calculation of the power. Further improvements would be perhaps possible with more advanced filter design, but this would require a more detailed study of the actual noise signal.
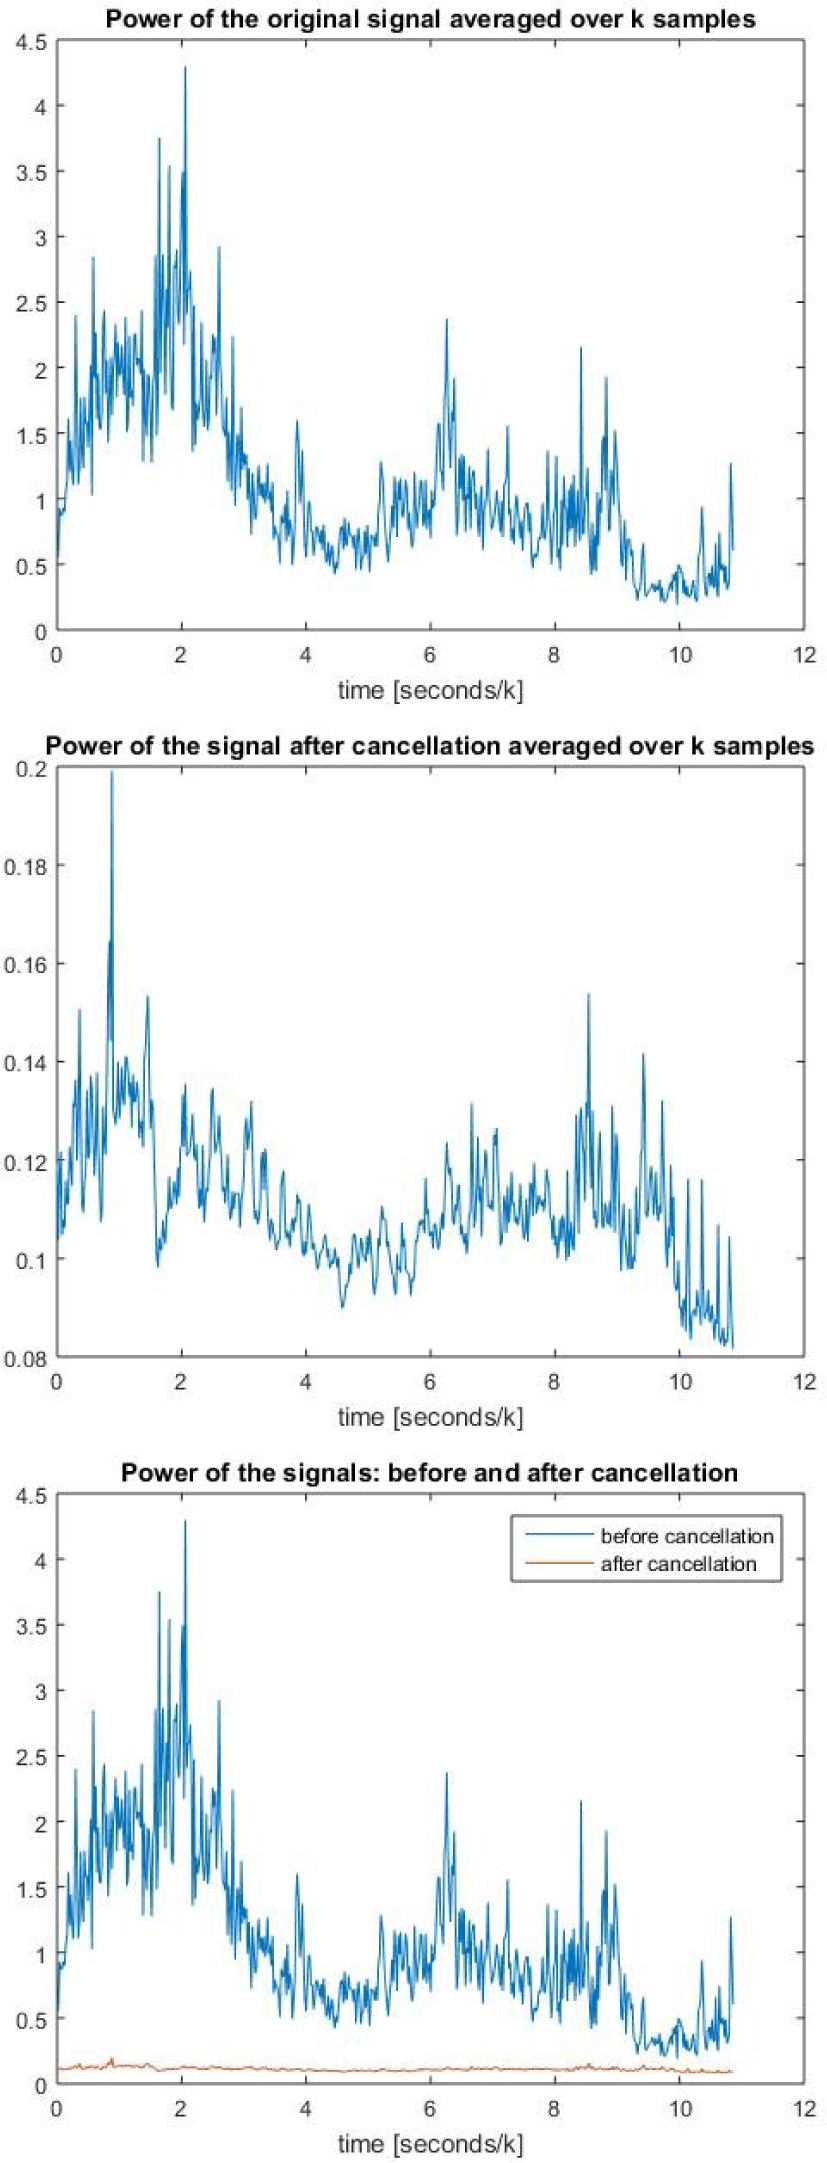
Illustration of power before and after cancellation, for an example of infra-sound noise signal. Power calculated every 100 seconds.
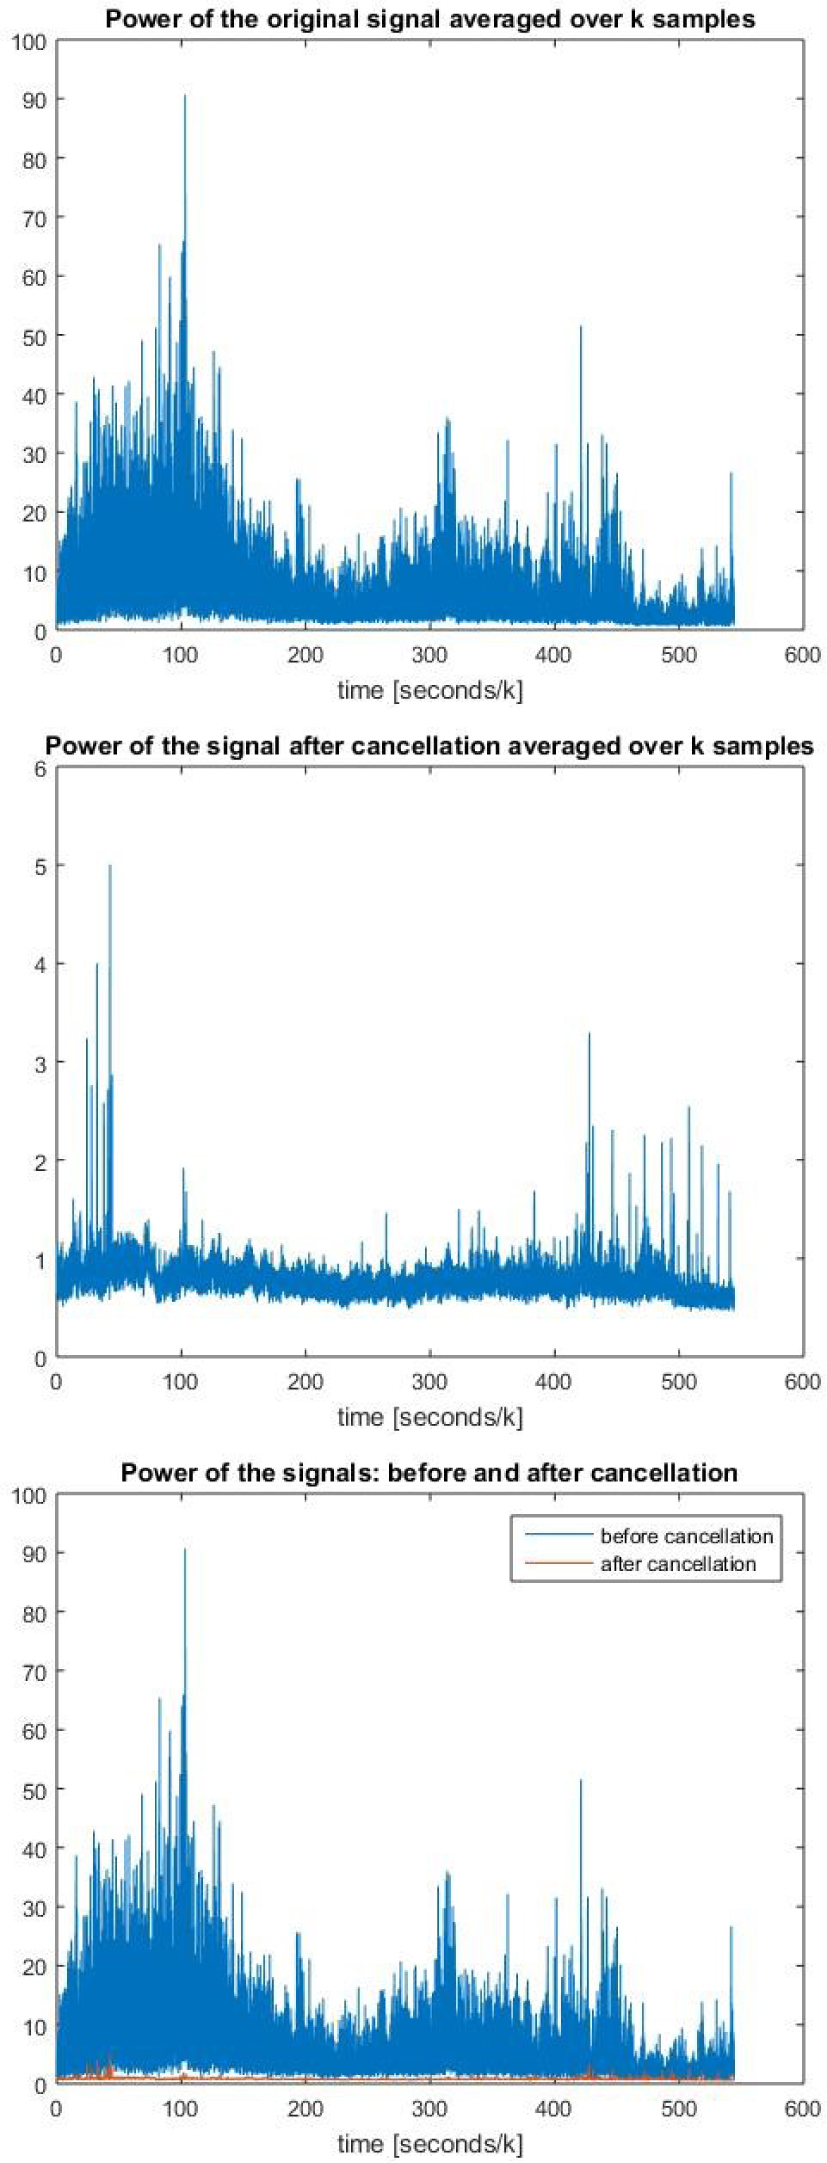
Illustration of power before and after cancellation, for an example of infra-sound noise signal. Power calculated every 2 seconds.
The mathematic of the filtering algorithm is intentionally oversimplified to humbly show that there may be a solution to low frequency noise cancellation. It is however very unlikely that the cancellation will completely remove all the low frequency noise. In this case, mitigation of the residual infrasound is needed.
5 Discussion and Conclusions
The health issues of wind turbines related to pressure waves undoubtedly deserve more attention that what is presently accepted. Inside houses, where the audible sound of wind turbines is blocked by the walls, but the infra sound, that is still sensed by humans, readily passes through even tiny openings, the continuous exposure to infra-sound that many citizens have claimed to give them health issues should be taken more seriously.
In addition to better assess the health effects of the exposure over long time scales to low frequency high amplitude pressure fluctuations, there is certainly a scope to introduce active noise cancellation & mitigation techniques. An array of loudspeakers may indeed generate pressure wave components of same amplitude and frequency but opposite phase of the infra-sound recorded by an array of microphones and micro barometers. In addition, the loudspeakers may also produce pressure wave components within the audible range of frequencies to further reduce the sensing of the infra-sound residual components. This may objectively and subjectively improve the well-being of humans living nearby wind farm installations.
There is a need of further investigations of the human perception of low frequency noise of different amplitudes mixed to higher frequency sounds also of variable amplitude. There is definitively a need of further studies to better identify connections between health and wind turbine installations, and explore possible objective and subjective solutions including cancellation and mitigation.
References
[1] Hubbard, H. H., Grosveld, F W & Shepherd, K P., “Noise characteristics of large wind turbine generators,” Noise Control Engineering Journal. Vol.21, pp. 21–29, 198310.3397/1.2827611Search in Google Scholar
[2] Hubbard, H. H. & Shepherd, K. P., “Aeroacoustics of large wind turbines”, J. Acoust. Soc. Am., Vol. 89, No. 6, pp. 2495–2508, 1991.10.1121/1.401021Search in Google Scholar
[3] Jung, S. S. & Cheung, W., “Experimental identification of acoustic emission characteristics of large wind turbines with emphasis on infra-sound and low-frequency noise,” J Korean Physic Soc., Vol. 53, pp. 1897–1905, 2008.10.3938/jkps.53.1897Search in Google Scholar
[4] Salt, A. & Hullar, T. E., “Responses of the ear to low frequency sounds, infra-sound and wind turbines,” Hearing Research, Vol. 268, No. 1–2, pp. 12–21, 2010.10.1016/j.heares.2010.06.007Search in Google Scholar PubMed PubMed Central
[5] Salt, A. N. & Kaltenbach, J. A., “Infrasound From Wind Turbines Could Affect Humans,” Bulletin of Science Technology Society, Vol. 31, No. 4, pp. 296–302, 2011.10.1177/0270467611412555Search in Google Scholar
[6] Taylor, J., Eastwick, C., Wilson, R. & Lawrence, C., “The influence of negative oriented personality traits on the effects of wind turbine noise,” Personality and Individual Differences, Vol. 54, No. 3, pp. 338–343, 2013.10.1016/j.paid.2012.09.018Search in Google Scholar
[7] Nissenbaum, M. A., Aramini, J. J. & Hanning, C.D., “Effects of industrial wind turbine noise on sleep and health,” Noise & Health, Vol. 14, No. 60, pp. 237–243, 201210.4103/1463-1741.102961Search in Google Scholar PubMed
[8] Bolin, K. et al., “Infrasound and low frequency noise from wind turbines: exposure and health effects,” Environ. Res. Lett., Vol. 6, art. No. 035103. 2011.10.1088/1748-9326/6/3/035103Search in Google Scholar
[9] Shepherd, D., McBride, D., Welch, D., Dirks, K. N. & Hill, E. M., “Evaluating the impact of wind turbine noise on health-related quality of life,” Noise & Health, Vol. 13, No. 54, pp. 333–339, 2011.10.4103/1463-1741.85502Search in Google Scholar PubMed
[10] Møller, H. & Pedersen, C.S., “Low-frequency noise from large wind turbines,” J. Acoust. Soc. Am. Vol. 129, No. 6, pp. 3727– 3744, 2011.10.1121/1.3543957Search in Google Scholar PubMed
[11] Harrison, J.P., “Wind Turbine Noise,” Bulletin of Science Technology Society, Vol.31, No. 4, pp. 256–261, 2011.10.1177/0270467611412549Search in Google Scholar
[12] Thorne, B., “The Problems With “Noise Numbers” for Wind Farm Noise Assessment,” Bulletin of Science Technology Society, Vol.31, No.4, pp. 262–290, 2011.10.1177/0270467611412557Search in Google Scholar
[13] Bronzaft, A.L., “The Noise From Wind Turbines: Potential Adverse Impacts on Children’s Well-Being,” Bulletin of Science Technology Society, Vol. 31, No.4, pp. 291–295, 2011.10.1177/0270467611412548Search in Google Scholar
[14] Pedersen, E., van den Berg, F., Bakker, R. & Bouma, J., “Response to noise from modern wind farms in The Netherlands,” J Acoust Soc Am., Vol. 126, pp. 634–643, 2009.10.1121/1.3160293Search in Google Scholar PubMed
[15] Pedersen, E. & Persson Waye, K., “Perception and annoyance due to wind turbine noise–a dose-response relationship,” J Acoust Soc Am., Vol. 116, pp. 3460–3470, 2004.10.1121/1.1815091Search in Google Scholar PubMed
[16] Pedersen, A. & Persson Waye, K., “Wind turbine noise, annoyance and self-reported health and well-being in different living environments,” Occup Environ Med., Vol. 64, pp. 480–486, 2007.10.1136/oem.2006.031039Search in Google Scholar PubMed PubMed Central
[17] Phillips, C.V., “Properly Interpreting the Epidemiologic Evidence About the Health Effects of Industrial Wind Turbines on Nearby Residents,” Bulletin of Science Technology Society, Vol. 31, No. 4, pp. 303–315, 2011.10.1177/0270467611412554Search in Google Scholar
[18] McMurtry, R. Y., “Toward a Case Definition of Adverse Health Effects in the Environs of Industrial Wind Turbines: Facilitating a Clinical Diagnosis,” Bulletin of Science Technology Society, Vol. 31, No. 4, pp. 316–320, 2011.10.1177/0270467611415075Search in Google Scholar
[19] Krogh, C. M. E., “Industrial Wind Turbine Development and Loss of Social Justice?,” Bulletin of Science Technology Society, Vol.31, No. 4, pp. 321–333. 2011.10.1177/0270467611412550Search in Google Scholar
[20] Krogh, C. M. E., Gillis, L., Kouwen, N. & Aramini, J., “WindVOiCe, a Self-Reporting Survey: Adverse Health Effects, Industrial Wind Turbines, and the Need for Vigilance Monitoring,” Bulletin of Science Technology Society, Vo;. 31, No. 4, pp. 334–345, 2011.10.1177/0270467611412551Search in Google Scholar
[21] Pedersen, E., van den Berg, F., Bakker, R. & Bouma, J., “Can road traffic mask sound from wind turbines? Response to wind turbine sound at different levels of road traffic sound,” Energy Policy, Vol. 38, No. 5, pp. 2520–2527, 2010.10.1016/j.enpol.2010.01.001Search in Google Scholar
[22] Pedersen, E. & Larsman, P., “The impact of visual factors on noise annoyance among people living in the vicinity of wind turbines,” Journal of Environmental Psychology, Vol. 28, No. 4, pp. 379–389, 2008.10.1016/j.jenvp.2008.02.009Search in Google Scholar
[23] Hessler, G. F., Hessler, D. M., Brandstatt, P. & Bay, K., “Experimental study to determine wind-induced noise and wind-screen attenuation effects on microphone response for environmental wind turbine and other applications,” Noise Control Engineering Journal, Vol. 56, No. 4, pp. 300–309, 2008.10.3397/1.2949926Search in Google Scholar
[24] Pedersen, E., Hallberg, L. M. & Persson Waye, K. P., “Living in the Vicinity of Wind Turbines — A Grounded Theory Study,” Qualitative Research in Psychology. Vol. 4, No. 1–2, 2007.10.1080/14780880701473409Search in Google Scholar
[25] Lucke, K., Lepper, P. A., Hoeve, B., Everaarts, E., van Elk, N. & Siebert, U., “Perception of low-frequency acoustic signals by a harbour porpoise (Phocoena phocoena) in the presence of simulated offshore wind turbine noise,” Aquatic Mammals, Vol. 33, No. 1, pp. 55–68, 2007.10.1578/AM.33.1.2007.55Search in Google Scholar
[26] Oerlemans, S., Sijtsma, P. & Méndez López, P., “Location and quantification of noise sources on a wind turbine,” Journal of Sound and Vibration, Vol. 299, No. 4-5, pp. 869–883, 2007.10.1016/j.jsv.2006.07.032Search in Google Scholar
[27] Jakobsen, J., “Infrasound Emission from Wind Turbines,” Low Frequency Noise, Vibration and Active Control. Vol. 24, No. 3, 2005.10.1260/026309205775374451Search in Google Scholar
[28] van den Berg, G.P., “Effects of the wind profile at night on wind turbine sound,” Journal of Sound and Vibration, Vol. 277, No. 4–5, pp. 955–970, 2004.10.1016/j.jsv.2003.09.050Search in Google Scholar
[29] Persson Waye, K., Öhrström, E., “Psycho-acoustic characters of relevance for annoyance of wind turbine noise,” Journal of Sound and Vibration, Vol. 250, No. 1, pp. 65–73, 2002.10.1006/jsvi.2001.3905Search in Google Scholar
[30] Infiltec, “The Inexpensive Infrasound Monitor Project”, http://www.infiltec.com/Infrasound@home/, Retrieved October 20, 2015.Search in Google Scholar
[31] Bauer, M., Sander-Thömmes, T., Ihlenfeld, A., Kühn, S., Kühler, R. & Koch, C., “Investigation of perception at infrasound frequencies by functional magnetic resonance imaging (FMRI) and magnetoencephalography (MEG)”,. ICSV22 conference, Florence (Italy), 12–16 July 2015.Search in Google Scholar
[32] Moller, H., & Pedersen, C.S., “Hearing at low and infrasonic frequencies”, Noise and Health, Vol. 6, pp. 23–37, 2004.Search in Google Scholar
[33] Salt, A.N. & Lichtenhan, J. T., “Responses of the Inner Ear to Infrasound,” Proceedings of the Fourth International Meeting on Wind Turbine Noise, Rome, Italy, April 2011.Search in Google Scholar
[34] Williams, J.E. Ffowcs, “Review lecture: Anti-sound,” Proceedings of the Royal Society of London A: Mathematical, Physical and Engineering Sciences, Vol. 395, art. No. 1808, 1984.10.1098/rspa.1984.0090Search in Google Scholar
[35] Boretti, A. A., “Wind Farm Infrasound Active Cancellation and Mitigation Device,” IP Australia Provisional Patent Application 2015904098 of October 8, 2015.Search in Google Scholar
[36] van den Berg, G.P., “The sound of high winds”, PhD thesis, University of Groningen, NL, 2006. http://www.rug.nl/research/portal/files/14548137/17_thesis.pdfSearch in Google Scholar
© 2017 Walter de Gruyter GmbH, Berlin/Boston
This article is distributed under the terms of the Creative Commons Attribution Non-Commercial License, which permits unrestricted non-commercial use, distribution, and reproduction in any medium, provided the original work is properly cited.
Articles in the same Issue
- Frontmatter
- Convective heat transfer in a porous enclosure saturated by nanofluid with different heat sources
- Super Turbocharging the Direct Injection Diesel engine
- Computational analysis of non-Newtonian boundary layer flow of nanofluid past a semi-infinite vertical plate with partial slip
- On Complete Control and Synchronization of Zhang Chaotic System with Uncertain Parameters using Adaptive Control Method
- Hall and ion-slip effects on mixed convection in a chemically reacting fluid between rotating and stationary disks
- Influence of viscous dissipation and thermo-diffusion on double diffusive convection over a vertical cone in a non-Darcy porous medium saturated by a non-Newtonian fluid with variable heat and mass fluxes
- Infra-sound cancellation and mitigation in wind turbines