Quantum control in size selected semiconductor quantum dot thin films
-
Victor Kärcher

 ,
Tobias Reiker
,
Pedro F.G.M. da Costa
,
Andrea S.S. de Camargo
und
Helmut Zacharias
,
Tobias Reiker
,
Pedro F.G.M. da Costa
,
Andrea S.S. de Camargo
und
Helmut Zacharias

Abstract
We introduce a novel technique for coherent control that employs resonant internally generated fields in CdTe quantum dot (QD) thin films at the L-point. The bulk band gap of CdTe at the L-point amounts to 3.6 eV, with the transition marked by strong Coulomb coupling. Third harmonic generation (λ 3 = 343 nm, hν = 3.61 eV) for a fundamental wavelength of λ 1 = 1,030 nm is used to control quantum interference of three-photon resonant paths between the valence and conduction bands. Different thicknesses of the CdTe QDs are used to manipulate the phase relationship between the external fundamental and the internally generated third harmonic, resulting in either suppression or strong enhancement of the resonant third harmonic, while the nonresonant components remain nearly constant. This development could pave the way for new quantum interference–based applications in ultrafast switching of nanophotonic devices.
1 Introduction
Control and manipulation of opto-electronic properties of quantum systems is one of the main goals in many areas of physics [1], [2] and chemistry [3], [4]. In recent years, significant advances in nanofabrication [5], [6] have led to remarkable improvements in the control of electric charges, which provide excellent conditions for the use of nanotechnologies in quantum information [7] and quantum communication [8]. Especially quantum dots (QDs) are promising candidates for quantum (nano) devices not only due to their unique electrical and optical properties [9] but also their easy implementation in nanophotonic devices [10], [11]. Their size and composition can be precisely controlled during synthesis allowing for a controlled design of their band structure and energy levels [9]. Their tunability [12] enables the manipulation of inter- and intraband processes [13] making semiconductor QDs beneficial for various applications [14]. Quantum dot (QD) thin films are particularly promising for enabling direct coupling between different emitters in ensemble setups [15] and for achieving precise charge carrier control on a femtosecond timescale [16].
Precisely controlling parameters in physical [17], [18] and chemical [3], [19], [20], [21] processes on a femtosecond time scale is a highly sought-after goal in many scientific disciplines. This process is known as coherent control. The idea behind coherent control was originally proposed by Manykin and Afanasev [22]. A process was predicted in which the charge transfer between two states can be optically controlled when tuning the driving field into resonance of the atomic system. This was first demonstrated experimentally by Aron and Johnson [23] in a three-photon resonant system. Quantum interference of different paths connecting the initial and final states led to the absence of the multiphoton ionization signal, which is directly connected to third harmonic generation [24]. Several studies showed the suppression effects in even [22], [25], [26], [27], [28] and in odd [24], [29], [30], [31], [32], [33], [34], [35] photon resonant system. The interference that cancels two-photon resonant systems is induced by two phase-shifted Rabi oscillations, which originate from the external laser source and internally generated fields due to parametric four-wave mixing where the phase mismatch Δk of the fields is zero [27]. In odd parity systems, the phase mismatch Δk between the fundamental and the third harmonic leads to strong absorption of the material around resonance, and only constant phase relation with stimulated emission is possible. Free wave propagation with random phase relation is suppressed [31], a prerequisite for the medium to become transparent to the internally generated wave. Achieving this transparency requires a large phase mismatch, which is unattainable in gaseous media due to their refractive index being only marginally greater than one. Due to inversion symmetry, the internally generated field is 180° out of phase to the driving field, and thus the material depolarizes. Once the magnitude for total destructive interference is achieved, quantum interference prevents further harmonic generation in atoms. Thus, coherent control is typically achieved using two external fields to manipulate quantum transitions [17], [18], [36], [37], [38]. By utilizing internally generated fields in semiconductor QD thin films, which exhibit significant differences in refractive index leading to a large phase mismatch between the fundamental and third harmonic, the resonant one-photon absorption of the medium can be coherently controlled. This control renders the QDs transparent to the resonantly generated wave at a specific film thickness. Quantum control is thus achieved using only a single external field, simplifying the experimental setup. Thin QD films are particularly well-suited for this approach, providing a robust platform for ultrafast optical applications, such as nonlinear signal modulation and the coupling of emitters in ensemble configurations [15]. Additionally, QDs and nanoparticles offer size-dependent resonant and nonresonant characteristics [39], introducing experimental opportunities like tunability not typically accessible with gaseous media.
In this work, we present a novel method for coherent control of an injected current, which will be modulated by internally generated fields in a three-photon resonant system. The phase mismatch between the third harmonic and the fundamental beam in CdTe QDs is used to modulate the third-order nonlinear and size-dependent susceptibility at the L point of the Brillouin zone (
2 Quantum interference
In this section, we briefly show the connection between the transition rate and the third order nonlinear susceptibility tensor χ (3)(−3ω, ω, ω, ω). A detailed calculation can be found in the Supplementary Material. The behavior of a particle in an external field can be described by the semi-classical interaction Hamiltonian H int = −e/(mc)pA(t), where e denotes the electric charge, m the electron mass, c the light velocity, p the momentum operator, and A(t) the time dependent external field. By solving the time-dependent Schrödinger equation H int|ψ⟩ = iℏ∂ t |ψ⟩, the transition amplitudes c m (t) can be calculated when the wavefunction is expanded as a superposition of the basis set |m⟩
where |c m (t)|2 is the probability of finding a particle in state |m⟩ at time t. When time-dependent perturbation theory is applied, the coefficient c m (t) can be expanded on the power dependence (q), where q determines the number of photons with frequency ω m involved in the transition. In third harmonic generation, the superposition of the driving external and generated harmonic internal field can be written as
where ω = ω
1 and k = k
1 describe the fundamental frequency and wave number, ω
3 and k
3 the third harmonic frequency and wave number, and Γ the linewidth. Now we can calculate the transition amplitude
with
and the three-photon transition amplitude for ω by integrating the Schrödinger equation three times
By calculating the transition rate
where N is the number of oscillators per unit, volume, ϵ
0 is the permeability, the interference term
with Δk = k
3 − 3k. Note that this interference term only remains when ω
3 = ω
fi
. Thus, we can define a
and
The gain of the resonant harmonic is determined by the real part of the transition amplitude, as described by eq. (7), while the absorption of the resonant harmonic corresponds to the imaginary part, as given by eq. (8). This establishes a direct connection between absorption and gain. At z = 0, the modulation of the gain for the resonant harmonic is zero, whereas the modulation of the absorption is maximal. As the propagation distance z in the resonant medium increases, the absorption decreases, eventually rendering the medium transparent to the resonant third harmonic. This transparency manifests as an increase in the measured signal of the resonant third harmonic. At this stage, the gain is governed solely by the real part of the transition amplitude described in eq. (7), and the gain as a function of sample thickness z is expressed as:
where E(ω 3, z, t) is the electric field of the resonant frequency ω 3, modulated by sin(Δkz). This equation is only nonzero when there is a nonzero phase mismatch, Δk ≠ 0, between the driving field and the internally generated third harmonic. Under perfect phase-matching conditions (Δk = 0), the modulation of the resonant field E(ω 3, z, t) vanishes, and absorption dominates the process. Therefore, a nonzero phase mismatch is essential for achieving coherent control of transition amplitudes in odd-photon resonant systems.
At the sample’s initial interface, the internally generated field is suppressed. As the propagation distance z increases, the phase mismatch between the fundamental and third harmonic fields leads to a modulation of the propagated third harmonic field. This propagation distance z can be experimentally controlled by varying the thickness of the CdTe QD coating. A detailed derivation of the propagated and stimulated fields, based on Maxwell’s equations with a nonlinear source term, is provided in the Supplementary Information (eqs. (S31)–(S34)).
3 Methods and materials
3.1 Bulk cadmium telluride
CdTe is a type II–VI semiconductor with a zinc blende structure (space group F
![Figure 1:
Energy levels of Bulk CdTe. (a) Band structure of bulk CdTe along the Brillouin zone calculated with octopus [40], [41], [42], [43]. The direct band gap at the L point and the indirect band gap from the Γ point to the X point correspond to the photon energy of the third harmonic with a wavelength of λ
3 = 343 nm for a fundamental wavelength of λ
1 = 1,030 nm. (b) Schematic drawing of the direct band gap at the L point and the indirect band gap between the Γ point and the X point. For this indirect transition, a phonon with frequency ω
ph
is required. In (c), the resonant three-photon process between the valence band L
v
and the first conduction band L
c
at the L point is depicted. This resonant transition is necessary for quantum interference.](/document/doi/10.1515/nanoph-2024-0529/asset/graphic/j_nanoph-2024-0529_fig_001.jpg)
Energy levels of Bulk CdTe. (a) Band structure of bulk CdTe along the Brillouin zone calculated with octopus [40], [41], [42], [43]. The direct band gap at the L point and the indirect band gap from the Γ point to the X point correspond to the photon energy of the third harmonic with a wavelength of λ 3 = 343 nm for a fundamental wavelength of λ 1 = 1,030 nm. (b) Schematic drawing of the direct band gap at the L point and the indirect band gap between the Γ point and the X point. For this indirect transition, a phonon with frequency ω ph is required. In (c), the resonant three-photon process between the valence band L v and the first conduction band L c at the L point is depicted. This resonant transition is necessary for quantum interference.
Besides the resonant behavior of the third harmonic, the interaction between electrons/excitons with phonons induces a coupling of the indirect band gap between the Γ and X points, which also amounts to
3.2 CdTe quantum dots
The synthesis of CdTe QDs was performed based on the procedure reported in Ref. [12], [52], [53], [54]. First, 30 mL of ultra-pure water was added to a three-necked flask under magnetic stirring and argon flow to remove dissolved oxygen. Then, 17.13 mg of cadmium chloride (CdCl2·2.5H2O) and 10 µL of 3-mercaptopropionic acid (MPA) were added, and the pH was adjusted to pH 8 using a 0.5 M NaOH solution. In a second three-neck flask under a dry argon atmosphere, 7.97 mg of metallic tellurium (Te0) and 12.53 mg of sodium borohydride (NaBH4) were added. Then, 3.12 mL of argon-saturated ultra-pure water was slowly mixed, and the solution was slowly heated to 70 °C. Around this temperature, the solution started to turn pink. When the remaining metallic tellurium was reduced to NaHTe, 2.50 mL of the light pink solution was quickly added to the first flask using a syringe. The resulting solution immediately turned light yellow, indicating the formation of CdTe seeds. The ice bath was removed, and heating to 90 °C was started. Upon reaching this temperature, eight samples were collected for measurements after the following reaction times of 0.5, 1.0, 2.0, 4.0, 6.0, 24, and 48 h. The resulting quantum dot have sizes between 2 and 4 nm and band gaps between 2.54 eV and 1.77 eV at the Γ point. The band gap of the solid is E g,s = 1.6 eV. However, quantum confinement does not occur at the L and X points, as observed in the absorption spectrum of the QDs shown in Figure S3 in the Supplementary Material. Consequently, the three-photon resonant behavior at the L point persists across all sizes, leading to the expectation of quantum interference.
The CdTe QDs have been deposited on a borosilicate glass wafer, with quantum interference controlled by varying the thickness z of the film in the range from 10 to 60 nm. Figure 2 illustrates the schematic setup of the new method designed to coherently control the resonant nonlinear susceptibility χ (3) of the CdTe QDs at the L point, as described by eq. (7). Thus, third harmonic generation is employed to detect quantum interference. Using femtosecond pulses (40 fs, up to 80 µJ, 50 kHz repetition rate) from a fiber laser (Active Fiber Systems) with peak intensities of up to 5 × 10¹³ W/cm2 are utilized, with a central wavelength of λ = 1,030 nm, to produce the resonant third harmonic at λ 3 = 343 nm (see Section 6 in the Supplementary Material).

Schematic representation of the experiment. In order to coherently control the resonant nonlinear susceptibility, different CdTe QD film thicknesses are coated onto a borosilicate substrate.
4 Results and discussion
4.1 Third harmonic in CdTe quantum dots
This section outlines the spectral characteristics of the third harmonic generated using CdTe quantum dots. Figure 3(a)–(d) presents the third harmonic yield for four different film thicknesses, with CdTe QD sizes of d = 1.94 nm, as detailed in Table 1. The fundamental laser power is used as the variable parameter to determine the nonlinear order of the process, which is essential for confirming a χ (3) process that drives the modulation of the quantum interference effect. All graphs are normalized to the maximum yield observed in Figure 3(c).
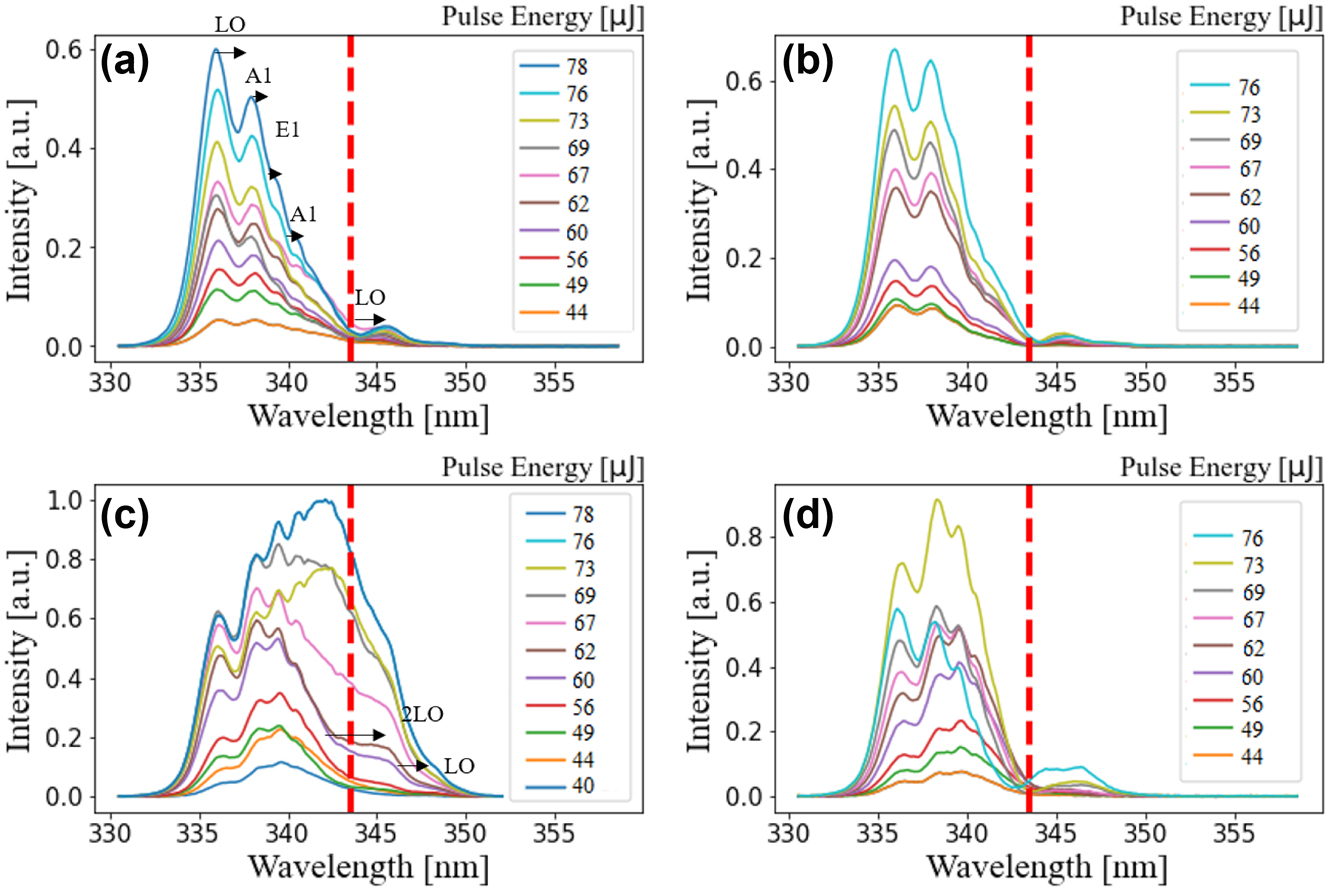
Generated third harmonic yield for CdTe QDs with a size of 1.94 nm and for thicknesses of (a) 10 nm, (b) 27 nm, (c) 45 nm, and (d) 60 nm. Spectral broadening is observed in (c), while in (d), the coating reached a critical thickness and the QDs are destroyed at pulse energies of 76 μJ. The yield is normalized to the highest peak in (c). This will be the normalization constant for all sizes and films. In addition, the shift of the peaks according to the LO and TO modes A 1 and E 1 of CdTe is indicated.
Characteristics of the CdTe quantum dots used in this work. The first column displays the reaction time; the second provides the band gap E g at the Γ point (luminescence emission maximum). The third column shows the diameter derived with the absorption method (ABS), and the fourth shows the diameter measured with dynamic light scattering (DLS).
| QD | E g [eV] | d [nm] (ABS) | d [nm] (DLS) |
|---|---|---|---|
| 0.5 h | 2.54 | 1.94 | – |
| 1 h | 2.47 | 2.01 | 2.9 |
| 2 h | 2.41 | 2.08 | 3.03 |
| 4 h | 2.34 | 2.16 | 3.03 |
| 6 h | 2.25 | 2.30 | 3.33 |
| 24 h | 1.97 | 2.95 | 3.94 |
| 48 h | 1.77 | 4.04 | – |
For a coated thickness of 10 nm, as shown in Figure 3(a), the resonant harmonic (marked by a red line) is suppressed, while the nonresonant components are amplified. A similar trend is observed for a coated thickness of 27 nm in Figure 3(b), where no significant changes occur compared to Figure 3(a), aside from a slight increase in signal strength. Additionally, new peaks emerge in the spectrum, with spacing that appears to correspond to the phonon lines of bulk CdTe. The transverse modes A 1 and E 1 are observed at 123 cm−1 and 142 cm−1, respectively, while the LO mode of the bulk crystal appears at 166 cm−1 and the second LO at 333 cm−1, as indicated in Figure 3(a) and (c). This off-resonant signal arises from stimulated anti-Stokes Raman scattering [55], [56] as illustrated in Figure S9 in the Supplementary Material. The stimulated Raman spectrum generated by the fundamental beam and QDs with size 1.94 nm is provided in Figure S8.
In the case of a 45 nm coated thickness, an intriguing observation is made regarding the nonlinear spectral broadening of the third harmonic, accompanied by an enhanced signal. The resonant harmonic (marked by the red line) shows significant amplification, particularly at higher intensities. However, for a coated thickness of 60 nm, as depicted in Figure 3(d), the resonant component is once again absent. Consequently, the harmonic at hν = 3.61 eV becomes most prominent at a specific thickness of the QD films.
The observed changes in spectral broadening and intensities apply to all CdTe quantum dots with sizes ranging from 1.94 to 2.16 nm, as listed in Table 1. The generated harmonic spectra for CdTe quantum dots synthesized with reaction times of 1 h (d = 2.01 nm), 2 h (d = 2.08 nm), and 4 h (d = 2.16 nm) are presented in the Supporting Information Figures S12, S13, and S14(a)–(d), respectively. In all three Figures S12–S14(a) and (b), the spectra exhibit a similar pattern to that shown in Figure 3(a) and (b). However, in (c), the situation differs slightly, although it still resembles the case in Figure 3(c). The resonant component emerges at a specific film thickness of 45 nm, while it remains absent in the other three thicknesses. Thus, the appearance of the resonant harmonic in Figures 3(c) and S12–S14(c), and its absence in the (a), (b), and (d) spectra, suggests that the appropriate CdTe QD coating thickness enables controlled spectral shaping through the manipulation of QD layer thickness and band dispersion. This highlights the potential to achieve specific spectral features through precise tuning of QD properties.
In Figure S11(c) of the Supplementary Material, the maximum yield of the third harmonic spectra from borosilicate glass plasma is compared to the maximum yield obtained using coated quantum dots with sizes ranging from 2–4 nm. Notably, for the largest and smallest quantum dots, the peak intensities are 17.5 and 10 times greater, respectively, than those from the bare substrate. However, a closer examination reveals that the spectra are not identical. When smaller quantum dots are used, spectral broadening is observed, a feature absent when larger quantum dots are employed.
For the largest CdTe QDs, with a size of 4.04 nm and a bandgap of 1.77 eV (obtained after a reaction time of 48 h), the harmonic spectra are depicted in Figure 4(a)–(c) for three film thicknesses. Unlike the smaller dots, spectral broadening is entirely absent, regardless of the film thickness. The bandwidth of the spectrum is comparable to that of the original borosilicate glass and the spectra shown in Figure S16. Notably, the individual modes observed in the other spectra are no longer present. Instead, the spectrum adopts a Gaussian-like profile with a maximum peak intensity of 1.75 at a center wavelength of 339 nm, although the previous peaks can still be identified as small shoulders. This lack of spectral broadening suggests a size-dependent or quantum confinement effect achieved at certain film thicknesses. Furthermore, the modulation of the resonant component is absent across all thicknesses for QDs with a diameter of 4.04 nm.

Generated third harmonic yield for CdTe with a size of 4.04 nm and for film thickness of (a) 10 nm, (b) 27 nm, (c) 45 nm and according to Figure S7(a)–(c). Here, the intensity of the third harmonic dropped after applying the third coating. The coupling to the TO modes disappeared almost completely. The spectrum exhibits a Gaussian like profile.
For intermediate sizes of the CdTe QDs, a different behavior is observed. Figure S15(a)–(d) show the harmonic spectra for CdTe QDs with a reaction time of 6 h, characterized by a core size of 2.3 nm and a band gap of E g = 2.25 eV. Significant changes compared to the previous spectra depicted in Figures 3, 4, and S12–S14 in the Supplementary Material are observed. A notable observation is the broadening of the spectrum compared to the original spectrum in Figure S11(a). Further additional modes are present, and a slightly larger peak intensity compared to the smaller dots is achieved in Figure S15(c), accompanied by a spectral bandwidth, which is the same as for the first QD used in Figure 3(c). Indeed, the spectral broadening observed in Figure S15 does not seem to be solely dependent on the coated thickness but rather appears to be influenced by the size of the CdTe quantum dots themselves. The different thicknesses in this case mainly affect the intensity of the harmonics. However, the resonant harmonic at 343 nm appears modulated for all thicknesses but does not show a peak at a film thickness of 45 nm as in the previously discussed spectra.
In the case of CdTe QDs synthesized with a reaction time of 24 h, a band gap of 1.97 eV, and a size of 2.95 nm, depicted in Figure S16, the spectral broadening observed in Figure S15 is significantly reduced. The spectra in Figure S16(a)–(d) exhibit narrower bandwidths, comparable to the original borosilicate glass spectrum, with a full width at half maximum (FWHM) of approximately 7 nm. The individual modes that appeared in the previous spectra are still present, although slightly suppressed in terms of spectral bandwidth. Nevertheless, peak intensities of 1.45 are achieved in this case, highlighting a trend of increasing peak intensity with larger quantum dot sizes. While the coupling to the LO modes of CdTe has completely disappeared, the coupling to the E 1 and A 1 modes persists. Theoretical studies [49] have shown that the electron–phonon coupling constant g decreases with increasing quantum dot size, and experimental observations reveal similar size-dependent behavior when a critical size is reached [50], [51]. Notably, the suppression of the resonant harmonic is absent across all film thicknesses for the QD size of d = 2.95 nm (Figure S16).
4.2 Discussion
In Section 2, we derived an expression for the third order susceptibility and the resonant part of the third harmonic. The gain of the resonant third harmonic is modulated according to eq. (9) by the phase mismatch Δk = k
3 − 3k
1 of the resonant third harmonic and the fundamental beam. The phase mismatch can be obtained through the refractive index of bulk CdTe where n
3ω
= 3.1 and n
1ω
= 2.7 [57]. Thus, the bulk phase mismatch is derived as
where
Note, that the approximation in eq. (11) is only valid for small z (L c,p ≪ L c,b ). The ratio of Δk b and Δk p will be at least one order of magnitude and thus we can rewrite eq. (11)
where q = Δk p/Δk b. It is worth noting that the ratio between the bulk and plasma phase mismatch is negative. Since the cosine is a symmetrical function, this will have no influence on the equation. Using eq. (12), we can rewrite eq. (9) to
The resonant nonlinear susceptibility
Thus, the resonant third harmonic at λ 3 = 343 nm can be modulated by coating different thicknesses of CdTe QDs. Especially the smaller dots are good candidates to control coherently the resonant part. In particular, the interference process occurs right at the beginning of the first monolayers of the coated QD films for the smaller dots (red graph, Figure 5). The interference is modulated by the phase mismatch between the resonant third harmonic and the fundamental when the film thickness is changed, as expected according eq. (9). The blue graph in Figure 5 shows that this process occurs also for a CdTe QD diameter of 2.30 nm, but the resonant harmonic appears not as a prominent peak, as can be seen in Figure S15 in the Supplementary Information and as described earlier. The modulation process itself thus occurs only for the smaller dots. This is a consequence of the different behavior of electrons in the conduction band with respect to the nonlinear susceptibility, which have to play a crucial role, since the phase mismatch is caused by the electrons in the conduction band. Hence, the value for χ (3) should also depend on the contribution of these electrons.

Coherent control of the resonant third harmonic intensity at ℏω
3 = 343 nm is demonstrated. The normalized value of
In Figure S18, we showed that the maximum value for χ (3) is strongly dependent on the size. The small dots (d < 2.30 nm) are characterized by the resonant and the bigger dots (d > 2.30 nm) by the nonresonant contribution of the free electrons to the susceptibility. This supports our corroboration that free electrons cause the phase mismatch and, therefore, the thickness-dependent interference between the fundamental and the third harmonic according to eq. (13). It also explains that the interference process only occurs for the smaller dots. The missing of the resonant third harmonic for the dots of sizes of 2.95 nm and 4.04 nm in Figures S16(a)–(d) and 4(a)–(c) is a consequence of the nonresonant contributions to χ (3) (see Sections 3 and 8.1 in the Supplementary Material). For a size of 2.30 nm, the resonant component is neither fully suppressed nor clearly visible as a distinct subpeak, as shown in Figure S15(a)–(d). This is due to the intermediate contributions of both the resonant and nonresonant components. In general, these subpeaks can be attributed to CdTe LO and TO phonon modes, which exhibit the expected size dependence in line with previous studies [49], [50], [51]. These phonon modes are essential for facilitating dipole coupling between the Γ point and the X point, leading to the generation of blue-shifted radiation.
5 Conclusions
In this work, we presented a new method for the coherent control of a photo-induced current in solid material by internally generated fields using different thicknesses of CdTe quantum dots with sizes around 2 nm. This could pave the way for new applications in ultrafast switching of nanophotonic devices, which uses quantum interference.
The direct band gap of bulk CdTe at the L point at 3.6 eV [44], [45], [46], [47] allows a resonant three-photon transition with the fundamental wavelength of 1,030 nm, which gives rise to quantum interference effects [23], [24], [27], [30], [31]. By varying the film thicknesses of CdTe quantum dots (QDs), the phase relationship between the external fundamental wavelength and the internally generated third harmonic can be controlled. This leads to either a suppression or significant enhancement of the resonant third harmonic, while the nonresonant components remain largely unaffected. This resonant behavior is specifically observed in QDs with diameters ranging from 1.94 nm to 2.16 nm. Theoretical calculations suggest that the third-order susceptibility tensor χ (3) is modulated due to phase mismatch between the external and internal fields when the seed pulse is tuned near the three-photon resonance. High peak intensities increase the number of conduction band electrons, leading to a temporary change in the refractive index of CdTe, which reduces the coherence length. This enables the use of nanometer-scale thicknesses to coherently control the resonant third harmonic intensity, making the process promising for nanophotonic applications.
Interestingly, this behavior is absent in the fifth harmonic, which supports our explanation, as the fifth harmonic is far from any resonant transition in CdTe. Larger quantum dots also do not exhibit this resonant behavior. Their harmonic yield is dominated by nonresonant intraband mechanisms of conduction band electrons contributing to the third-order nonlinear susceptibility, χ (3), as predicted by the theory of nanoparticles [39]. This may also explain the lack of quantum interference in larger dots.
In summary, we coherently control the appearance of the resonant third harmonic in a strong dipole coupled three-photon resonant transition by choosing the right size and thickness of CdTe QDs. The well-known exciton in CdTe at the L point has a strong Coulomb coupling providing excellent conditions for quantum interference. In particular, all materials that exhibit saddle type critical points including alkali halides [59], III–V, and II–VI semiconductors [46] are possible candidates for such a behavior and, therefore, opening new opportunities to the design of nonlinear opto-electronic devices.
Funding source: Fundação de Amparo a Pesquisa do Estado de São Paulo in Brazil
Award Identifier / Grant number: 2021/01170-3
Award Identifier / Grant number: 2013/07793-6
Funding source: Deutsche Forschungsgemeinschaft
Award Identifier / Grant number: CRC1459
Award Identifier / Grant number: Za 110/28 – 1
-
Research funding: We gratefully acknowledge the support of the Deutsche Forschungsgemeinschaft (DFG) under Project Za 110/28 – 1. This funding has been instrumental in advancing our research, and we are sincerely thankful for their continued support. Further, ASSC and PFGMC acknowledge FAPESP – Fundação de Amparo a Pesquisa do Estado de São Paulo in Brazil for research funding through the grants 2013/07793-6 and 2021/01170-3. ASSC is particularly thankful for funds granted by the Alexander von Humboldt Foundation, and DFG via (CRC1459), to carry out a research stay at the University of Münster.
-
Author contributions: VK performed the experiments, the calculations, the analysis, and the processing of the data and figures and wrote the manuscript. TR provided supporting work in the laboratory. PFGMC and ASSC generated the CdTe quantum dots and determined their sizes. HZ supervised the project and discussed the results. VK, PFGMC, and HZ wrote the manuscript.
-
Conflict of interest: Authors state no conflicts of interest.
-
Data availability: The data and datasets that support the figures in this paper and other findings of this study are available from the corresponding author upon reasonable request.
References
[1] D. Dong and I. R. Petersen, “Quantum control theory and applications a survey,” IET Control Theory Appl., vol. 4, no. 12, pp. 2651–2671, 2010. https://doi.org/10.1049/iet-cta.2009.0508.Suche in Google Scholar
[2] M. Erhard, M. Krenn, and A. Zeilinger, “Advances in high-dimensional quantum entanglement,” Nat. Rev. Phys., vol. 2, no. 7, pp. 365–381, 2020. https://doi.org/10.1038/s42254-020-0193-5.Suche in Google Scholar
[3] L. Levin, W. Skomorowski, L. Rybak, R. Kosloff, C. P. Koch, and Z. Amitay, “Coherent control of bond making,” Phys. Rev. Lett., vol. 114, no. 23, 2015, Art. no. 233003. https://doi.org/10.1103/physrevlett.114.233003.Suche in Google Scholar PubMed
[4] C. P. Koch, M. Lemeshko, and D. Sugny, “Quantum control of molecular rotation,” Rev. Mod. Phys., vol. 91, no. 3, 2019, Art. no. 035005. https://doi.org/10.1103/revmodphys.91.035005.Suche in Google Scholar
[5] P. Nagpal, N. C. Lindquist, S.-H. Oh, and D. J. Norris, “Ultrasmooth patterned metals for plasmonics and metamaterials,” Science, vol. 325, no. 5940, pp. 594–597, 2009. https://doi.org/10.1126/science.1174655.Suche in Google Scholar PubMed
[6] H. Duan, A. I. Fernández-Domínguez, M. Bosman, S. A. Maier, and J. K. W. Yang, “Nanoplasmonics classical down to the nanometer scale,” Nano Lett., vol. 12, no. 3, pp. 1683–1689, 2012. https://doi.org/10.1021/nl3001309.Suche in Google Scholar PubMed
[7] C. H. Bennett and P. W. Shor, “Quantum information theory,” IEEE Trans. Inf. Theory, vol. 44, no. 6, pp. 2724–2742, 1998. https://doi.org/10.1109/18.720553.Suche in Google Scholar
[8] N. Gisin and R. Thew, “Quantum, communication,” Nat. Photonics, vol. 1, no. 3, pp. 165–171, 2007. https://doi.org/10.1038/nphoton.2007.22.Suche in Google Scholar
[9] K. Grieve, P. Mulvaney, and F. Grieser, “Synthesis and electronic properties of semiconductor nanoparticles/quantum dots,” Colloid Interface Sci. Commun., vol. 5, nos. 1–2, pp. 168–172, 2000. https://doi.org/10.1016/s1359-0294(00)00050-9.Suche in Google Scholar
[10] C. R. Kagan, L. C. Bassett, C. B. Murray, and S. M. Thompson, “Colloidal quantum dots as platforms for quantum information science,” Chem. Rev., vol. 121, no. 5, pp. 3186–3233, 2021. https://doi.org/10.1021/acs.chemrev.0c00831.Suche in Google Scholar PubMed
[11] T. Heindel, J.-H. Kim, N. Gregersen, A. Rastelli, and S. Reitzenstein, “Quantum dots for photonic quantum information technology,” Adv. Opt. Photonics, vol. 15, no. 3, pp. 613–738, 2023. https://doi.org/10.1364/aop.490091.Suche in Google Scholar
[12] F. G. M. da Costa, L. G. Merízio, N. Wolff, H. Terraschke, and A. S. S. de Camargo, “Real-time monitoring of CdTe quantum dots growth in aqueous solution,” Sci. Rep., vol. 14, no. 1, p. 7884, 2024. https://doi.org/10.1038/s41598-024-57810-8.Suche in Google Scholar PubMed PubMed Central
[13] B. L. Wehrenberg, C. Wang, and P. Guyot-Sionnest, “Interband and intraband optical studies of PbSe colloidal quantum dots,” J. Phys. Chem. B, vol. 106, no. 41, pp. 10634–10640, 2002. https://doi.org/10.1021/jp021187e.Suche in Google Scholar
[14] Y. S. Lim, W. Shen, and Z. Gao, “Carbon quantum dots and their applications,” Chem. Soc. Rev., vol. 44, no. 1, pp. 362–381, 2015. https://doi.org/10.1039/c4cs00269e.Suche in Google Scholar PubMed
[15] H. Tahara, M. Sakamoto, T. Teranishi, and Y. Kanemitsu, “Coherent electronic coupling in quantum dot solids induces cooperative enhancement of nonlinear optoelectronic responses,” Nat. Nanotechnol., vol. 19, no. 6, pp. 744–750, 2024. https://doi.org/10.1038/s41565-024-01601-9.Suche in Google Scholar PubMed
[16] Z. Zhang, et al.., “Ultrafast exciton transport at early times in quantum dot solids,” Nat. Mater., vol. 21, no. 5, pp. 533–539, 2022. https://doi.org/10.1038/s41563-022-01204-6.Suche in Google Scholar PubMed
[17] J. M. Fraser and H. M. van Driel, “Quantum interference control of free-carrier density in GaAs,” Phys. Rev. B, vol. 68, no. 8, 2003, Art. no. 085208. https://doi.org/10.1103/physrevb.68.085208.Suche in Google Scholar
[18] J. Güdde, M. Rohleder, T. Meier, S. W. Koch, and U. Höfer, “Time-resolved investigation of coherently controlled electric currents at a metal surface,” Science, vol. 318, no. 5854, pp. 1287–1291, 2007. https://doi.org/10.1126/science.1146764.Suche in Google Scholar PubMed
[19] S. Gräfe and V. Engel, “On the control of resonant versus non-resonant electronic transitions in molecular photodissociatio,” Chem. Phys. Lett., vol. 414, nos. 1–3, pp. 17–22, 2005. https://doi.org/10.1016/j.cplett.2005.08.029.Suche in Google Scholar
[20] G. G. Balint-Kurti, F. R. Manby, Q. Ren, M. Artamonov, T.-S. Ho, and H. Rabitz, “Quantum control of molecular motion including electronic polarization effects with a two-stage toolkit,” J. Chem. Phys., vol. 122, no. 8, 2005, Art. no. 084110. https://doi.org/10.1063/1.1854632.Suche in Google Scholar PubMed
[21] M. Shapiro and P. Brumer, “Coherent control of molecular dynamics,” Rep. Prog. Phys., vol. 66, no. 6, p. 859, 2003. https://doi.org/10.1088/0034-4885/66/6/201.Suche in Google Scholar
[22] E. A. Manykin and A. M. Afanas’ev, “On one possibility of making a medium transparent by multiquantum resonance,” J. Theor. Phys., vol. 52, pp. 1246–1250, 1967, Sov. Phys. JETP, vol. 25, no. 5, p. 828, 1967.Suche in Google Scholar
[23] K. Aron and P. M. Johnson, “The multiphoton ionization spectrum of xenon interatomic effects in multiphoton transitions,” J. Chem. Phys., vol. 67, no. 11, pp. 5099–5104, 1977. https://doi.org/10.1063/1.434737.Suche in Google Scholar
[24] R. N. Compton and J. C. Miller, “Third-harmonic generation and multiphoton ionization in rare gases,” Phys. Rev. A, vol. 25, no. 4, p. 2056, 1982. https://doi.org/10.1103/physreva.25.2056.Suche in Google Scholar
[25] G. S. Agarwal, “Generation of pair coherent states and squeezing via the competition of four-wave mixing and amplified spontaneous emission,” Phys. Rev. Lett., vol. 57, no. 7, p. 827, 1986. https://doi.org/10.1103/physrevlett.57.827.Suche in Google Scholar PubMed
[26] R. W. Boyd, M. S. Malcuit, D. J. Gauthier, and K. Rzaewski, “Competition between amplified spontaneous emission and the four-wave-mixing process,” Phys. Rev. A, vol. 35, no. 4, p. 1648, 1987. https://doi.org/10.1103/physreva.35.1648.Suche in Google Scholar PubMed
[27] W. R. Garret, M. A. Moore, R. C. Hart, M. G. Payne, and R. Wunderlich, “Suppression effects in stimulated hyper-Raman emission and parametric four-wave mixing in sodium vapor,” Phys. Rev. A, vol. 45, no. 9, p. 6687, 1992. https://doi.org/10.1103/physreva.45.6687.Suche in Google Scholar PubMed
[28] Y. Y. Yin, C. Chen, D. S. Elliott, and A. V. Smith, “Asymmetric photoelectron angular distributions from interfering photoionization processes,” Phys. Rev. Lett., vol. 69, no. 16, p. 2353, 1992. https://doi.org/10.1103/physrevlett.69.2353.Suche in Google Scholar PubMed
[29] J. H. Glownia and R. K. Sander, “Experimental evidence for the competition between resonantly enhanced multiphoton ionization and third-harmonic generation in xenon,” Phys. Rev. Lett., vol. 49, no. 1, p. 21, 1982. https://doi.org/10.1103/physrevlett.49.21.Suche in Google Scholar
[30] D. J. Jackson and J. J. Wynne, “Interference effects between different optical harmonics,” Phys. Rev. Lett., vol. 49, no. 8, p. 8, 1982. https://doi.org/10.1103/physrevlett.49.543.Suche in Google Scholar
[31] D. J. Jackson, J. J. Wynne, and P. H. Kes, “Resonance-enhanced multiphoton ionization interference effects due to harmonic generation,” Phys. Rev. A, vol. 49, no. 2, p. 8, 1983. https://doi.org/10.1103/physreva.28.781.Suche in Google Scholar
[32] W. R. Garrett, W. R. Ferrell, M. G. Payne, and J. C. Miller, “Influence of third-harmonic fields on multiphoton ionization of noble gases in unfocused laser beams,” Phys. Rev. A, vol. 34, no. 2, p. 1165, 1986. https://doi.org/10.1103/physreva.34.1165.Suche in Google Scholar PubMed
[33] M. N. R. Ashfold, C. D. Heryet, J. D. Prince, and B. Tutcher, “Competition between resonance-enhanced multiphoton ionization and 3rd-harmonic generation in acetylene vapor,” Chem. Phys. Lett., vol. 131, nos. 4–5, p. 291, 1986. https://doi.org/10.1016/0009-2614(86)87153-6.Suche in Google Scholar
[34] T. M. Orlando, L. Li, S. L. Anderson, and M. G. White, “Third harmonic interference effects in the MPI spectrum of acetylene,” Chem. Phys. Lett., vol. 129, no. 1, p. 31, 1986. https://doi.org/10.1016/0009-2614(86)80163-4.Suche in Google Scholar
[35] L. Li, M. Wu, and P. M. Johnson, “Photodissociation, third harmonic interferences, polarization effects, and the MPI spectroscopy of chlorine,” J. Chem. Phys., vol. 86, no. 3, p. 1131, 1987. https://doi.org/10.1063/1.452255.Suche in Google Scholar
[36] A. Haché, Y. Kostoulas, R. Atanasov, J. L. P. Hughes, J. E. Sipe, and H. M. van Driel, “Observation of coherently controlled photocurrent in unbiased, bulk GaAs,” Phys. Rev. Lett., vol. 78, no. 2, p. 2, 1997. https://doi.org/10.1103/physrevlett.78.306.Suche in Google Scholar
[37] J. M. Fraser, A. I. Shkrebtii, J. E. Sipe, and H. M. van Driel, “Quantum interference in electron-hole generation in noncentrosymmetric semiconductors,” Phys. Rev. Lett., vol. 83, no. 20, p. 20, 1999. https://doi.org/10.1103/physrevlett.83.4192.Suche in Google Scholar
[38] D. J. Morrow, D. D. Kohler, Y. Zhao, J. M. Scheeler, S. Jin, and J. C. Wright, “Quantum interference between the optical Stark effect and resonant harmonic generation in WS2,” Phys. Rev. B, vol. 102, no. 16, p. 161401R, 2020. https://doi.org/10.1103/physrevb.102.161401.Suche in Google Scholar
[39] V. P. Drachev, A. K. Buin, H. Nakotte, and V. M. Shalaev, “Size dependent χ3 for conduction electrons in Ag nanoparticles,” Nano Lett., vol. 4, no. 8, pp. 1535–1539, 2014. https://doi.org/10.1021/nl049438d.Suche in Google Scholar
[40] N. Tancogne-Dejean, et al.., “Octopus, a computational framework for exploring light-driven phenomena and quantum dynamics in extended and finite systems,” Chem. Phys., vol. 152, no. 12, 2020, Art. no. 124119. https://doi.org/10.1063/1.5142502.Suche in Google Scholar PubMed
[41] X. Andrade, et al.., “Real-space grids and the Octopus code as tools for the development of new simulation approaches for electronic systems,” Phys. Chem. Chem. Phys., vol. 17, no. 47, pp. 31371–31396, 2015. https://doi.org/10.1039/c5cp00351b.Suche in Google Scholar PubMed
[42] A. Castro, et al.., “octopus: a tool for the application of time-dependent density functional theory,” Phys. Status Solidi, vol. 243, no. 11, pp. 2465–2488, 2006. https://doi.org/10.1002/pssb.200642067.Suche in Google Scholar
[43] M. A. L. Marques, A. Castro, G. F. Bertsch, and A. Rubio, “octopus: a first-principles tool for excited electron-ion dynamics,” Comput. Phys. Commun., vol. 151, no. 1, pp. 60–78, 2003.10.1016/S0010-4655(02)00686-0Suche in Google Scholar
[44] M. Cardona and G. Harbeke, “Excitons at the L absorption edge in zinc blende-type semiconductors,” Phys. Rev. Lett., vol. 8, no. 3, p. 3, 1961. https://doi.org/10.1103/physrevlett.8.90.Suche in Google Scholar
[45] D. T. F. Marple and H. Ehrenreich, “Dielectric constant behavior near band edges in CdTe and Ge,” Phys. Rev. Lett., vol. 8, no. 3, p. 87, 1962. https://doi.org/10.1103/physrevlett.8.87.Suche in Google Scholar
[46] E. O. Kane, “Coulomb effects in saddle-type critical points,” Phys. Rev., vol. 180, no. 3, p. 852, 1969. https://doi.org/10.1103/physrev.180.852.Suche in Google Scholar
[47] B. G. PotterJr. and J. H. Simmons, “Quantum confinement effects at the L point in CdTe,” Phys. Rev. B, vol. 43, no. 3, p. 3, 1991. https://doi.org/10.1103/physrevb.43.2234.Suche in Google Scholar PubMed
[48] F. de Moure-Flore, et al.., “CdTe thin films grown by pulsed laser deposition using powder as target: effect of substrate temperature,” J. Cryst. Growth, vol. 386, pp. 27–31, 2014.10.1016/j.jcrysgro.2013.09.036Suche in Google Scholar
[49] X.-Q. Li, H. Nakayama, and Y. Arakawa, “Lifetime of confined LO phonons in quantum dots and its impact on phonon bottleneck issue,” Jpn. J. Appl. Phys., vol. 38, no. 15, p. 473, 1999. https://doi.org/10.1143/jjap.38.473.Suche in Google Scholar
[50] G. Morello, M. De Giorgi, S. Kudera, L. Manna, R. Cingolani, and M. Anni, “Temperature and size dependence of nonradiative relaxation and exciton-phonon coupling in colloidal CdTe quantum dots,” J. Phys. Chem. C, vol. 111, no. 16, pp. 5846–5849, 2007. https://doi.org/10.1021/jp068307t.Suche in Google Scholar
[51] A. M. Jagtap, J. Khatei, and K. S. R. K. Rao, “Exciton phonon scattering and nonradiative relaxation of excited carriers hydrothermally synthesized CdTe quantum dots,” Phys. Chem. Chem. Phys., vol. 17, no. 41, pp. 27579–27587, 2015.10.1039/C5CP04654HSuche in Google Scholar PubMed
[52] J. Weng, et al.., “Highly luminescent CdTe quantum dots prepared in aqueous phase as an alternative fluorescent probe for cell imaging,” Talanta, vol. 70, no. 2, pp. 397–402, 2006. https://doi.org/10.1016/j.talanta.2006.02.064.Suche in Google Scholar PubMed
[53] F. O. Silva, et al.., “Effect of surface ligands on the optical properties of aqueous soluble CdTe quantum dots,” Nanoscale Res. Lett., vol. 7, no. 1, p. 536, 2012. https://doi.org/10.1186/1556-276x-7-536.Suche in Google Scholar
[54] Y. Xu, et al.., “Seed-mediated growth approach for rapid synthesis of high-performance red-emitting CdTe quantum dots in aqueous phase and their application in detection of highly reactive oxygen species,” Chem. Eng. J., vol. 299, pp. 201–208, 2016. https://doi.org/10.1016/j.cej.2016.04.008.Suche in Google Scholar
[55] A. Yariv, Quantum Electronics, Hoboken, New Jersey, USA, John Wiley & Sons, 1988.Suche in Google Scholar
[56] Y. R. Shen, The Principles of Nonlinear Optics, Hoboken, New Jersey, USA, John Wiley & Sons, 2002.Suche in Google Scholar
[57] R. E. Treharne, A. Seymour-Pierce, K. Durose, K. Hutchings, S. Roncallo, and D. Lane, “Optical design and fabrication of fully sputtered CdTe/CdS solar cells,” J. Phys.:Conf. Ser., vol. 286, no. 1, 2011, Art. no. 012038. https://doi.org/10.1088/1742-6596/286/1/012038.Suche in Google Scholar
[58] J. Noack and A. Vogel, “Laser-induced plasma formation in water at nanosecond to femtosecond time scales: calculation of thresholds, absorption coefficients, and energy density,” IEEE J. Quantum Electron., vol. 35, no. 8, p. 8, 1999. https://doi.org/10.1109/3.777215.Suche in Google Scholar
[59] J. C. Phillips, “Ultraviolet absorption of insulators. III. Fcc alkali halides,” Phys. Rev., vol. 136, no. 6A, p. A1705, 1964. https://doi.org/10.1103/physrev.136.a1705.Suche in Google Scholar
Supplementary Material
This article contains supplementary material (https://doi.org/10.1515/nanoph-2024-0529).
© 2025 the author(s), published by De Gruyter, Berlin/Boston
This work is licensed under the Creative Commons Attribution 4.0 International License.
Artikel in diesem Heft
- Frontmatter
- Review
- Inverse design of nanophotonic devices enabled by optimization algorithms and deep learning: recent achievements and future prospects
- Perspective
- Theoretical understanding of water splitting by analyzing nanocatalyst photoabsorption spectra
- Research Articles
- A novel intelligent photonic design method enabled by metamaterials and k-nearest neighbor
- Silicon photonic modulators with a 2 × 1 Fabry–Perot cavity
- Polarization-controlled metasurface for simultaneous holographic display and three-dimensional depth perception
- Probing the chirality of a single microsphere trapped by a focused vortex beam through its orbital period
- Subwavelength-scale off-axis optical nanomanipulation within Gaussian-beam traps
- Quantum control in size selected semiconductor quantum dot thin films
- Submicron quantum dot light-emitting diodes enabled by pixelated topological meta-mirror
- Label-free (fluorescence-free) sensing of a single DNA molecule on DNA origami using a plasmon-enhanced WGM sensor
- Second harmonic generation from bound-state in the continuum-hosted few-layers van der Waals metasurface