Photon antibunching in single-molecule vibrational sum-frequency generation
-
Fatemeh Moradi Kalarde
 ,
Johannes Feist
,
Johannes Feist
 and
Christophe Galland
and
Christophe Galland

Abstract
Sum-frequency generation (SFG) enables the coherent upconversion of electromagnetic signals and plays a significant role in mid-infrared vibrational spectroscopy for molecular analysis. Recent research indicates that plasmonic nanocavities, which confine light to extremely small volumes, can facilitate the detection of vibrational SFG signals from individual molecules by leveraging surface-enhanced Raman scattering combined with mid-infrared laser excitation. In this article, we compute the degree of second order coherence (g (2)(0)) of the upconverted mid-infrared field under realistic parameters and accounting for the anharmonic potential that characterizes vibrational modes of individual molecules. On the one hand, we delineate the regime in which the device should operate in order to preserve the second-order coherence of the mid-infrared source, as required in quantum applications. On the other hand, we show that an anharmonic molecular potential can lead to antibunching of the upconverted photons under coherent, Poisson-distributed mid-infrared and visible drives. Our results therefore open a path toward bright and tunable source of indistinguishable single photons by leveraging “vibrational blockade” in a resonantly and parametrically driven molecule, without the need for strong light-matter coupling.
1 Introduction
Single-photon sources are a key resource for quantum technologies [1] with pivotal applications in quantum computation [2], communications [3], and metrology [4]. The main challenge in this area is to realize a high-rate solid-state photon source producing indistinguishable photons [5], which demands that pure-dephasing makes a negligible contribution to the emission linewidth [6]. Probabilistic approaches to single-photon emission typically leverage an optical nonlinearity in the material (spontaneous parametric down conversion [7] or degenerate four-wave mixing [8]) to generate time-correlated photon pairs from bulk crystals [9] or photonic integrated circuits [10]. The detection of one photon in, e.g., the idler mode heralds a quantum state very close to a single-photon Fock state in the signal mode [1]. This heralding works provided that the probability of photon pair generation per mode is well below unity, a condition that fundamentally limits the brightness of these type of sources [11]. An alternative approach exploits the anharmonic character of quantum emitters to achieve deterministic single-photon emission via photon blockade [12], [13]. Such emitters include trapped atoms or ions [14], and notably solid-state sources such as immobilized molecules [15], quantum dots [16], nanotubes [17], color centers [18], [19], and many other rising low-dimensional materials [11].
In the last decades, molecules have emerged as a particularly promising platform for integrated quantum photonic technologies [21], given their good degree of coherence [22], frequency tunability [23], [24], versatile coupling to photonic structures [25], [26], [27], [28] and strong non-linearity at the single-photon level [29] enabling effects such as the emission of antibunched light [30], [31], four-wave mixing [32] and sum-frequency generation [20], [33].
Here, we propose the implementation of a broadly tunable source of single photons based on photon blockade in vibrational sum-frequency generation (VSFG) from a single molecule embedded in a dual-resonant plasmonic nanocavity in the weak-coupling regime [20], [33]. The setup consists in measuring surface-enhanced Raman scattering (SERS) at the single molecule level under simultaneous mid-infrared (MIR) laser excitation, Figure 1a. In contrast to a recent proposal for unconventional photon blockade in a hybrid plasmonic-photonic molecular optomechanical cavity [34], our scheme is operational for arbitrarily weak molecule-cavity coupling strengths and irrespective of the cavity modes quality factors. VSFG is a coherent upconversion process that occurs whenever a vibrational mode that is both Raman- and infrared-active (which requires a non-centrosymmetric molecule) is driven simultaneously with a MIR laser tuned on resonance with the vibrational frequency and a visible or near-infrared (VIS/NIR) laser, typically tuned away from any electronic resonance to avoid parasitic incoherent fluorescence [35], [36], [37]. Three-wave mixing results in upconverted photons at frequencies corresponding to the sum and difference of the incoming laser frequencies; while the difference frequency signal is polluted by spontaneous Raman scattering, VSFG is almost free of incoherent background due to the very low thermal occupancy of the vibration at MIR frequencies, even at room temperature. We will show the feasibility of single-photon generation using VSFG from a single molecule with a sufficient anharmonicity in one of its vibrational modes, resulting in antibunching in the sum-frequency upconverted photons.
![Figure 1:
Overview of the proposed scheme. (a) VIS and MIR antennas mediate an efficient interaction between photonic and molecular vibrational modes [20]. A spectrometer or HBT interferometer measures the intensity spectrum or the frequency-filtered second-order correlation of the scattered photons, respectively. (b) Vibrational potential of the molecule considering either a Morse potential (red line) or its harmonic approximation (grey line). (c) As a result of anharmonicity, a second peak (labelled 2) emerges in the thermally activated spontaneous anti-Stokes Raman spectrum, corresponding to the Raman transition from the second to the first excited vibrational levels (see inset). The energy difference between transitions 1 and 2 is noted χω
b, whereby χ quantifies the strength of anharmonicity in units of the Raman shift ω
b
. The thermal occupancy is set here to n
th = 5 × 10⁻³.](/document/doi/10.1515/nanoph-2024-0469/asset/graphic/j_nanoph-2024-0469_fig_001.jpg)
Overview of the proposed scheme. (a) VIS and MIR antennas mediate an efficient interaction between photonic and molecular vibrational modes [20]. A spectrometer or HBT interferometer measures the intensity spectrum or the frequency-filtered second-order correlation of the scattered photons, respectively. (b) Vibrational potential of the molecule considering either a Morse potential (red line) or its harmonic approximation (grey line). (c) As a result of anharmonicity, a second peak (labelled 2) emerges in the thermally activated spontaneous anti-Stokes Raman spectrum, corresponding to the Raman transition from the second to the first excited vibrational levels (see inset). The energy difference between transitions 1 and 2 is noted χω b, whereby χ quantifies the strength of anharmonicity in units of the Raman shift ω b . The thermal occupancy is set here to n th = 5 × 10⁻³.
Our proposal shares with resonance fluorescence some similitudes regarding the coexistence of coherence (sub-natural linewidth) and single-photon emission, recently explored in several works [38], [39], [40], [41]. Antibunching is revealed at specific frequency windows through the zero-delay second-order correlation function of the frequency-filtered emission [42], [43], [44], which, when analyzed over the parameter space, unveils a complex landscape of interference phenomena between the coherent VSFG nonlinear process and the incoherent anti-Stokes Raman background. This interference is crucial for enabling single-photon emission, which is maximized when the MIR laser is resonant with the vibrational mode and the coherent and incoherent peaks overlap. These results establish our proposed molecular scheme as a novel, privileged platform for studying the role of interference in single-photon emission, closely tied to the notions of conventional and unconventional photon blockade [39].
The versatility of our scheme, together with the picosecond relaxation times of vibrational excitations, promises a valuable tool for the production of indistinguishable single photons at THz repetition rates, enabling a breadth of applications such as the realisation of multi-photon entanglement in boson sampling [45] and cluster states [46], [47], [48], [49]. Furthermore, our observation of the rich phenomenology imprinted in the photon correlations by the nonlinear molecular dynamics suggests promising prospects for quantum Raman spectroscopy boosting analytical, material, and biomedical applications [50], [51], [52], [53]; quantum estimation of molecular parameters and quantum states [54]; and quantum sensing [55].
In the following, we provide a numerical analysis of VSFG based on the scenario presented in [20], [33] in the single or few-molecule limit, focusing on a more rigorous treatment of classical and quantum coherence in the upconversion process and introducing the anharmonicity of the vibrational mode [56]. For the interaction of the molecular vibration with visible light, we adopt an optomechanical description of Raman scattering [57], [58], [59]. We first confirm that, in the harmonic approximation for the vibrational potential, the first- and second-order coherence of the infrared signal are preserved in the upconverted signal, as required for quantum frequency conversion [60], [61] and MIR single-photon spectroscopy [62], [63], [64], [65], [66], [67], [68], [69], [70], [71], [72]. Second, we demonstrate the feasibility of generating antibunched photons under coherent MIR and VIS excitation of a single molecule having a strong enough anharmonicity in its vibrational potential [73], while the molecule remains in the weak coupling regime with both MIR and VIS cavity modes. We conclude by exploring the effect of the number of involved molecules on the degree of antibunching.
2 Results
2.1 Model
We consider a single vibrational mode of a single molecule placed in a dual-resonant plasmonic cavity featuring two resonances: one in the MIR at ω IR ≃ ω b, where ω b is the transition frequency between the ground and first vibrational excited state, and one in the VIS/NIR domain at frequency ω c that is considered much higher than the vibrational frequency and sufficiently lower than the first electronic transition of the molecule. The nanocavity is driven by two continuous monochromatic laser beams: one at a MIR frequency ω d near-resonant with the cavity mode and molecular vibration, ω d ≃ ω IR ≃ ω b, and one at a VIS/NIR frequency ω p ≃ ω c, generating a VSFG signal at a frequency ω p + ω d. The setup is depicted in Figure 1a.
The Hamiltonian of the molecule, restricted to the ground electronic state and the few first vibrational states, is expressed as:
Here and in the following, we choose units where the reduced Planck constant ℏ = 1 and we set ω
b as the energy unit. The vibrational mode (phonon) of the molecule at frequency ω
b has a corresponding annihilation operator denoted as b. The parameter χ characterizes the anharmonicity of the vibrational mode. The eigenstates of H
mol are the Fock states b
†
b|n⟩ = n|n⟩, with energies given by
A simple Hamiltonian can be formulated to describe the full system, which takes into account the molecular vibration, the two resonances of the nanocavity, the incident lasers (ΩIR and Ωc denote their respective drive strengths), as well as the resonant dipolar coupling between the MIR cavity mode and the molecular vibration, and its optomechanical (Raman) coupling with the VIS/NIR mode [20].
We assume decay rates of κ c, κ IR, and γ for the optical, infrared, and phonon modes, respectively. Following the approximations detailed in Appendix C, we obtain the linearized Hamiltonian
where
In case of zero detuning of the lasers from the cavity resonances (such that α IR and α c are real), the Hamiltonian simplifies to
where we have defined the effective (laser-driven) coupling rates
The Lindblad master equation corresponding to the Hamiltonian in Eq. (4) with the Lindblad dissipation terms due to the decay rates mentioned above is solved using QuTiP [75], [76]. The parameters are fixed in dimensionless units by normalizing all energies to the vibrational frequency ω b, which typically takes values of tens of THz in localized molecular vibrations. The values set throughout the article are presented in Table 1, unless stated otherwise. The values of the damping rates for plasmonic and vibrational excitations match a recent experimental realization of nanocavity-enhanced SFG [33] (see Table 2), with the main difference that we choose a lower quality factor of the VIS/NIR plasmonic mode. The effective coupling rates g IR and g c are kept significantly smaller than the inferred single-molecule experimental values from Ref. [33] (see Table 2) because of computational limitations in the size of the total Hilbert space. We discuss further in Appendix D what are the experimentally achievable values of g IR and g c and the expected upconverted photon rates.
Default parameters used in the article, unless stated otherwise.
| ω b | ω d | γ | κ c | κ IR | Δc | n th | g IR | g c |
|---|---|---|---|---|---|---|---|---|
| 1 | 1 | 10–3 | 4 | 0.3 | 0 | 10–4 | 10–5 | 10–5 |
The dimensionless thermal occupancy is set as
2.2 Harmonic vibration
We begin with results obtained under the harmonic potential approximation for the vibrational mode, i.e., χ = 0. Vibrational Raman (anti-Stokes side of the VIS/NIR laser) and VSFG spectra are shown in Figure 2a for various MIR laser frequencies. Each spectrum features a broad and MIR-laser-independent peak corresponding to thermally-activated spontaneous Raman scattering. For increasing VIS/NIR laser power, this peak can grow in intensity through vibrational pumping [77], [78], which is a consequence of quantum back-action in the formalism of molecular cavity optomechanics used here [79]. In our study, we keep the VIS/NIR laser power low enough that this effect is negligible.
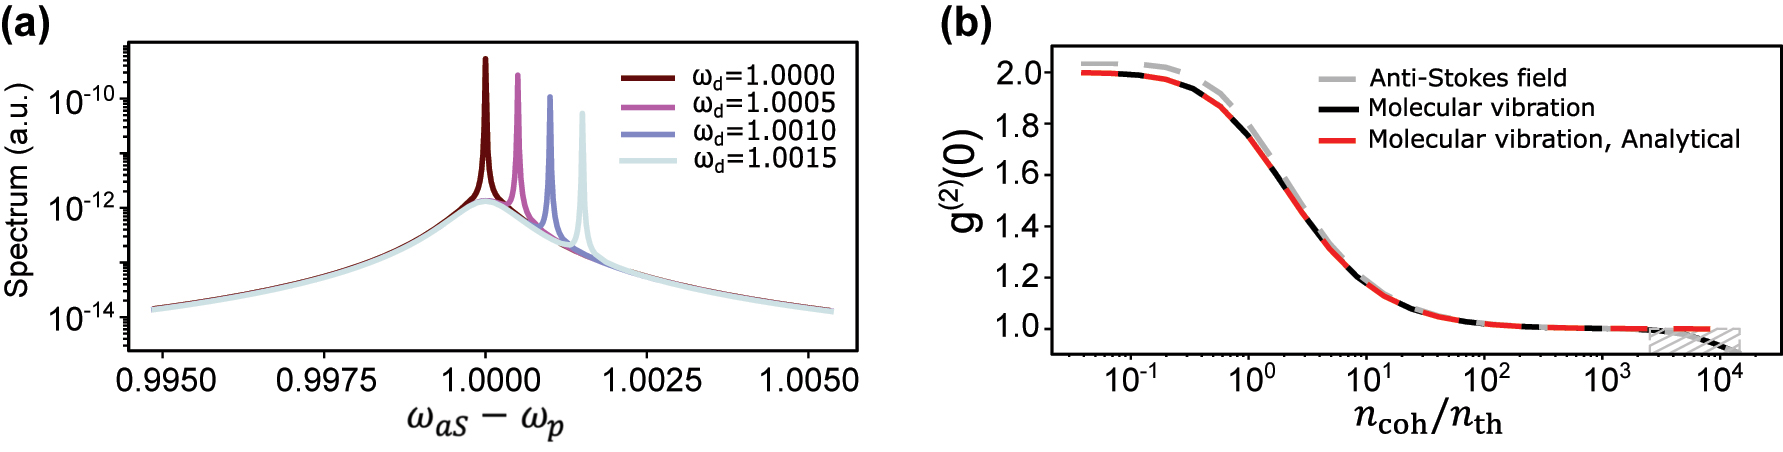
VSFG under harmonic vibrational potential. (a) Anti-Stokes spectra at various mid-infrared laser frequencies. The sharp peak, with its frequency shifting in accordance with the MIR laser frequency, exhibits a linewidth that corresponds to the filter’s characteristics. (b) Second-order correlation function of anti-Stokes photons,
On top of the broad anti-Stokes Raman peak, the coherently upconverted VSFG signal at a frequency ω p + ω d can be seen. Since the driving lasers in our simulation have perfectly defined frequencies, the linewidth of this signal is set only by the linewidth of the filter (see Appendix B), while its frequency is set by energy conservation to the sum of the MIR and VIS/NIR laser frequencies. This behavior was experimentally evidenced in Ref. [33]. In practice, the lineshape of the VSFG signal is expected to be a convolution of those of the two driving lasers.
In order to quantify the photon or phonon statistics and second-order coherence properties of the fields we compute the second-order correlation function at zero time delay, defined for a particular mode j as:
Throughout this paper, whenever we refer to the g (2)(0) of molecular vibrations (phonons), we apply the formula given above. Eq. (5) disregards the frequency content of the mode and the resulting correlation function is frequency-blind. It is problematic when studying the statistics of the cavity field fluctuations since they contain both Stokes and anti-Stokes scattering contributions, only the latter being of interest here. In order to obtain frequency-resolved photon statistics of the emission of the system, we employ the method proposed in Ref. [42], consisting of including explicit detectors with Lorentzian frequency responses in the simulation.
More explicitly, to compute the cross-correlation between the frequency components ω 1 and ω 2 of the cavity mode fluctuations δa c, the following Hamiltonians are added to the system’s Hamiltonian in Eq. (4):
where ζ
1 and ζ
2 are bosonic annihilation operators of the two level systems, having decay rates of Γf1 and Γf2 respectively which define the filters linewidth in our model. To maintain the system’s solution unperturbed, ϵ must be sufficiently small, satisfying the condition
For simplicity, we will later omit the subscript δa c, as it is the only mode to which the frequency-resolved method is applied. Additionally, since we only compute the auto-correlation at the anti-Stokes frequency ω aS we introduce the following notation:
Figure 2b shows that as the MIR drive strength increases, both the vibrational mode and the VSFG field exhibit a transition from a thermal state to a coherent state. In this figure, the x-axis represents a dimensionless quantity, defined later by Eq. (10) and Eq. (11), which scales linearly with the MIR laser power. The x-axis values are derived by sweeping over the MIR drive strength while keeping other parameters fixed. At low enough MIR drive, the vibrational mode is in thermal equilibrium and the anti-Stokes signal is dominated by spontaneous Raman scattering that inherits the same thermal statistics corresponding to g (2)(0) = 2 [80]. As the MIR drive increases, the coherent contribution of VSFG to the displaced thermal state increases and g (2)(0) asymptotically reaches 1.
One can gain more insight into this behavior by considering the Hamiltonian of the vibrational mode in the rotating frame.
The second term corresponds to a coherent displacement of the initial thermal state. In the special case of zero temperature (n th = 0), the solution for the vibrational mode is a coherent state |β⟩ of amplitude.
It is convenient to define a coherent population n coh as
which corresponds to the average number of excitations in the vibrational mode when g c = 0 and n th = 0.
In the general case of arbitrary n th, the mean vibrational population is given by
with
The non-normalized second-order correlation is given by:
and after normalization
which is the analytical expression plotted as a dashed red curve in Figure 2b. The hashed area at high n coh shows the domain where the Hilbert space truncation causes inaccuracies in the numerical solution. We therefore limit future calculations to MIR powers below this value.
2.3 Anharmonicity in the vibration
In reality, vibrational modes of small molecules have non-negligible anharmonicities [81], responsible for temperature-dependent Raman shifts and lineshapes [82] and for the observation of so called ‘hot bands’ in Raman scattering when the anharmonicity is larger than the peak linewidth [73].
The main insight of this work is that the presence of this anharmonicity introduces rich features in the spectral properties of the emission, particularly in its statistics. This is shown in Figure 3, where we plot both the spectrum and the frequency-resolved second-order correlation,
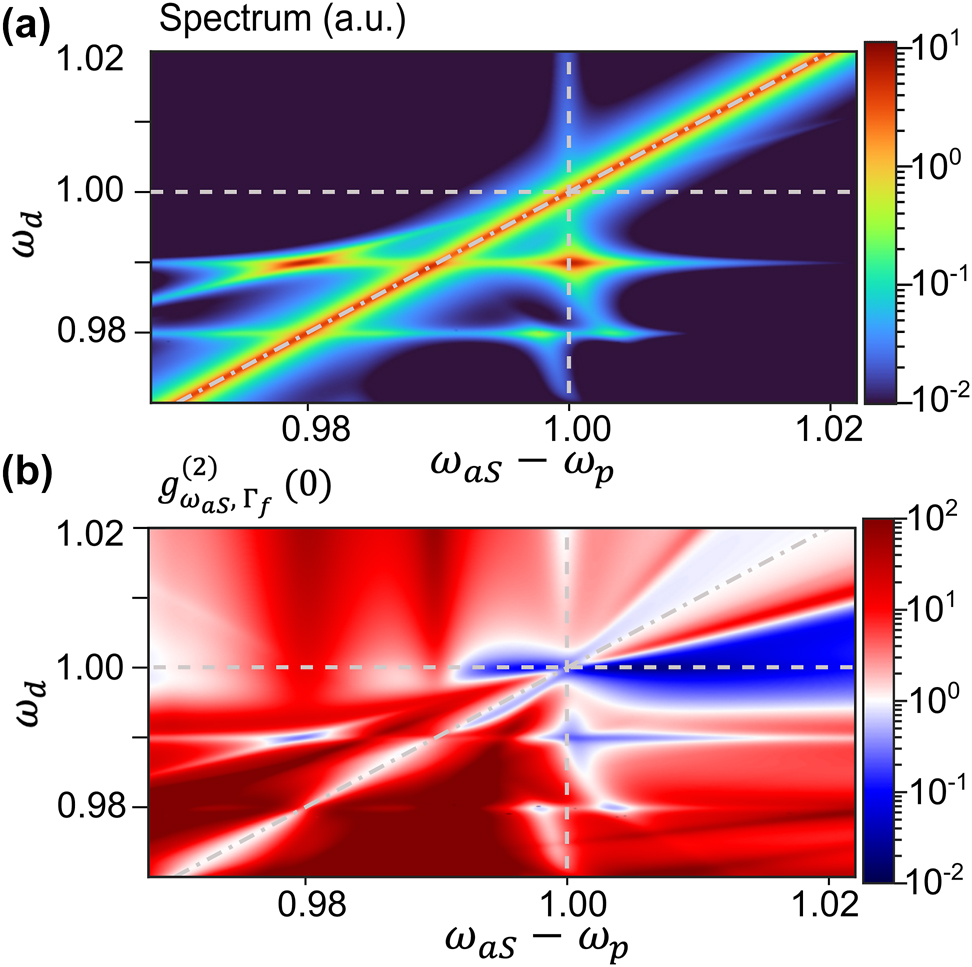
VSFG under anharmonic vibrational potential. Maps of the (a) emission intensity and (b) second-order correlation function of the filtered anti-Stokes field as a function of the MIR driving frequency ω d and VIS/NIR emission Raman shift ω aS − ω p, under strong MIR driving (g IR = 10−4 or equivalently n coh = 0.04 for ω d = 1). The dot-dashed grey lines indicate ω d = ω aS − ω p.
Regarding photon statistics, the VSFG signal is observed to be antibunched provided that it overlaps with the incoherent anti-Stokes background, i.e., that the driving frequency is close to the vibrational transition, ω d ≈ ω b. This establishes that the incoherent background due to the anti-Stokes process must be present to obtain strong antibunching, in accordance with the recent understanding of antibunching in resonance fluorescence as a consequence of interference between coherent and incoherent terms [38], [39], [40], [41]. A second prominent antibunching feature is observed under driving at the two-photon resonance ω d = 0.99, which leads to antibunched emission at the two frequencies ω aS − ω p = {0.98, 1}. Moreover, the frequency-resolved cross-correlation measured at these two frequencies (not shown) reveals a large bunching, g (2)(ω aS,1 − ω p = 1, ω aS,2 − ω p = 0.98) ≈ 8, indicating that these photons are produced in pairs through cascaded emission. This could be exploited for the generation of entangled photon pairs in the VIS or NIR range, which could be potentially useful for quantum communication protocols.
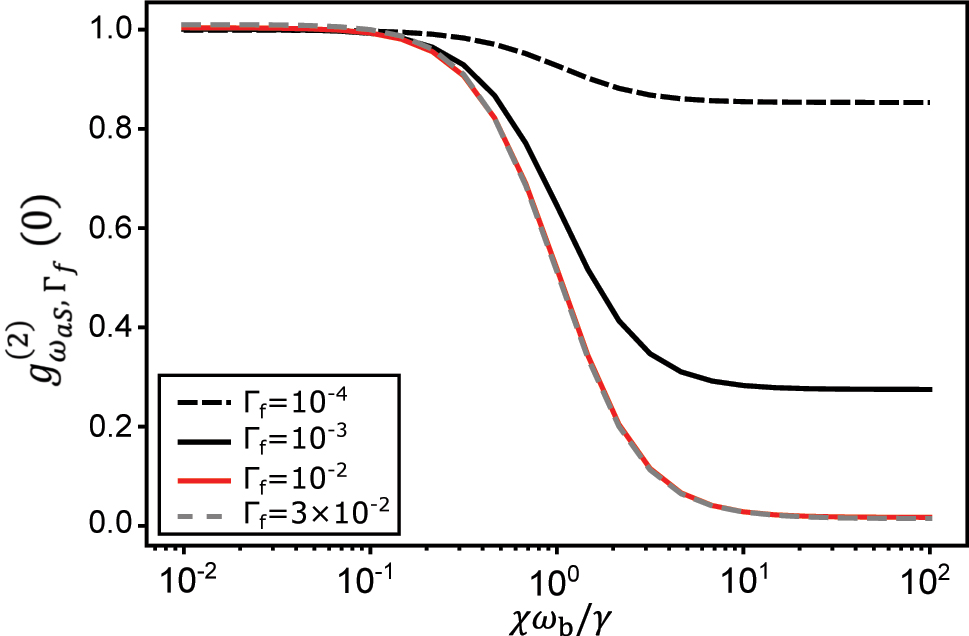
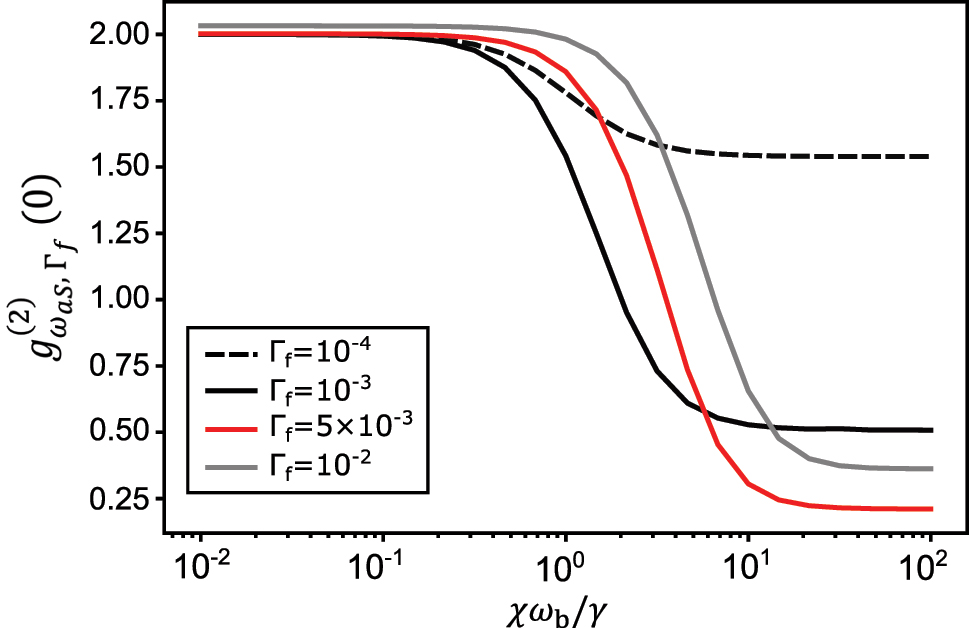
Further understanding of this phenomena and its dependence on the anharmonicity χ can be obtained by analyzing the fluctuations of the vibrational degree of freedom. Under the assumption of g IR ≪ γ, g c = 0 and n th = 0, the second-order coherence of the resonantly driven vibrational mode has an analytical expression (see, for example, Ref. [39]):
This expression is shown as a dashed red curve in Figure 4a, against the dimensionless parameter χω
b/γ, showing excellent agreement with the numerical computation of
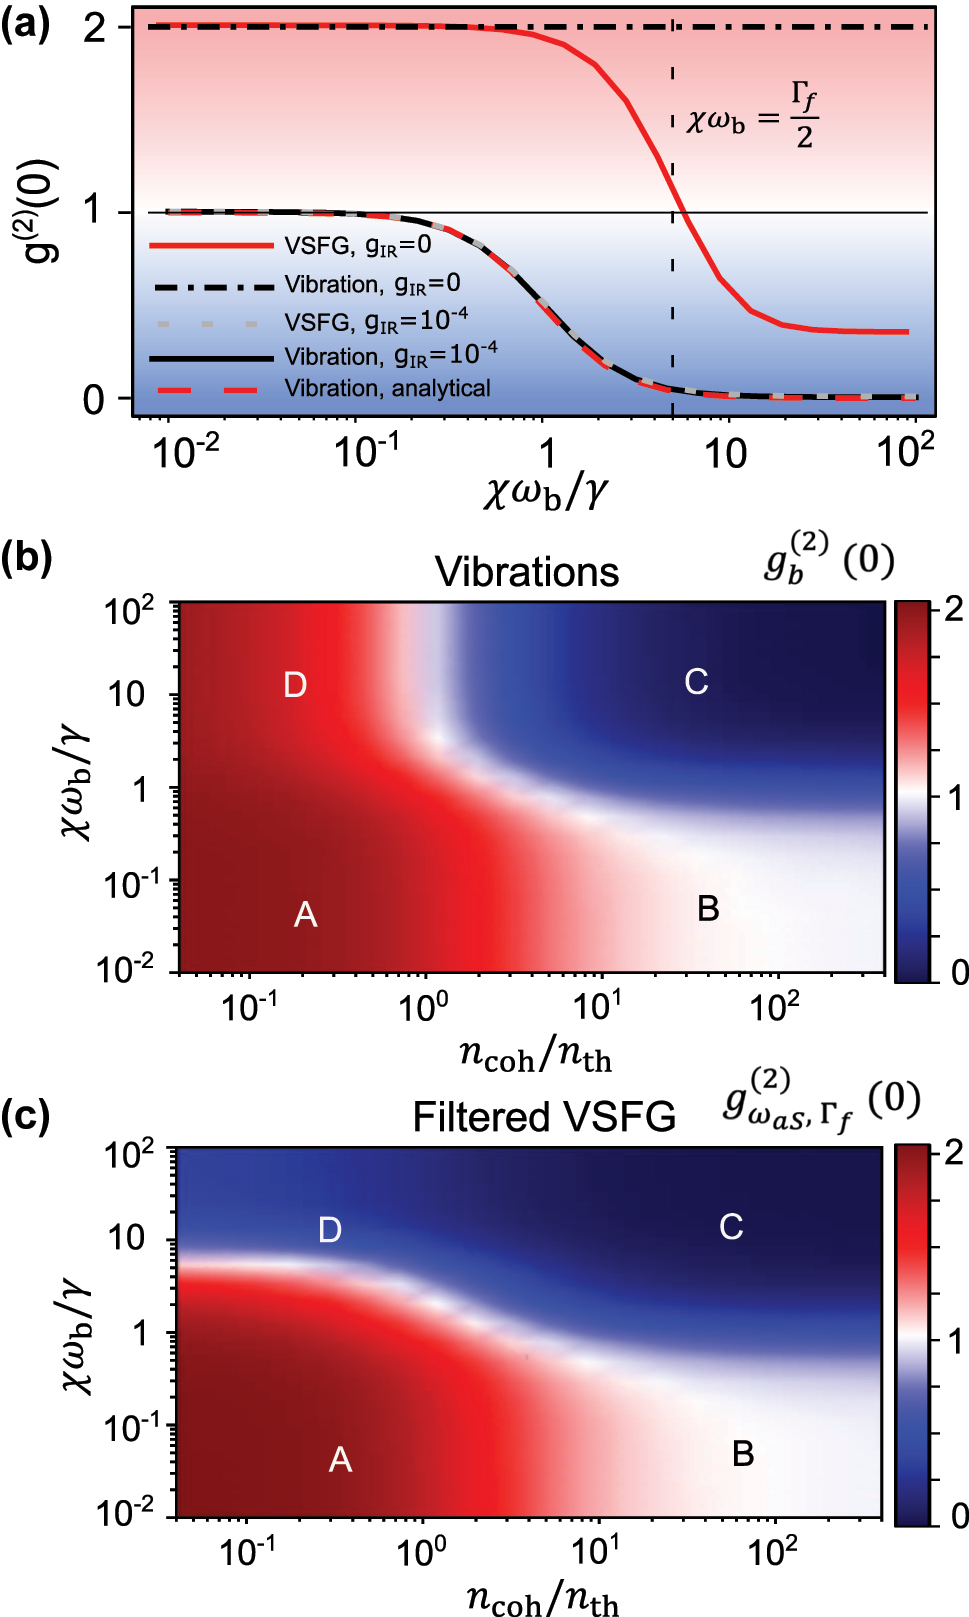
Regimes of statistics of VSFG (a) evolution of frequency-blind second-order correlation function of the vibrational mode,
Most importantly, all calculations confirm that when the anharmonicity is larger than the vibrational linewidth, χω b > γ, the filtered anti-Stokes signal becomes strongly antibunched. This condition can also be written χ > 1/Q m where Q m is the quality factor of the vibration. However, it should be noted that, even though the main emission line is coherent and narrow (limited by the filter linewidth), antibunching is only observed if the emission from a sufficiently broad frequency interval is included (see Figure 7 in Appendix B), i.e., if the filter is not too narrow and the incoherent background is included. Therefore, joint narrow linewidths and single-photon emission cannot be straightforwardly obtained, as has been recently illustrated in resonance fluorescence in driven two-level systems [38], [39], [40], [41].
This result should be compared with the curves obtained without MIR drive plotted with solid red and dot-dashed black lines in Figure 4a, corresponding to the case of spontaneous Raman scattering from a single molecule. In this case, while the vibrational mode remains in thermal equilibrium, it is also possible to observe photon antibunching in the spectrally filtered anti-Stokes field, but only under the intuitive condition that the anharmonicity exceeds the filter linewidth Γf. There are two other major drawbacks with this undriven approach: First, the spontaneous anti-Stokes photon flux can only be increased by increasing the VIS/NIR pump power, which more readily induces damage to the nanocavity [83]. Second, the first-order coherence property of the anti-Stokes field is dictated by that of the molecular vibration, for which the linewidth γ can have non-negligible contributions from pure dephasing, thereby degrading the indistinguishability of the antibunched photons.
In order to capture the different regimes of photon statistics for the upconverted signal, we plot in Figs. 4b and c the second-order correlation function for the vibration and the filtered anti-Stokes field as functions of
2.4 Few molecules
Achieving single molecule Raman spectroscopy remains a nontrivial experimental task despite multiple demonstrations since its first observation in 1997 [84]. We therefore investigate whether antibunching persists in the presence of several molecules that contribute to VSFG. In the limit of a large number of molecules, collective vibrational excitations are expected to become perfectly harmonic, which is a general result for an ensemble of two-level systems [85]. But in our system the increase in the number of molecules leads to an increase in the collective resonant (MIR) and optomechanical (VIS/NIR) coupling strengths, potentially resulting in the excitation of higher excited vibrational states thereby recovering the anharmonicity. To clarify the expected trend, we perform complete numerical evaluation of the model with N = 1, 2 and 3 molecules. For simplicity, we consider that all molecules are identical and have the same coupling rates to the common nanocavity modes:
The second-order correlation g (2)(0) for the filtered anti-Stokes field obtained from the solution to the corresponding Lindblad master equation is plotted in Figure 5 for N = 1, 2, 3, with (solid lines) and without (dashed lines) an MIR drive. The results confirm the intuition from the large N limit: the degree of achievable antibunching quickly decreases as the number of molecules participating in Raman scattering and VSFG increases. Interestingly, we find that this decrease cannot be compensated by arbitrarily increasing the anharmonicity of each molecule as characterized by the parameter χ. This can be attributed to the fact that for large enough anharmonicity, each vibration acts as a two-level system, and the collective behavior of the ensemble is dominated by the harmonic limit mentioned above.
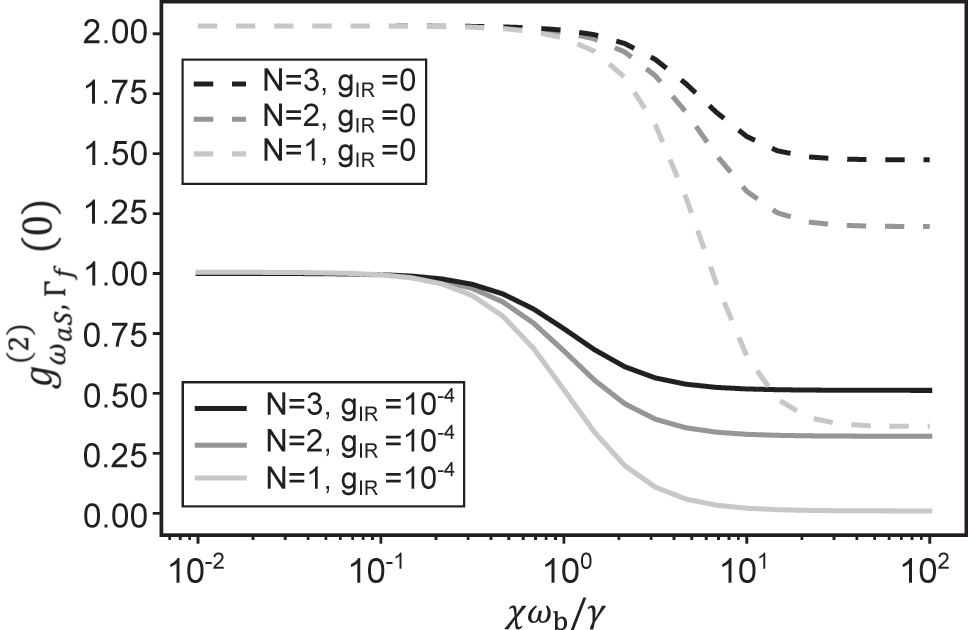
Frequency-filtered second-order correlation function of the anti-Stokes field,
3 Conclusions
We proposed a new scheme to produce antibunched photons by performing vibrational sum-frequency generation on a single molecule. Our method leverages the anharmonicity naturally present in the potential of vibrational modes that are localized on few molecular bonds to realize a form of conventional photon blockade without the need for strong light-matter coupling. Our calculations show that under sufficiently strong MIR drive, characterized by the ratio of coherent to thermal vibrational population
Our proposal is feasible with current experimental capabilities. The main requirement is to be able to measure Raman scattering from a single molecule, which can be achieved in various plasmonic nanoantennas and scanning tip systems [87]. Efficient coupling of MIR light into the system can be achieved using dual-resonant plasmonic antennas [33], [88] or the broadband nanofocusing capabilities of metallic tips [89], [90]. The main foreseen difficulty will be to spectrally and temporally isolate the antibunching dip in the anti-Stokes photon flux: First, the broadband non-resonant SFG coming from the metallic surface and the molecule’s electronic response [91] must be kept smaller than the vibrational contribution to SFG. Second, the experiment should be conducted under picosecond pulsed excitation to resolve the antibunching in time by outcompeting the relaxation of molecular vibrations on a substrate [92].
Under pulsed excitation, it is also possible to make the photon generation scheme deterministic by adjusting the VIS/NIR pulse intensity to reach unity vibration-to-photon conversion efficiency [93]; but it requires that the optomechanical nanocavity is deep in the resolved-sideband regime so as to suppress spontaneous Stokes scattering. Prospective single-photon rates achievable in this regime with our proposed scheme are discussed in Appendix D. The richness and versatility of the proposed scheme may also open perspectives for the generation of entangled photons and quantum metrology applications based on the detection of photon correlations, while offering a spectroscopic method for the characterisation of vibrational anharmonicity at the single-molecule level.
Funding source: Schweizerischer Nationalfonds zur Foerderung der Wissenschaftlichen Forschung (SNSF)
Award Identifier / Grant number: 198898
Award Identifier / Grant number: 214993
Funding source: H2020 European Research Council
Award Identifier / Grant number: 820196
Award Identifier / Grant number: PID2023-149969NA-I00
Award Identifier / Grant number: PID2021-125894NB-I00
Award Identifier / Grant number: EUR2023-143478
Award Identifier / Grant number: CEX2023-001316-M (through the María de Maeztu program for Units of Excellence in R&D)
Funding source: Comunidad de Madrid
Award Identifier / Grant number: Proyecto Sinergico CAM 2020 Y2020/TCS-6545
Funding source: European Union
Award Identifier / Grant number: 101070700
Acknowledgements
CG and FMK acknowledge Hanyuan Hu and Philippe Roelli for initial code development related to this study and for fruitful discussions.
-
Research funding: This work has received funding from the European Union’s Horizon 2020 research and innovation program under Grant Agreement no. 820196 (ERC CoG QTONE) and from the Swiss National Science Foundation (project numbers 214993 and 198898). This work was also supported by Spanish Agencia Estatal de Investigación, Ministerio de Ciencia y Universidades (PID2023-149969NA-I00, PID2021-125894NB-I00, EUR2023-143478, CEX2023-001316-M – through the María de Maeztu program for Units of Excellence in R&D), Comunidad de Madrid (Proyecto Sinergico CAM 2020 Y2020/TCS-6545), European Union (101070700).
-
Author contributions: All authors participated in elaborating the text and figures of the paper, accepted responsibility for the entire content of this manuscript, and approved its submission. FMK developed the code under the guidance of CSM and JF. FC performed the DFT calculations. CSM, JF, and CG supervised the research and the data analysis.
-
Conflict of interest: Authors state no conflicts of interest.
-
Data availability: The datasets generated and analysed during the current study are available in the Zenodo repository at https://doi.org/10.5281/zenodo.14594517.
Appendix A: Beam splitter interaction
Assuming that the optomechanical coupling is small compared to the infrared coupling in Eq. (4), g
IR ≫ g
c, one can neglect quantum backaction of the cavity mode on the vibration, whose state is then mostly governed by the coupling to the MIR field and to the environment. To estimate the state of optical mode at the anti-Stokes sum-frequency sideband of the VIS/NIR laser, we need to treat the optomechanical coupling term,
where g = ∥g c∥ and θ = arg (g c). It is a general beam splitter interaction as depicted in Figure 6 with the relation between input and output operators given by
where g characterizes the beam splitter transmission ratio through t = cos g and r = sin g, see Figure 6.
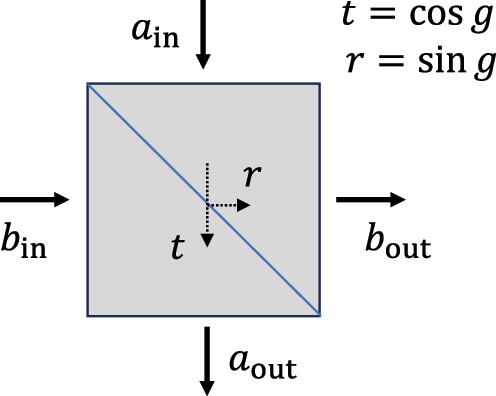
Beam splitter with transmission and reflection coefficients of t and r and two input arms and two output arms.
In our context, the input modes of the beam splitter are populated by vacuum fluctuations for the anti-Stokes field a
in and by the thermal and MIR-driven vibrational state for b
in; the output mode a
out corresponds to the emitted anti-Stokes field on which the g
(2)(0) measurement is performed, while b
out reflects the state of the vibration modified by the anti-Stokes part of the optomechanical interaction, but it is a weak perturbation since we neglect quantum backaction. Finally, a known result is that, when one of the input mode is in a vacuum state, the g
(2)(0)’s of both outgoing fields from a beam splitter are equal to that of the non-vacuum input port, in particular here
Appendix B: Impact of filter linewidth on the measured
g
ω
aS
,
Γ
f
(
2
)
(
0
)
As investigated in Ref. [96], too narrow spectral filtering may alter the intrinsic photon statistics of a single photon source into that of a thermal state. In our study, under strong MIR-drive, the intensity of the anti-Stokes field is dominated by VSFG over spontaneous Raman scattering, there is no need to aggressively filter the signal; the role of filtering is here to suppress the contribution to g (2) from spontaneous Stokes scattering and VDFG (difference frequency) on the other side of the VIS/NIR laser. We show in Figure 7 that, as found in Ref. [96], a decrease in filter linewidth destroys antibunching in the filtered field. That’s why we chose Γf = 10γ = 10−2 for all figures in the main text under MIR drive.
Variation of the second-order correlation function of the filtered anti-Stokes field
In the absence of MIR drive, photon antibunching is only obtained by rejecting anti-Stokes photons coming from the second (and higher) vibrational transition, which is detuned by χω
b from the first one, imposing an upper limit on filter linewidth Γf ≤ χω
b. Besides, the constraint χω
b ≥ γ remains, as for any conventional photon blockade scheme, leading to γ, Γf ≤ χω
b. Finally, as reminded above, filtering below the natural linewidth of the anti-Stokes photons γ degrades antibunching by ‘thermalizing’ the photon statistics, imposing Γf ≥ γ. Altogether we obtain the stringent constraints γ ≤ Γf ≤ χω
b, which leaves little room for the choice of Γf since in practice the anharmonicity is not much greater than γ. This parameter space is explored in Figure 8. Overall, for a fixed filter linewidth, the transition to an antibunched state occurs when
Variation of the second-order correlation function of the filtered anti-Stokes field
Appendix C: Approximations
To derive Eq. (3), several approximations are employed. First, the rotating wave approximation is applied to the MIR coupling term. Second, both the MIR and VIS/NIR modes are linearized since their coupling rates to the vibration are both assumed to be small compared to all other energies in the Hamiltonian. Consequently, a c is expressed as α c + δa c, where α c is the solution in the absence of the optomechanical coupling term, representing a coherent state, and δa c represents the fluctuations induced by the optomechanical coupling term. Additionally, a IR is replaced by α IR, with α IR representing the coherent state in the absence of the MIR coupling term. The fluctuations in this case are neglected for simplicity, as the primary interest lies in the VSFG field properties contained in δa c.
Next, since the simplified Hamiltonian, Eq. (4), is periodically time-dependent, a Floquet solution of the following form has been considered for the Lindbladian master equation:
where in principle the bounds of the sum must go to infinity. Nevertheless, we truncate at n b = 4 and it is verified that considering more terms does not change the results.
Appendix D: Achievable single photon rates
As explained in the main text, computational costs quickly become prohibitive as the size of the Hilbert space increases. Consequently, when using the single-molecule coupling rates inferred from the experiment of Ref. [33] and summarized here in Table 2, very low laser powers of P IR = 20 nW and P c = 0.2 nW must be assumed in order to yield the effective coupling rates mentioned in Table 1. We note that these values correspond to the powers effectively coupled to the nanocavity, factoring out the in-coupling efficiency [98]. For such values, the outgoing rate of single photons is computed to be on the order of 100 Hz (again, not accounting for out-coupling efficiency). We now discuss the experimental prospects for higher photon rates.
Experimental parameters inferred from Ref. [33] for the case where the nanocavity would contain a single molecule. All values are expressed in Hz instead of rad/s, so that factors 2π are implicit. Note that the value of γ is that measured for the ensemble and includes inhomogeneous broadening; it will likely be smaller for a single molecule, for which coherence times beyond 10 ps have been reported [97].
| ω b | γ |
|
|
n th | ω d | ω p |
|---|---|---|---|---|---|---|
| 30 THz | 0.3 THz | 6 GHz | 60 GHz | 10– 4 | 30 THz | 300 THz |
| ω IR | ω c | κ IR | κ c | |||
| 30 THz | 300 THz | 10 THz | 30 THz |
When increasing the in-coupled MIR power to 300 nW, and for a sufficiently large anharmonicity so that we can use a two-level-system approximation, we compute that the Rabi frequency for the transition between the lowest two vibrational levels is comparable to the vibrational decay rate, indicating the regime of saturation. In this regime, the outgoing single-photon rate is mainly determined by the vibration-to-VIS/NIR photon conversion efficiency through the optomechanical interaction. This conversion efficiency has an analytical formula in the resolved-sideband regime [99] in terms of the optomechanical cooperativity
Altogether, the above considerations suggest that the single-photon source proposed here could be made to operate quasi-deterministically under pulsed excitation at moderate laser powers – provided that the optomechanical interaction takes place in the well resolved sideband regime, i.e., κ < ω b. If not, spurious noise from Stokes scattering causing vibrational pumping (quantum backaction) is expected to degrade antibunching for too large optomechanical driving strengths. Finally, we refer to a recent experiment where incoherent MIR to VIS conversion from a nanocavity-embedded single molecule was reported with an efficiency of 0.1 [101] for moderate pump powers. This experiment benefited from the VIS electronic resonance to obtain high anti-Stokes fluorescence rate, at the cost of losing the coherence of the process – which is critical in our proposal. Nevertheless, Ref. [101] suggests that high conversion efficiencies are possible also in the coherent upconversion regime with optimized dual-resonant nanocavities or scanning tip geometries [102], [103] and tailored molecules with high Raman cross-sections [104], [105], [106].
Appendix E: Magnitude of the anharmonicity for relevant molecules
In this Section, we show that typical organic molecules used in SERS and VSFG experiments feature sufficiently large anharmonicities to fall in the regime of photon antibunching uncovered in the main text. We take thiophenol (TP) as a representative example: it is a small organic molecule (see Figure 9) amenable to precise calculations; moreover, TP self-assembled monolayer (SAM) on gold were experimentally characterized by VSFG, revealing several active vibrational modes in the 1,000–1,100 cm−1 window [107]. We perform density functional theory (DFT) calculations on TP and Au-bound thiophenol (GTP) molecules using the Gaussian16 [108] quantum chemistry code. We employ the B3LYP functional with empirical dispersion correction (GD3BJ) due to its accurate performance in anharmonicity calculations documented in Ref. [109], combined with the Def2TZVPPD basis set. Geometry optimization was performed with tight convergence criteria (i.e., 10−5 Hartree/Bohr and 4 × 10⁻⁵ Bohr on RMS forces and displacements, respectively, with thresholds for the maximum values being 1.5 times larger), and the ground state minima were confirmed by Hessian evaluations. Harmonic energies were obtained using analytic second derivatives of the energy, and third and fourth order numerical derivatives. Anharmonic simulations were performed using the GVPT2 model implemented in Gaussian16.
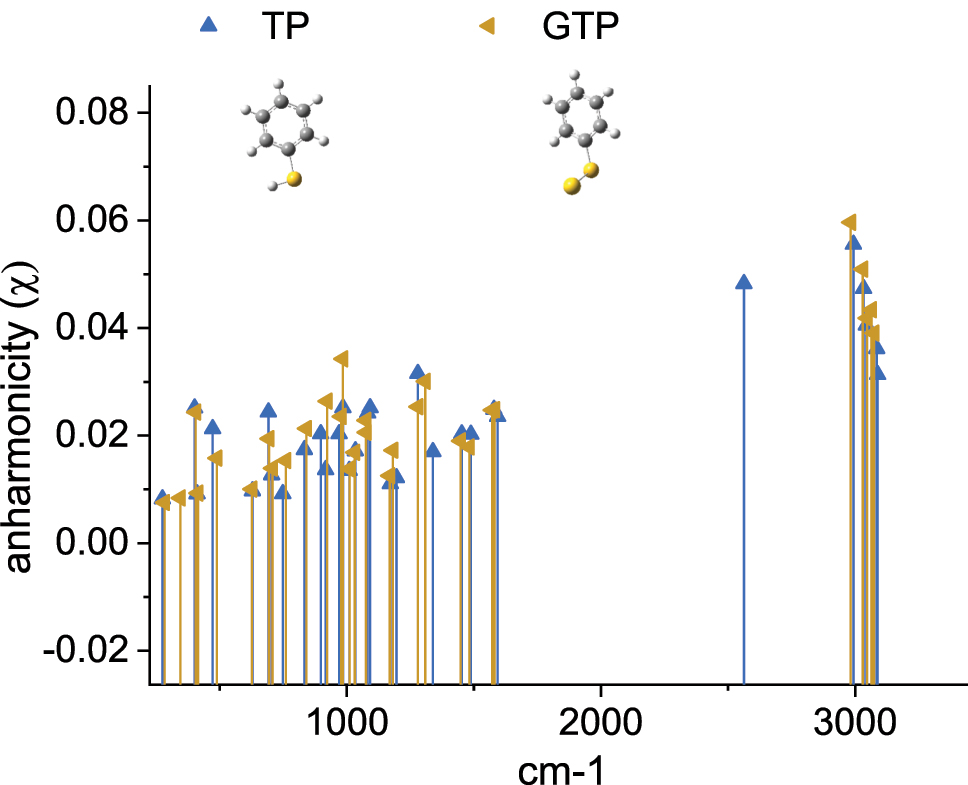
Value of the anharmonicity parameter χ computed by DFT for thiophenol (TP, blue triangle) and gold-bound thiophenol (GTP, orange triangle) plotted against the normal mode frequency.
To follow the conventional notation in physical chemistry, we write the energy of the vibrational level n of an anharmonic oscillator as:
where
From this system of equations we can express
For most of the modes, the anharmonic parameter χ (as defined in the main text) is between 1 and 5 % (see Figure 9), with the C–H stretching modes characterized by higher anharmonicity, as experimentally observed on methyloxiirane, for example [110]. These values are also compatible with recent experimental findings in SERS [86].
References
[1] M. D. Eisaman, J. Fan, A. Migdall, and S. V. Polyakov, “Invited review article: Single-photon sources and detectors,” Rev. Sci. Instrum., vol. 82, no. 7, p. 071101, 2011. https://doi.org/10.1063/1.3610677.Search in Google Scholar PubMed
[2] E. Knill, R. Laflamme, and G. J. Milburn, “A scheme for efficient quantum computation with linear optics,” Nature, vol. 409, no. 6816, pp. 46–52, 2001. https://doi.org/10.1038/35051009.Search in Google Scholar PubMed
[3] A. D. Greentree and L. C. L. Hollenberg, “High-performance diamond-based single-photon sources for quantum communication,” Phys. Rev. A, vol. 80, no. 5, p. 052308, 2009. https://doi.org/10.1103/physreva.80.052308.Search in Google Scholar
[4] M. Müller, et al.., “Quantum-dot single-photon sources for entanglement enhanced interferometry,” Phys. Rev. Lett., vol. 118, no. 25, p. 257402, 2017. https://doi.org/10.1103/physrevlett.118.257402.Search in Google Scholar
[5] C. Santori, D. Fattal, J. Vučković, G. S. Solomon, and Y. Yamamoto, “Indistinguishable photons from a single-photon device,” nature, vol. 419, no. 6907, pp. 594–597, 2002. https://doi.org/10.1038/nature01086.Search in Google Scholar PubMed
[6] A. V. Kuhlmann, et al.., “Transform-limited single photons from a single quantum dot,” Nat. Commun., vol. 6, no. 1, p. 8204, 2015. https://doi.org/10.1038/ncomms9204.Search in Google Scholar PubMed PubMed Central
[7] C. Zhang, Y.-F. Huang, B.-H. Liu, C.-F. Li, and G.-C. Guo, “Spontaneous parametric down-conversion sources for multiphoton experiments,” Adv. Quant. Technol., vol. 4, no. 5, p. 2000132, 2021. https://doi.org/10.1002/qute.202000132.Search in Google Scholar
[8] K. Garay-Palmett, D. B. Kim, Y. Zhang, F. A. Domínguez-Serna, V. O. Lorenz, and A. B. U’Ren, “Fiber-based photon-pair generation: Tutorial,” JOSA B, vol. 40, no. 3, pp. 469–490, 2023. https://doi.org/10.1364/josab.478008.Search in Google Scholar
[9] D. C. Burnham and D. L. Weinberg, “Observation of simultaneity in parametric production of optical photon pairs,” Phys. Rev. Lett., vol. 25, pp. 84–87, 1970. https://doi.org/10.1103/physrevlett.25.84.Search in Google Scholar
[10] Y. Wang, K. D. Jöns, and Z. Sun, “Integrated photon-pair sources with nonlinear optics,” Applied Physics Reviews, vol. 8, no. 1, 2021. https://doi.org/10.1063/5.0030258.Search in Google Scholar
[11] M. Esmann, S. C. Wein, and C. Antón-Solanas, “Solid-state single-photon sources: Recent advances for novel quantum materials,” Adv. Funct. Mater., p. 2315936, 2024, https://doi.org/10.1002/adfm.202315936.Search in Google Scholar
[12] L. Tian and H. Carmichael, “Quantum trajectory simulations of two-state behavior in an optical cavity containing one atom,” Phys. Rev. A, vol. 46, p. R6801, 1992, https://doi.org/10.1103/physreva.46.r6801.Search in Google Scholar PubMed
[13] K. M. Birnbaum, A. Boca, R. Miller, A. D. Boozer, T. E. Northup, and H. J. Kimble, “Photon blockade in an optical cavity with one trapped atom,” Nature, vol. 436, no. 7047, pp. 87–90, 2005. https://doi.org/10.1038/nature03804.Search in Google Scholar PubMed
[14] H. J. Kimble, M. Dagenais, and L. Mandel, “Photon antibunching in resonance fluorescence,” Phys. Rev. Lett., vol. 39, no. 11, p. 691, 1977. https://doi.org/10.1103/physrevlett.39.691.Search in Google Scholar
[15] T. Basché, W. Moerner, M. Orrit, and H. Talon, “Photon antibunching in the fluorescence of a single dye molecule trapped in a solid,” Phys. Rev. Lett., vol. 69, no. 10, p. 1516, 1992. https://doi.org/10.1103/physrevlett.69.1516.Search in Google Scholar PubMed
[16] Y. Arakawa and M. J. Holmes, “Progress in quantum-dot single photon sources for quantum information technologies: A broad spectrum overview,” Applied Physics Reviews, vol. 7, no. 2, p. 021309, 2020. https://doi.org/10.1063/5.0010193.Search in Google Scholar
[17] A. Högele, C. Galland, M. Winger, and A. Imamoğlu, “Photon antibunching in the photoluminescence spectra of a single carbon nanotube,” Phys. Rev. Lett., vol. 100, no. 21, p. 217401, 2008. https://doi.org/10.1103/physrevlett.100.217401.Search in Google Scholar
[18] R. Brouri, A. Beveratos, J.-P. Poizat, and P. Grangier, “Photon antibunching in the fluorescence of individual color centers in diamond,” Opt. Lett., vol. 25, no. 17, pp. 1294–1296, 2000. https://doi.org/10.1364/ol.25.001294.Search in Google Scholar PubMed
[19] C. Kurtsiefer, S. Mayer, P. Zarda, and H. Weinfurter, “Stable solid-state source of single photons,” Phys. Rev. Lett., vol. 85, no. 2, p. 290, 2000. https://doi.org/10.1103/physrevlett.85.290.Search in Google Scholar PubMed
[20] P. Roelli, D. Martin-Cano, T. J. Kippenberg, and C. Galland, “Molecular platform for frequency upconversion at the single-photon level,” Phys. Rev. X, vol. 10, no. 3, p. 031057, 2020. https://doi.org/10.1103/physrevx.10.031057.Search in Google Scholar
[21] C. Toninelli, et al.., “Single organic molecules for photonic quantum technologies,” Nat. Mater., vol. 20, no. 12, pp. 1615–1628, 2021. https://doi.org/10.1038/s41563-021-00987-4.Search in Google Scholar PubMed
[22] J. M. Zadrozny, J. Niklas, O. G. Poluektov, and D. E. Freedman, “Millisecond coherence time in a tunable molecular electronic spin qubit,” ACS Cent. Sci., vol. 1, no. 9, pp. 488–492, 2015. https://doi.org/10.1021/acscentsci.5b00338.Search in Google Scholar PubMed PubMed Central
[23] M. Colautti, et al.., “Laser-induced frequency tuning of fourier-limited single-molecule emitters,” ACS Nano, vol. 14, no. 10, pp. 13584–13592, 2020. https://doi.org/10.1021/acsnano.0c05620.Search in Google Scholar PubMed
[24] C. M. Lange, E. Daggett, V. Walther, L. Huang, and J. D. Hood, “Superradiant and subradiant states in lifetime-limited organic molecules through laser-induced tuning,” Nat. Phys., vol. 1, pp. 1–7, 2024.10.21203/rs.3.rs-3267013/v1Search in Google Scholar
[25] S. Faez, P. Türschmann, H. R. Haakh, S. Götzinger, and V. Sandoghdar, “Coherent interaction of light and single molecules in a dielectric nanoguide,” Phys. Rev. Lett., vol. 113, no. 21, p. 213601, 2014. https://doi.org/10.1103/physrevlett.113.213601.Search in Google Scholar PubMed
[26] R. Chikkaraddy, et al.., “Single-molecule strong coupling at room temperature in plasmonic nanocavities,” Nature, vol. 535, no. 7610, pp. 127–130, 2016. https://doi.org/10.1038/nature17974.Search in Google Scholar PubMed PubMed Central
[27] D. Wang, H. Kelkar, D. Martin-Cano, T. Utikal, S. Götzinger, and V. Sandoghdar, “Coherent coupling of a single molecule to a scanning fabry-perot microcavity,” Phys. Rev. X, vol. 7, no. 2, p. 021014, 2017. https://doi.org/10.1103/physrevx.7.021014.Search in Google Scholar
[28] S. Grandi, et al.., “Hybrid plasmonic waveguide coupling of photons from a single molecule,” APL Photonics, vol. 4, no. 8, p. 086101, 2019. https://doi.org/10.1063/1.5110275.Search in Google Scholar
[29] D. Wang, et al.., “Turning a molecule into a coherent two-level quantum system,” Nat. Phys., vol. 15, no. 5, pp. 483–489, 2019. https://doi.org/10.1038/s41567-019-0436-5.Search in Google Scholar
[30] G. Wrigge, I. Gerhardt, J. Hwang, G. Zumofen, and V. Sandoghdar, “Efficient coupling of photons to a single molecule and the observation of its resonance fluorescence,” Nat. Phys., vol. 4, no. 1, pp. 60–66, 2008. https://doi.org/10.1038/nphys812.Search in Google Scholar
[31] P. Lombardi, et al.., “Photostable molecules on chip: Integrated sources of nonclassical light,” ACS Photonics, vol. 5, no. 1, pp. 126–132, 2018. https://doi.org/10.1021/acsphotonics.7b00521.Search in Google Scholar
[32] A. Pscherer, et al.., “Single-molecule vacuum Rabi splitting: Four-wave mixing and optical switching at the single-photon level,” Phys. Rev. Lett., vol. 127, no. 13, p. 133603, 2021. https://doi.org/10.1103/physrevlett.127.133603.Search in Google Scholar
[33] W. Chen, et al.., “Continuous-wave frequency upconversion with a molecular optomechanical nanocavity,” Science, vol. 374, no. 6572, pp. 1264–1267, 2021. https://doi.org/10.1126/science.abk3106.Search in Google Scholar PubMed
[34] S. Abutalebi, S. M. Ashrafi, H. R. Askari, and A. Bahrampour, “Single-photon generation at room temperature using molecular optomechanics in a hybrid photonic-plasmonic cavity,” Opt. Mater. Express, vol. 14, no. 9, pp. 2134–2147, 2024. https://doi.org/10.1364/ome.527639.Search in Google Scholar
[35] Y. Shen, “Surface properties probed by second-harmonic and sum-frequency generation,” Nature, vol. 337, no. 6207, pp. 519–525, 1989. https://doi.org/10.1038/337519a0.Search in Google Scholar
[36] H.-F. Wang, W. Gan, R. Lu, Y. Rao, and B.-H. Wu, “Quantitative spectral and orientational analysis in surface sum frequency generation vibrational spectroscopy (SFG-VS),” Int. Rev. Phys. Chem., vol. 24, no. 2, pp. 191–256, 2005. https://doi.org/10.1080/01442350500225894.Search in Google Scholar
[37] A. G. Lambert, P. B. Davies, and D. J. Neivandt, “Implementing the theory of sum frequency generation vibrational spectroscopy: A tutorial review,” Appl. Spectrosc. Rev., vol. 40, no. 2, pp. 103–145, 2005. https://doi.org/10.1081/asr-200038326.Search in Google Scholar
[38] J. C. L. Carreño, E. Z. Casalengua, F. P. Laussy, and E. del Valle, “Joint subnatural-linewidth and single-photon emission from resonance fluorescence,” Quantum Sci. Technol., vol. 3, no. 4, p. 045001, 2018. https://doi.org/10.1088/2058-9565/aacfbe.Search in Google Scholar
[39] E. Zubizarreta Casalengua, J. C. López Carreño, F. P. Laussy, and E. D. Valle, “Conventional and unconventional photon statistics,” Laser Photon. Rev., vol. 14, no. 6, p. 1900279, 2020. https://doi.org/10.1002/lpor.201900279.Search in Google Scholar
[40] C. L. Phillips, et al.., “Photon statistics of filtered resonance fluorescence,” Phys. Rev. Lett., vol. 125, no. 4, p. 043603, 2020. https://doi.org/10.1103/physrevlett.125.043603.Search in Google Scholar
[41] L. Hanschke, et al.., “Origin of antibunching in resonance fluorescence,” Phys. Rev. Lett., vol. 125, no. 17, p. 170402, 2020. https://doi.org/10.1103/physrevlett.125.170402.Search in Google Scholar
[42] E. del Valle, A. Gonzalez-Tudela, F. P. Laussy, C. Tejedor, and M. J. Hartmann, “Theory of frequency-filtered and time-resolved n-photon correlations,” Phys. Rev. Lett., vol. 109, no. 18, 2012. https://doi.org/10.1103/physrevlett.109.183601.Search in Google Scholar
[43] A. Gonzalez-Tudela, F. P. Laussy, C. Tejedor, M. J. Hartmann, and E. del Valle, “Two-photon spectra of quantum emitters,” New J. Phys., vol. 15, no. 3, p. 033036, 2013. https://doi.org/10.1088/1367-2630/15/3/033036.Search in Google Scholar
[44] M. K. Schmidt, R. Esteban, A. González-Tudela, G. Giedke, and J. Aizpurua, “Quantum mechanical description of Raman scattering from molecules in plasmonic cavities,” ACS Nano, vol. 10, no. 6, pp. 6291–6298, 2016. https://doi.org/10.1021/acsnano.6b02484.Search in Google Scholar PubMed
[45] D. J. Brod, E. F. Galvão, A. Crespi, R. Osellame, N. Spagnolo, and F. Sciarrino, “Photonic implementation of boson sampling: A review,” Adv. Photon., vol. 1, no. 3, p. 034001, 2019.Search in Google Scholar
[46] D. Istrati, et al.., “Sequential generation of linear cluster states from a single photon emitter,” Nat. Commun., vol. 11, no. 1, p. 5501, 2020. https://doi.org/10.1038/s41467-020-19341-4.Search in Google Scholar PubMed PubMed Central
[47] K. Tiurev, et al.., “High-fidelity multiphoton-entangled cluster state with solid-state quantum emitters in photonic nanostructures,” Phys. Rev. A, vol. 105, no. 3, p. L030601, 2022. https://doi.org/10.1103/physreva.105.l030601.Search in Google Scholar
[48] D. Cogan, Z.-E. Su, O. Kenneth, and D. Gershoni, “Deterministic generation of indistinguishable photons in a cluster state,” Nat. Photonics, vol. 17, no. 4, p. 324, 2023. https://doi.org/10.1038/s41566-022-01152-2.Search in Google Scholar PubMed PubMed Central
[49] V. S. Ferreira, G. Kim, A. Butler, H. Pichler, and O. Painter, “Deterministic generation of multidimensional photonic cluster states with a single quantum emitter,” Nat. Phys., vol. 1, 2024.10.1038/s41567-024-02408-0Search in Google Scholar
[50] A. Orlando, et al.., “A comprehensive review on Raman spectroscopy applications,” Chemosensors, vol. 9, no. 9, p. 262, 2021. https://doi.org/10.3390/chemosensors9090262.Search in Google Scholar
[51] A. Kudelski, “Analytical applications of Raman spectroscopy,” Talanta, vol. 76, no. 1, pp. 1–8, 2008. https://doi.org/10.1016/j.talanta.2008.02.042.Search in Google Scholar PubMed
[52] X.-M. Qian and S. M. Nie, “Single-molecule and single-nanoparticle SERS: From fundamental mechanisms to biomedical applications,” Chem. Soc. Rev., vol. 37, no. 5, pp. 912–920, 2008. https://doi.org/10.1039/b708839f.Search in Google Scholar PubMed
[53] D. Yang and Y. Ying, “Applications of Raman spectroscopy in agricultural products and food analysis: A review,” Appl. Spectrosc. Rev., vol. 46, no. 7, pp. 539–560, 2011. https://doi.org/10.1080/05704928.2011.593216.Search in Google Scholar
[54] J. Gambetta and H. M. Wiseman, “State and dynamical parameter estimation for open quantum systems,” Phys. Rev. A - At., Mol., Opt. Phys., vol. 64, no. 4, p. 14, 2001. https://doi.org/10.1103/physreva.64.042105.Search in Google Scholar
[55] C.-J. Yu, S. von Kugelgen, D. W. Laorenza, and D. E. Freedman, “A molecular approach to quantum sensing,” ACS Cent. Sci., vol. 7, no. 5, pp. 712–723, 2021. https://doi.org/10.1021/acscentsci.0c00737.Search in Google Scholar PubMed PubMed Central
[56] J. Duncan, “The determination of vibrational anharmonicity in molecules from spectroscopic observations,” Spectrochim. Acta Part A: Mol. Spectrosc., vol. 47, no. 1, pp. 1–27, 1991. https://doi.org/10.1016/0584-8539(91)80174-h.Search in Google Scholar
[57] P. Roelli, C. Galland, N. Piro, and T. J. Kippenberg, “Molecular cavity optomechanics as a theory of plasmon-enhanced Raman scattering,” Nat. Nanotechnol., vol. 11, no. 2, pp. 164–169, 2016. https://doi.org/10.1038/nnano.2015.264.Search in Google Scholar PubMed
[58] M. K. Schmidt, R. Esteban, F. Benz, J. J. Baumberg, and J. Aizpurua, “Linking classical and molecular optomechanics descriptions of SERS,” Faraday Discuss., vol. 205, pp. 31–65, 2017. https://doi.org/10.1039/c7fd00145b.Search in Google Scholar PubMed
[59] R. Esteban, J. J. Baumberg, and J. Aizpurua, “Molecular optomechanics approach to surface-enhanced Raman scattering,” Acc. Chem. Res., vol. 55, no. 14, pp. 1889–1899, 2022. https://doi.org/10.1021/acs.accounts.1c00759.Search in Google Scholar PubMed PubMed Central
[60] S. Zaske, et al.., “Visible-to-telecom quantum frequency conversion of light from a single quantum emitter,” Phys. Rev. Lett., vol. 109, no. 14, p. 147404, 2012. https://doi.org/10.1103/physrevlett.109.147404.Search in Google Scholar
[61] H. Rütz, K.-H. Luo, H. Suche, and C. Silberhorn, “Quantum frequency conversion between infrared and ultraviolet,” Phys. Rev. Appl., vol. 7, no. 2, p. 024021, 2017. https://doi.org/10.1103/physrevapplied.7.024021.Search in Google Scholar
[62] G. T. ao, et al.., “Mid-infrared single-photon counting,” Opt. Lett., vol. 31, no. 8, pp. 1094–1096, 2006. https://doi.org/10.1364/ol.31.001094.Search in Google Scholar PubMed
[63] J. S. Dam, P. Tidemand-Lichtenberg, and C. Pedersen, “Room-temperature mid-infrared single-photon spectral imaging,” Nat. Photonics, vol. 6, no. 11, pp. 788–793, 2012. https://doi.org/10.1038/nphoton.2012.231.Search in Google Scholar
[64] R. Tang, W. Wu, X. Li, H. Pan, E. Wu, and H. Zeng, “Two-dimensional infrared and mid-infrared imaging by single-photon frequency upconversion,” J. Mod. Opt., vol. 62, no. 14, pp. 1126–1131, 2015. https://doi.org/10.1080/09500340.2015.1021722.Search in Google Scholar
[65] A. Barh, C. Pedersen, and P. Tidemand-Lichtenberg, “Ultra-broadband mid-wave-ir upconversion detection,” Opt. Lett., vol. 42, no. 8, pp. 1504–1507, 2017. https://doi.org/10.1364/ol.42.001504.Search in Google Scholar
[66] A. Barh, P. Tidemand-Lichtenberg, and C. Pedersen, “Thermal noise in mid-infrared broadband upconversion detectors,” Opt. Express, vol. 26, no. 3, pp. 3249–3259, 2018. https://doi.org/10.1364/oe.26.003249.Search in Google Scholar
[67] L. Lehmann, L. Grossard, L. Delage, F. Reynaud, M. Chauvet, and F. Bassignot, “Single photon mir upconversion detector at room temperature with a PPLN ridge waveguide,” Opt. Express, vol. 27, no. 14, pp. 19233–19241, 2019. https://doi.org/10.1364/oe.27.019233.Search in Google Scholar
[68] K. Huang, et al.., “Mid-infrared photon counting and resolving via efficient frequency upconversion,” Photon. Res., vol. 9, no. 2, pp. 259–265, 2021. https://doi.org/10.1364/prj.410302.Search in Google Scholar
[69] K. Huang, J. Fang, M. Yan, E. Wu, and H. Zeng, “Wide-field mid-infrared single-photon upconversion imaging,” Nat. Commun., vol. 13, no. 1, p. 1077, 2022. https://doi.org/10.1038/s41467-022-28716-8.Search in Google Scholar PubMed PubMed Central
[70] Y. Wang, K. Huang, J. Fang, M. Yan, E. Wu, and H. Zeng, “Mid-infrared single-pixel imaging at the single-photon level,” Nat. Commun., vol. 14, no. 1, p. 1073, 2023. https://doi.org/10.1038/s41467-023-36815-3.Search in Google Scholar PubMed PubMed Central
[71] Y. Cai, et al.., “Mid-infrared single-photon upconversion spectroscopy enabled by nonlocal wavelength-to-time mapping,” Sci. Adv., vol. 10, no. 16, p. eadl3503, 2024. https://doi.org/10.1126/sciadv.adl3503.Search in Google Scholar PubMed PubMed Central
[72] Y. Li, Y. He, Y. Wang, W. He, G. Gu, and Q. Chen, “Ultra-sensitive mid-wavelength-infrared upconversion detector,” Opt Laser. Technol., vol. 168, p. 109993, 2024, https://doi.org/10.1016/j.optlastec.2023.109993.Search in Google Scholar
[73] V. Vento, S. Tarrago Velez, A. Pogrebna, and C. Galland, “Measurement-induced collective vibrational quantum coherence under spontaneous Raman scattering in a liquid,” Nat. Commun., vol. 14, no. 1, p. 2818, 2023. https://doi.org/10.1038/s41467-023-38483-9.Search in Google Scholar PubMed PubMed Central
[74] M. K. Schmidt and M. J. Steel, “Molecular optomechanics in the anharmonic regime: From nonclassical mechanical states to mechanical lasing,” New J. Phys., vol. 26, no. 3, p. 033041, 2024. https://doi.org/10.1088/1367-2630/ad32e4.Search in Google Scholar
[75] J. R. Johansson, P. D. Nation, and F. Nori, “QuTiP: An open-source Python framework for the dynamics of open quantum systems,” Comput. Phys. Commun., vol. 183, no. 8, p. 1760, 2012. https://doi.org/10.1016/j.cpc.2012.02.021.Search in Google Scholar
[76] J. R. Johansson, P. D. Nation, and F. Nori, “QuTiP 2: A Python framework for the dynamics of open quantum systems,” Comput. Phys. Commun., vol. 184, no. 4, p. 1234, 2013. https://doi.org/10.1016/j.cpc.2012.11.019.Search in Google Scholar
[77] K. Kneipp, Y. Wang, H. Kneipp, I. Itzkan, R. R. Dasari, and M. S. Feld, “Population pumping of excited vibrational states by spontaneous surface-enhanced Raman scattering,” Phys. Rev. Lett., vol. 76, no. 14, pp. 2444–2447, 1996. https://doi.org/10.1103/physrevlett.76.2444.Search in Google Scholar
[78] R. C. Maher, C. M. Galloway, E. C. L. Ru, L. F. Cohen, and P. G. Etchegoin, “Vibrational pumping in surface enhanced Raman scattering (SERS),” Chem. Soc. Rev., vol. 37, no. 5, pp. 965–979, 2008. https://doi.org/10.1039/b707870f.Search in Google Scholar PubMed
[79] F. Benz, et al.., “Single-molecule optomechanics in “picocavities”,” Science, vol. 354, no. 6313, pp. 726–729, 2016. https://doi.org/10.1126/science.aah5243.Search in Google Scholar PubMed
[80] S. Tarrago Velez, K. Seibold, N. Kipfer, M. D. Anderson, V. Sudhir, and C. Galland, “Preparation and decay of a single quantum of vibration at ambient conditions,” Phys. Rev. X, vol. 9, no. 4, p. 041007, 2019. https://doi.org/10.1103/physrevx.9.041007.Search in Google Scholar
[81] I. Morichika, K. Murata, A. Sakurai, K. Ishii, and S. Ashihara, “Molecular ground-state dissociation in the condensed phase employing plasmonic field enhancement of chirped mid-infrared pulses,” Nat. Commun., vol. 10, no. 1, p. 3893, 2019. https://doi.org/10.1038/s41467-019-11902-6.Search in Google Scholar PubMed PubMed Central
[82] K. Zhang and X.-J. Chen, “Identification of the incommensurate structure transition in biphenyl by Raman scattering,” Spectrochim. Acta Mol. Biomol. Spectrosc., vol. 206, pp. 202–206, 2019. https://doi.org/10.1016/j.saa.2018.07.104.Search in Google Scholar PubMed
[83] K. T. Crampton, et al.., “Ultrafast coherent Raman scattering at plasmonic nanojunctions,” J. Phys. Chem. C, vol. 120, no. 37, pp. 20943–20953, 2016. https://doi.org/10.1021/acs.jpcc.6b02760.Search in Google Scholar
[84] K. Kneipp, et al.., “Single molecule detection using surface-enhanced Raman scattering (SERS),” Phys. Rev. Lett., vol. 78, no. 9, p. 1667, 1997. https://doi.org/10.1103/physrevlett.78.1667.Search in Google Scholar
[85] C. Gross, “Spin squeezing, entanglement and quantum metrology with Bose–Einstein condensates,” J. Phys. B: At., Mol. Opt. Phys., vol. 45, no. 10, p. 103001, 2012. https://doi.org/10.1088/0953-4075/45/10/103001.Search in Google Scholar
[86] H.-H. Shin, et al.., “Vibrationally hot reactants in a plasmon-assisted chemical reaction,” J. Am. Chem. Soc., vol. 145, no. 22, p. 12264, 2023. https://doi.org/10.1021/jacs.3c02681.Search in Google Scholar PubMed
[87] Y. Qiu, C. Kuang, X. Liu, and L. Tang, “Single-molecule surface-enhanced Raman spectroscopy,” Sensors, vol. 22, no. 13, 2022. https://doi.org/10.3390/s22134889.Search in Google Scholar PubMed PubMed Central
[88] A. Xomalis, et al.., “Detecting mid-infrared light by molecular frequency upconversion in dual-wavelength nanoantennas,” Science, vol. 374, no. 6572, pp. 1268–1271, 2021. https://doi.org/10.1126/science.abk2593.Search in Google Scholar PubMed
[89] F. Huth, A. Govyadinov, S. Amarie, W. Nuansing, F. Keilmann, and R. Hillenbrand, “Nano-FTIR absorption spectroscopy of molecular fingerprints at 20 nm spatial resolution,” Nano Lett., vol. 12, no. 8, pp. 3973–3078, 2012. https://doi.org/10.1021/nl301159v.Search in Google Scholar PubMed
[90] I. V. Pechenezhskiy, et al.., “Infrared spectroscopy of molecular submonolayers on surfaces by infrared scanning tunneling microscopy: Tetramantane on au(111),” Phys. Rev. Lett., vol. 111, p. 126101, 2013, https://doi.org/10.1103/physrevlett.111.126101.Search in Google Scholar PubMed
[91] M. Himmelhaus, F. Eisert, M. Buck, and M. Grunze, “Self-assembly of n-alkanethiol monolayers. A study by IR-visible sum frequency spectroscopy (SFG),” J. Phys. Chem. B, vol. 104, no. 3, pp. 576–584, 2000. https://doi.org/10.1021/jp992073e.Search in Google Scholar
[92] L. A. Jakob, W. M. Deacon, R. Arul, B. de Nijs, N. S. Mueller, and J. J. Baumberg, “Accelerated molecular vibrational decay and suppressed electronic nonlinearities in plasmonic cavities through coherent Raman scattering,” Phys. Rev. B, vol. 109, no. 19, p. 195404, 2024. https://doi.org/10.1103/physrevb.109.195404.Search in Google Scholar
[93] C. Galland, N. Sangouard, N. Piro, N. Gisin, and T. J. Kippenberg, “Heralded single-phonon preparation, storage, and readout in cavity optomechanics,” Phys. Rev. Lett., vol. 112, p. 143602, 2014, https://doi.org/10.1103/physrevlett.112.143602.Search in Google Scholar
[94] M. C. Teich, “Quantum-mechanical lossless beam splitter: Su(2) symmetry and photon statistics,” Phys. Rev. A, vol. 40, pp. 1371–1384, 1989. https://doi.org/10.1103/physreva.40.1371.Search in Google Scholar PubMed
[95] P. Sekatski, N. Sangouard, F. Bussieres, C. Clausen, N. Gisin, and H. Zbinden, “Detector imperfections in photon-pair source characterization,” J. Phys. B: At., Mol. Opt. Phys., vol. 45, no. 12, p. 124016, 2012. https://doi.org/10.1088/0953-4075/45/12/124016.Search in Google Scholar
[96] J. C. L. Carreño, E. Z. Casalengua, B. Silva, E. del Valle, and F. P. Laussy, “Loss of antibunching,” Phys. Rev. A, vol. 105, p. 023724, 2022, https://doi.org/10.1103/physreva.105.023724.Search in Google Scholar
[97] S. Yampolsky, et al.., “Seeing a single molecule vibrate through time-resolved coherent anti-Stokes Raman scattering,” Nat. Photonics, vol. 8, no. 8, pp. 650–656, 2014. https://doi.org/10.1038/nphoton.2014.143.Search in Google Scholar
[98] P. Roelli, H. Hu, E. Verhagen, S. Reich, and C. Galland, “Nanocavities for molecular optomechanics: Their fundamental description and applications,” ACS Photonics, ASAP, vol. 11, no. 11, pp. 4486–4501, 2024. https://doi.org/10.1021/acsphotonics.4c01548.Search in Google Scholar PubMed PubMed Central
[99] X. Han, W. Fu, C.-L. Zou, L. Jiang, and H. X. Tang, “Microwave-optical quantum frequency conversion,” Optica, vol. 8, no. 8, pp. 1050–1064, 2021. https://doi.org/10.1364/optica.425414.Search in Google Scholar
[100] L. A. Jakob, et al.., “Giant optomechanical spring effect in plasmonic nano-and picocavities probed by surface-enhanced Raman scattering,” Nat. Commun., vol. 14, no. 1, p. 3291, 2023. https://doi.org/10.1038/s41467-023-38124-1.Search in Google Scholar PubMed PubMed Central
[101] R. Chikkaraddy, R. Arul, L. A. Jakob, and J. J. Baumberg, “Single-molecule mid-infrared spectroscopy and detection through vibrationally assisted luminescence,” Nat. Photonics, vol. 17, no. 10, pp. 865–871, 2023. https://doi.org/10.1038/s41566-023-01263-4.Search in Google Scholar
[102] P. Roelli, I. Pascual, I. Niehues, J. Aizpurua, and R. Hillenbrand, “On-demand mid-IR to visible upconversion with a near-field microscope,” in Enhanced Spectroscopies and Nanoimaging 2023, San Diego, California, USA, SPIE, 2023, p. PC126540Z.10.1117/12.2676823Search in Google Scholar
[103] M. S. Anderson, “Concurrent surface enhanced infrared and Raman spectroscopy with single molecule sensitivity,” Rev. Sci. Instrum., vol. 94, no. 2, 2023. https://doi.org/10.1063/5.0136908.Search in Google Scholar PubMed
[104] Z. Zhao, et al.., “Ultra-bright Raman dots for multiplexed optical imaging,” Nat. Commun., vol. 12, no. 1, pp. 1305, 2021. https://doi.org/10.1038/s41467-021-21570-0.Search in Google Scholar PubMed PubMed Central
[105] N. Qian and W. Min, “Super-multiplexed vibrational probes: Being colorful makes a difference,” Curr. Opin. Chem. Biol., vol. 67, p. 102115, 2022, https://doi.org/10.1016/j.cbpa.2021.102115.Search in Google Scholar PubMed PubMed Central
[106] Z. Koczor-Benda, P. Roelli, C. Galland, and E. Rosta, “Molecular vibration explorer: An online database and toolbox for surface-enhanced frequency conversion and infrared and Raman spectroscopy,” J. Phys. Chem. A, vol. 126, no. 28, pp. 4657–4663, 2022. https://doi.org/10.1021/acs.jpca.2c03700.Search in Google Scholar PubMed PubMed Central
[107] C. Humbert, O. Pluchery, E. Lacaze, A. Tadjeddine, and B. Busson, “A multiscale description of molecular adsorption on gold nanoparticles by nonlinear optical spectroscopy,” Phys. Chem. Chem. Phys., vol. 14, no. 1, pp. 280–289, 2012. https://doi.org/10.1039/c1cp21091b.Search in Google Scholar PubMed
[108] M. J. Frisch, et al.., Gaussiañ16 Revision C.01, Wallingford CT, Gaussian Inc, 2016.Search in Google Scholar
[109] V. Barone, M. Biczysko, and J. Bloino, “Fully anharmonic ir and Raman spectra of medium-size molecular systems: Accuracy and interpretation,” Phys. Chem. Chem. Phys., vol. 16, no. 5, pp. 1759–1787, 2014. https://doi.org/10.1039/c3cp53413h.Search in Google Scholar PubMed PubMed Central
[110] M. Fusè, et al.., “Anharmonic aspects in vibrational circular dichroism spectra from 900 to 9000 cm–1 for methyloxirane and methylthiirane,” J. Phys. Chem. A, vol. 126, no. 38, pp. 6719–6733, 2022. https://doi.org/10.1021/acs.jpca.2c05332.Search in Google Scholar PubMed PubMed Central
© 2024 the author(s), published by De Gruyter, Berlin/Boston
This work is licensed under the Creative Commons Attribution 4.0 International License.
Articles in the same Issue
- Frontmatter
- Research Articles
- Advancements in surface-enhanced femtosecond stimulated Raman spectroscopy: exploring factors influencing detectability and shapes of spectra
- Measuring high-efficiency perfect composite vortex beams with reflective metasurfaces in microwave band
- Modulation of surface phonon polaritons in MoO3 via dynamic doping of SiC substrate
- Auto-collimation diffraction of two-dimensional metal–dielectric grating with azimuth angle of 45°
- Topological bound states in the continuum in a non-Hermitian photonic system
- Metacavities by harnessing the linear-crossing metamaterials
- Photon antibunching in single-molecule vibrational sum-frequency generation
- Coupled acoustoplasmonic resonators: the role of geometrical symmetries
- Quantum and thermal noise in coupled non-Hermitian waveguide systems with different models of gain and loss
- Origins and conservation of topological polarization defects in resonant photonic-crystal diffraction
- Gesture-controlled reconfigurable metasurface system based on surface electromyography for real-time electromagnetic wave manipulation