Photoacoustic-guided photothermal therapy by mapping of tumor microvasculature and nanoparticle
-
Zhiyang Wang
 ,
Fei Yang
,
Fei Yang


Abstract
Although photothermal therapy (PTT) has demonstrated its clinical value and adaptability, it still requires imaging guidance to motivate the development of precise and effective treatment. For PTT, high-resolution visualization of tumor microvasculature and accurate location of nanoparticles distribution are crucial for the therapeutic outcome. Here, a wavelength-switchable photoacoustic microscopy (PAM) was developed to noninvasively investigate the tumor microvasculature and the accumulation of nanoparticles for accurately guiding PTT and evaluating the therapeutic effect. In a tumor model, PAM was used to continuously monitor the tumor microenvironment in vivo, and the proportion of microvessels in tumor site was found increased by 10%, and the diameters of the draining veins were doubled on day 7. In addition, quantitative parameters such as tumor volume and vascular density can also be demonstrated by the PAM. Meanwhile, the concentration of Den-RGD/Cy7 at the tumor site reached its maximum at 8 h by PA mapping after intravenous injection, which was used to determine the optimal irradiation timing. After treatment, photoacoustic monitoring showed that PTT can precisely kill the tumors and minimize damage to surrounding normal tissues, which was consistent with the pathological slides. The experimental results proved that PAM can provide an auxiliary means for precision PTT.
1 Introduction
Cancer remains as a terrible disease with high morbidity and mortality worldwide [1]. Nowadays, immunotherapy [2], [3], [4], photodynamic therapy (PDT) [5], [6], [7] and photothermal therapy (PTT) [8], [9], [10], [11], [12], [13] have been proposed as precise and effective treatments for cancer. As an emerging therapy, PTT has made tremendous progress in improving the therapeutic outcomes, in which the photothermal agents utilize photoenergy to produce localized heat to induce the death of cancer cells. Different from conventional therapies, PTT has the following advantages: The laser wavelength and radiation dosage used can be flexibly switched to precisely kill the tumors and minimize damage to surrounding normal tissues; PTT is highly effective and noninvasive therapy that is capable of eliminating various types of cancers by using different biocompatible photothermal agents [14]. Although PTT has demonstrated its clinical value in fighting cancer, any treatment method needs the assistance of imaging technology to enhance treatment efficacy in clinical translation [15], [16], [17], [18]. Photoacoustic imaging (PAI) is a hybrid biomedical imaging technology that combines high-contrast optical imaging and deep-penetration acoustic imaging [13, 19–31]. Moreover, PAI and PTT are easily combined in biomedicine because the nanoplatforms used for PTT have the same physical properties as photoacoustic contrast agents, so the most nanoplatforms used for PTT can be used to enhance PAI at the same time. Recent years, PAI has gradually played a key role in improving cancer diagnosis and treatment, especially in precise pinpointing of tumors and monitoring of tumor response to therapy [18, 32–35]. As an important branch of PAI, photoacoustic microscopy (PAM) has great application prospects in PTT by observing the tumor microenvironment and the distribution of nanoplatforms with high resolution. However, due to the limitation of excitation laser and spatial resolution, currently there is no PAM system suitable for PTT, which can both reveal the tumor microvasculature and flexibly visualize the distribution of different nanoplatforms within the tumor. Therefore, there is an urgent need for a specific PAM system to precisely guide PTT and evaluate the therapeutic outcomes, especially in future clinical practice.
In this paper, we explored a wavelength-switchable PAM system, as a noninvasive and high-resolution imaging tool, to characterize the entire tumor vasculature and nanoparticles accumulation in tumor models for guiding PTT and evaluating its efficacy. Particularly, we aimed to investigate the ability of PAM to reveal the changes of tumor microenvironment, tumor volumes and the feeding arteries and draining veins around the tumor. Furthermore, the accumulation and distribution of Den-RGD/Cy7 nanoparticles via intravenous injection in 4T1 tumor model was monitored, the nanoparticles concentration at the tumor site reached its maximum at 8 h, which was used to determine the optimal irradiation timing. The comprehensive information of microvascular structures and nanoparticles can be used to guide the implementation of PTT. What’s more, the tumor volume and vascular morphology after treatment can be monitored and quantitatively analyzed to evaluate the therapeutic outcomes of PTT. The results proved that the proposed PAM can be a powerful tool for PTT.
2 Materials and methods
2.1 In vivo PA imaging system
Figure 1(A) shows the schematic diagram of wavelength-switchable PAM system (AOPM, Guangdong Photoacoustic Medical Technology Co.,Ltd). The pulsed laser (DTL-314QT, Laser-export), operating at wavelength of 532 nm with ∼7 ns duration, is used as excitation source for imaging microvasculature. First, the 532 nm laser beam passes through a spatial filter system (KT310/M, Thorlabs) to produce a Gaussian beam. Then, the 532 nm laser beam is focused by a 4× objective lens (NA = 0.1, Daheng Optics) to illuminate biological tissues. In addition, an optical parametric oscillator (OPO) laser (NT200, EKSPLA) outputs 650–2500 nm laser to visualize the distribution of nanoparticles. In this experiment, 750 nm laser is used to image the synthetic Den-RGD/Cy7 nanoparticles (Peak absorbance at 750 nm). Two wavelengths (532 and 750 nm) light are converged by a dichroic mirror and focused by the same 4× objective lens. A focused ringed ultrasonic transducer (8 mm O.D., 3 mm I.D., central frequency: 35 MHz) with focal length of 8 mm and −6 dB bandwidth of 120% is used to receive the PA signals. The piezoelectric element achieves self-focusing through a spherical structure. A 3D-printed tank filled with deionized water is used to couple the PA signals. The deionized water is in contact with the biological tissue through a transparent membrane. Finally, the PA signals generated by different lasers are used to reconstruct the microvasculature and nanoparticles in the same area. For imaging the tumor microvasculature, the step size of the X axis is 4 μm, and the step size of the Y axis is 10 μm. The laser pulse repetition rate is 10 kHz. For imaging the nanoparticles, the step size of the X axis is 16 μm, and the step size of the Y axis is 10 μm. The laser pulse repetition rate is 2.5 kHz. This scanning system takes about 10 min to image an area of 20 × 20 mm. By imaging nanoparticles, the distribution and concentration of nanoparticles can be obtained. The tumor volume can also be obtained by the distribution of nanoparticles in the tumor. The 532 nm laser can assess the condition in the tumor regions by visualizing the tumor microenvironment and the feeding vessels and draining vessels around the tumor with high resolution. In vivo PA imaging was used to assess tumor status and to determine the treatment timing and laser therapy dosage to optimize therapeutic efficacy (Figure 1(B)). After treatment, the microvascular changes can be investigated to evaluate the treatment effect of the tumor. Figure 1(C)–(F) show the morphology and distribution of microvasculature and nanoparticles (In situ injection, 0.5 mg/ml, 5 μl) in the mouse brain in different cross-sections and three-dimensional structures. The imaging results demonstrate that the proposed PAM has immense promise for imaging orthotopic tumors in multiple organs, especially in preclinical research. Furthermore, a sharp-edged surgical blade was imaged to characterize the resolution of the PAM system. The edge-spread function was calculated by taking the distribution of normalized PA signals amplitude along the blue dotted line in the inserted PA images. Taking the derivative yielded the line-spread function (LSF), Hence, the lateral resolution of the system as defined by the full-width at half-maximum (FWHM) of the LSF. Figure 2(A) indicates that the lateral resolution of 532 nm laser is 7.5 μm, and Figure 2(B) shows that the lateral resolution of 750 nm laser is 35 μm. Independent of the excitation laser, the axial resolution mainly depends on the center frequency and bandwidth of the transducer, the axial resolution of the developed dual-wavelength PAM system is about 42 μm, as shown in Figure 2(C).

(A) The schematic diagram of the photoacoustic microscopy system. (B) Guiding diagram of photoacoustic imaging in photothermal therapy. (C–E) The merged photoacoustic images of microvasculature and nanoparticles distribution in a complete mouse skull state. (F) 3D photoacoustic images.
NDF, neutral density filter; L1, L2, lens; PH, pinhole; DM, dichroic mirror; OL, objective lens; UT, ultrasonic transducer.

The imaging parameters of the PA system and the characterizations of the nanoparticles.
(A) The lateral resolution of the 532 nm laser imaging system. (B) The lateral resolution of the 750 nm laser imaging system. (C) The axial resolution of the 532 and 750 nm laser imaging system. (D) UV–vis spectra of Cy7 and Den-RGD/Cy7, respectively. (E) DLS data of the nanoparticles dispersions. (F) Photothermal effect of 0 mg/mL, 0.025 mg/mL, 0.1 mg/mL Den-RGD/Cy7 nanoparticles under irradiation with a 750 nm laser (1 W/cm2).
2.2 Synthesis and characterization of the nanoparticle
Based on our previous work [17], we designed and constructed Den-RGD/Cy7 nanoparticles with near-infrared absorption peaks. The fifth generation polyamidoamine dendrimer was chosen as a scaffold for cyclic [RGDyK] peptides that target tumor vasculature and 4T1 breast cancer cell. First, the Cyclic [RGDyK] peptides were modified on both carboxylation and maleimide functionalized poly (ethylene glycol) (PEG, MW: 2000 Da) linkers (Mal-PEG2K-COOH). Next, the postmodified PEG linkers, Mal-PEG2K-RGD, were modified on the dendrimer with a designed react ratio via Michael reaction. Finally, N-hydroxysuccinimidyl-functionalized Cy7 (Cy7-N-hydroxysuccinimidy (NHS)) was modified on the nanoparticle to produce a high red photoabsorbing nanoparticle for PTT and PAI.
The optical characteristics of Cy7 and Den-RGD/Cy7 were investigated (Figure 2(D)) by UV–vis absorption spectra (Lambda-35 UV–vis spectrophotometer, PerkinElmer). The sizes of Den-RGD/Cy7 nanoparticles measured by dynamic light scattering (DLS) were about 50 nm (Figure 2(E)). Photothermal temperature was recorded by an IR thermal camera (E50, IRS Systems), and Figure 2(F) shows that the synthesized nanoparticles have good photothermal performance.
2.3 Image reconstruction and analysis
The raw PA data was processed and reconstructed in MATLAB (R2019a, MathWorks, USA) and ImageJ (Fiji). The 3D Photoacoustic Visualization Studio also was used to reconstruct the depth-coded images [36]. The vascular density was defined as the ratio of all vascular pixels to the total pixels of the selected total area to reflect the amount of vascular distribution in the given region. To calculate the distribution of the vessel diameter, firstly, the photoacoustic image was binarized, and then the skeleton and boundaries of the image were extracted respectively. Further, the vertical line of the vessel skeleton was drawn. The distance between the two intersection points of the vertical line and the vessel boundaries was defined as the vessel diameter. Finally, a statistical graph was made to obtain a statistical histogram of vessel diameter. The tumor sizes were measured by PA images and calculated as volume = (tumor length) × (tumor width)2/2 [37]. The vascular tortuosity was calculated as L/L′, where L was the vessel path’s length, and L′ was the linear distance between the two ends of vessel. The tumor boundaries are distinguished by the difference in the intensity of PA signals between the tumor site and normal tissues.
2.4 Animal model
All animals were manipulated in accordance to the rules issued by the Institutional Animal Care and Use Committee of South China Normal University, Guangzhou, China. 4T1 breast cancer cells were subcutaneously seeded into the ear and the back of five-week-old BALB/c mice (Guangdong medical laboratory animal center, China). The ear of mice was monitored to reveal the tumor growth. When the area of tumor reached ∼100 mm2, the treatment experiments were performed.
3 Results and discussion
The tumor microenvironment was investigated in vivo to demonstrate the ability of the PAM system to map the tumor microvasculature. Mouse of five weeks old were used in this experiment. The mouse was anesthetized by inhaling 1.5% isoflurane. Before 4T1 breast cancer cells subcutaneous injection (day 0), the mouse ear (Figure 3(A)) was first imaged with PAM system. Maximum amplitude projection (MAP) image (Figure 3(B)) and depth-encoded image (Figure 3(C)) can clearly reveal the arteries (A1, A2), veins (V1, V2) and microvasculature. After the control imaging, 4T1 breast cancer cells were injected into the imaging region of the mouse ear. A small tumor bulge was found at the injection site on day 4 (Figure 3(D)). PA images (Figure 3(E) and (F)) show more tumor angiogenesis at the tumor site, and the blood vessels around the tumor become more tortuous. The volume of the tumor became larger on day 7 (Figure 3(G)), and the blood vessels around the tumor also had a significant deformity. PA images (Figure 3(H) and (I)) show that the microvascular structure within the tumor was denser, and the diameter of the arteries and veins at the edge of the tumor also became larger. To further quantify the growth process of the tumor, the distributions of blood vessel diameter was counted on day 0, day 4, day 7 (Figure 3(J)). We found that tumor growth was accompanied by an abnormal increase in the number of microvessels. Then, the density of the blood vessels and the volume of the tumor were calculated separately (Figure 3(K)). The vessel density on day 7 was more than twice that on day 0. The tumor volume reached approximately 40 mm2 on day 7. Finally, the diameters of two feeding arteries (A1, A2) and two draining veins (V1, V2) are counted (Figure 3(L)). From the results, we found that the diameters of the draining veins doubled on day 4, and then vein 2 also had obvious increase on day 7, while the feeding arteries only have a slight increase in diameter. The reason should be that the tumor enlarged and squeezed the blood vessels, and the reflux resistance of the draining veins became greater. As a result, the intravascular pressure increased. Because the venous walls are thinner and less flexible than the arterial walls, they tend to dilate and become larger in diameter easily. This experiment demonstrated that PAM can visualize and accurately evaluate the tumor microvasculature and the feeding arteries and draining veins around the tumor.

In vivo monitoring of the tumor growth by photoacoustic microscopy.
(A) Mouse ear before injecting 4T1 tumor cells (day 0). (B) The maximum amplitude projection microvasculature image of the mouse ear on day 0. The white dotted box is the region of interest. (C) The depth-coded microvasculature image of the mouse ear on day 0. (D) The mouse ear on day 4. (E) The maximum amplitude projection microvasculature image of the mouse ear on day 4. (F) The depth-coded microvasculature image of the mouse ear on day 4. (G) The mouse ear on day 7. (H) The maximum amplitude projection microvasculature image of the mouse ear on day 7. (I) The depth-coded microvasculature image of the mouse ear on day 7. (J) The distribution of vascular diameter on day 0, day 4, day 7. (J) The distribution of vascular diameter on day 0, day 4, day 7. (K) The vessel density and tumor volume on day 0, day 4, day 7. (L) The diameters of the arteries and veins on day 0, day 4, day 7.
To demonstrate the PAM can reveal the subtle microvascular responses to PTT. Mice inoculated with 4T1 breast cancer cells were divided into three groups for different treatments. The control group only injected the Den-RGD/Cy7 nanoparticles (0.5 mg/ml, 0.1 ml) in situ. In the under-treated group, the Den-RGD/Cy7 nanoparticles (0.5 mg/ml, 0.05 ml) were injected in situ and then illuminated with CW 750 nm laser for 10 min (1 W/cm2). In the over treated group, the Den-RGD/Cy7 nanoparticles (0.5 mg/ml, 0.1 ml) were injected in situ and then illuminated with CW 750 nm laser for 10 min (1 W/cm2). After treatment, imaging of the tumor regions was performed at 6 h, 24 h, 48 h, and 72 h to evaluate the effect of PTT by monitoring structural changes in tumor vasculature and the surrounding tissue. Figure 4(A) shows the morphologic growth of the tumor in the control group. Figure 4(B) presents that the central region of the tumor in the undertreated group was damaged at 6 and 24 h, but the marginal region of the tumor was still abnormally expanded after 48 h. In the overtreatment group (Figure 4(C)), scabs appeared at the tumor site, and the vessels around the tumor were also damaged. When the scab fell off at 72 h, it was found that the entire tumor regions and surrounding tissues were damaged. To furtherly quantify the tumor microvascular in PTT, PA images were analyzed. The tumor volumes were analyzed in Figure 4(D). The tumor volume in the control group showed an upward trend. However, in the undertreatment group, the tumor volume first decreased briefly, and then began to increase. Finally, in the overtreatment group, the tumor became smaller, eventually scabs formed, and the tumor was eliminated completely. In Figure 4(E)–(G), the diameters of the feeding vessels and draining vessels marked by white arrows (Figure 4(E)), the amplitude of PA signals (Figure 4(F)) in tumor region and vascular tortuosity (Figure 4(G)) in white dotted rectangle also show the same changes as the tumor volume changes (Figure 4(D)). In Figure 4(E), the diameter of blood vessel (C1) increased at 72 h was caused by the exfoliation of scabs damaged the skin tissue, which led to more blood supply to the injured regions. Overall, these results demonstrate that photoacoustic microscopy provides a useful means to quantitatively depict tumor microenvironment and vascular morphology in PTT, which has immense promise to guide and improve therapeutic efficacy.

Monitoring of tumors undergoing different in situ photothermal treatments.
(A) PA imaging results in the control group. (B) PA imaging results in the undertreatment group. (C) PA imaging results in the overtreatment group. (D) Tumor volumes in different experimental groups at different timing. (E) The diameter changes of the draining vessels in different treatment groups. (F) The amplitude of PA signals in tumor area. (G) Vascular tortuosity in white dotted rectangle. *: Due to the scab formation and exfoliation.
To verify the ability of PAM to characterize nanoparticle aggregation, a breast cancer model was imaged after injecting Den-RGD/Cy7 nanoparticles through the tail vein. Figure 5(A) shows the photograph of the tumor model, and then we imaging the tumor site using 532 nm laser to visualize the microvascular system of the tumor and surrounding tissues (Figure 5(B)). The imaging results showed that the tumor site was accompanied by an abnormal increase in blood vessels. Further, the distribution of nanoparticles and the resultant changes of PA signals inside tumor were continuously monitored (Figure 5(C)–(H)). Before Den-RGD/Cy7 injection through the tail vein, no obvious background PA signal was detected, owing to the low absorption of living tissues near 750 nm. After intravenous injection of Den-RGD/Cy7 at a concentration (0.5 mg/ml, 0.15 ml) into mouse, moderate PA signals were detected at the tumor site, which gradually increased over time and reached its maximum at 8 h postinjection (Figure 5(J)), suggesting the accumulation of Den-RGD/Cy7 nanoparticles in the tumor. Therefore, laser irradiation of tumor model was conducted at 8 h postinjection of nanoparticles. In order to study the relationship between the PA signals amplitude and the concentration of nanoparticles, the in vitro imaging was performed on samples with different concentrations. A good linearity was observed between the intensity of PA signal and the dose of Den-RGD/Cy7 nanoparticles, which indicates that Den-RGD/Cy7 has good potential for in vivo PAI and PTT.

In vivo monitoring of tumors undergoing different photothermal treatments.
(A) The photograph of 4T1 tumor model. (B) Microvascular morphology of the tumor region was imaged with 532 nm laser. (C)–(H) In vivo non-invasive 750 nm laser PA imaging results of mice in 4T1 tumor model at different time points after Den-RGD/Cy7 nanoparticle via tail vein injection. (I) The imaging results and the PA signals statistics of nanoparticles at different concentrations under 750 nm laser. (J) PA signals amplitude of nanoparticle in the tumor center.
Finally, the tumor microvasculature was monitored to evaluate the active targeted therapy efficacy. The Den-RGD/Cy7 nanoparticles were injected through the tail vein. At 8 h postinjection, the tumor site was treated with CW 750 nm laser for 10 min (1 W/cm2). PA imaging was performed at the tumor site before and at 6, 24, 48, and 72 h after nanoparticles injection. As can be seen from the PA images (Figure 6(A)–(G)), the tumor volume gradually decreases after PTT kills the tumor cells. It is worth noting that edema around the tumor site appeared 24 h after laser irradiation due to tissue reflection. At 72 h (Figure 6(E)), the edema around the tumor completely disappeared, blood vessels were clearly shown in the normal tissues around the tumor, and the tumor site was seriously damaged. The imaging results illustrate that PTT is a very promising way to fight cancer with minimal invasiveness and high effectiveness. The results show that the PTT has achieved better treatment efficacy. Figure 6(F)–(G) are the cross-sectional maximum amplitude projection images in tumor site at 72 h. It can be seen from the images that there is no obvious vascular morphology inside the damaged tumor after PTT, and the normal tissues around the tumor have not been damaged. Figure 6(H) depicts that the tumor volume continues to decrease after PTT, and the tumor volume measured is about 55 mm3 at 72 h. The amplitude of PA signals in the center of the tumor was stronger at 6 h than before the intravenous injection, because of the enhancement of the PA signals caused by the large accumulation of Den-RGD/Cy7 nanoparticles in the tumor. The PA signals amplitude in the tumor site decreased with tumor damage and longer circulation time. Furthermore, the hematoxylin and eosin (H&E) staining analyses were conducted on R1 and R2 marked in Figure 6(E). The normal tissue (R1) around the tumor did not show obvious cell necrosis (Figure 6(I)). The tumor site (R2) exhibited severe tumor tissue damage with high percentage of cell necrosis (Figure 6(J)). The results of H&E staining were consistent with those of PA images, indicating PAM has ability to evaluate the therapeutic effects of PTT noninvasively.
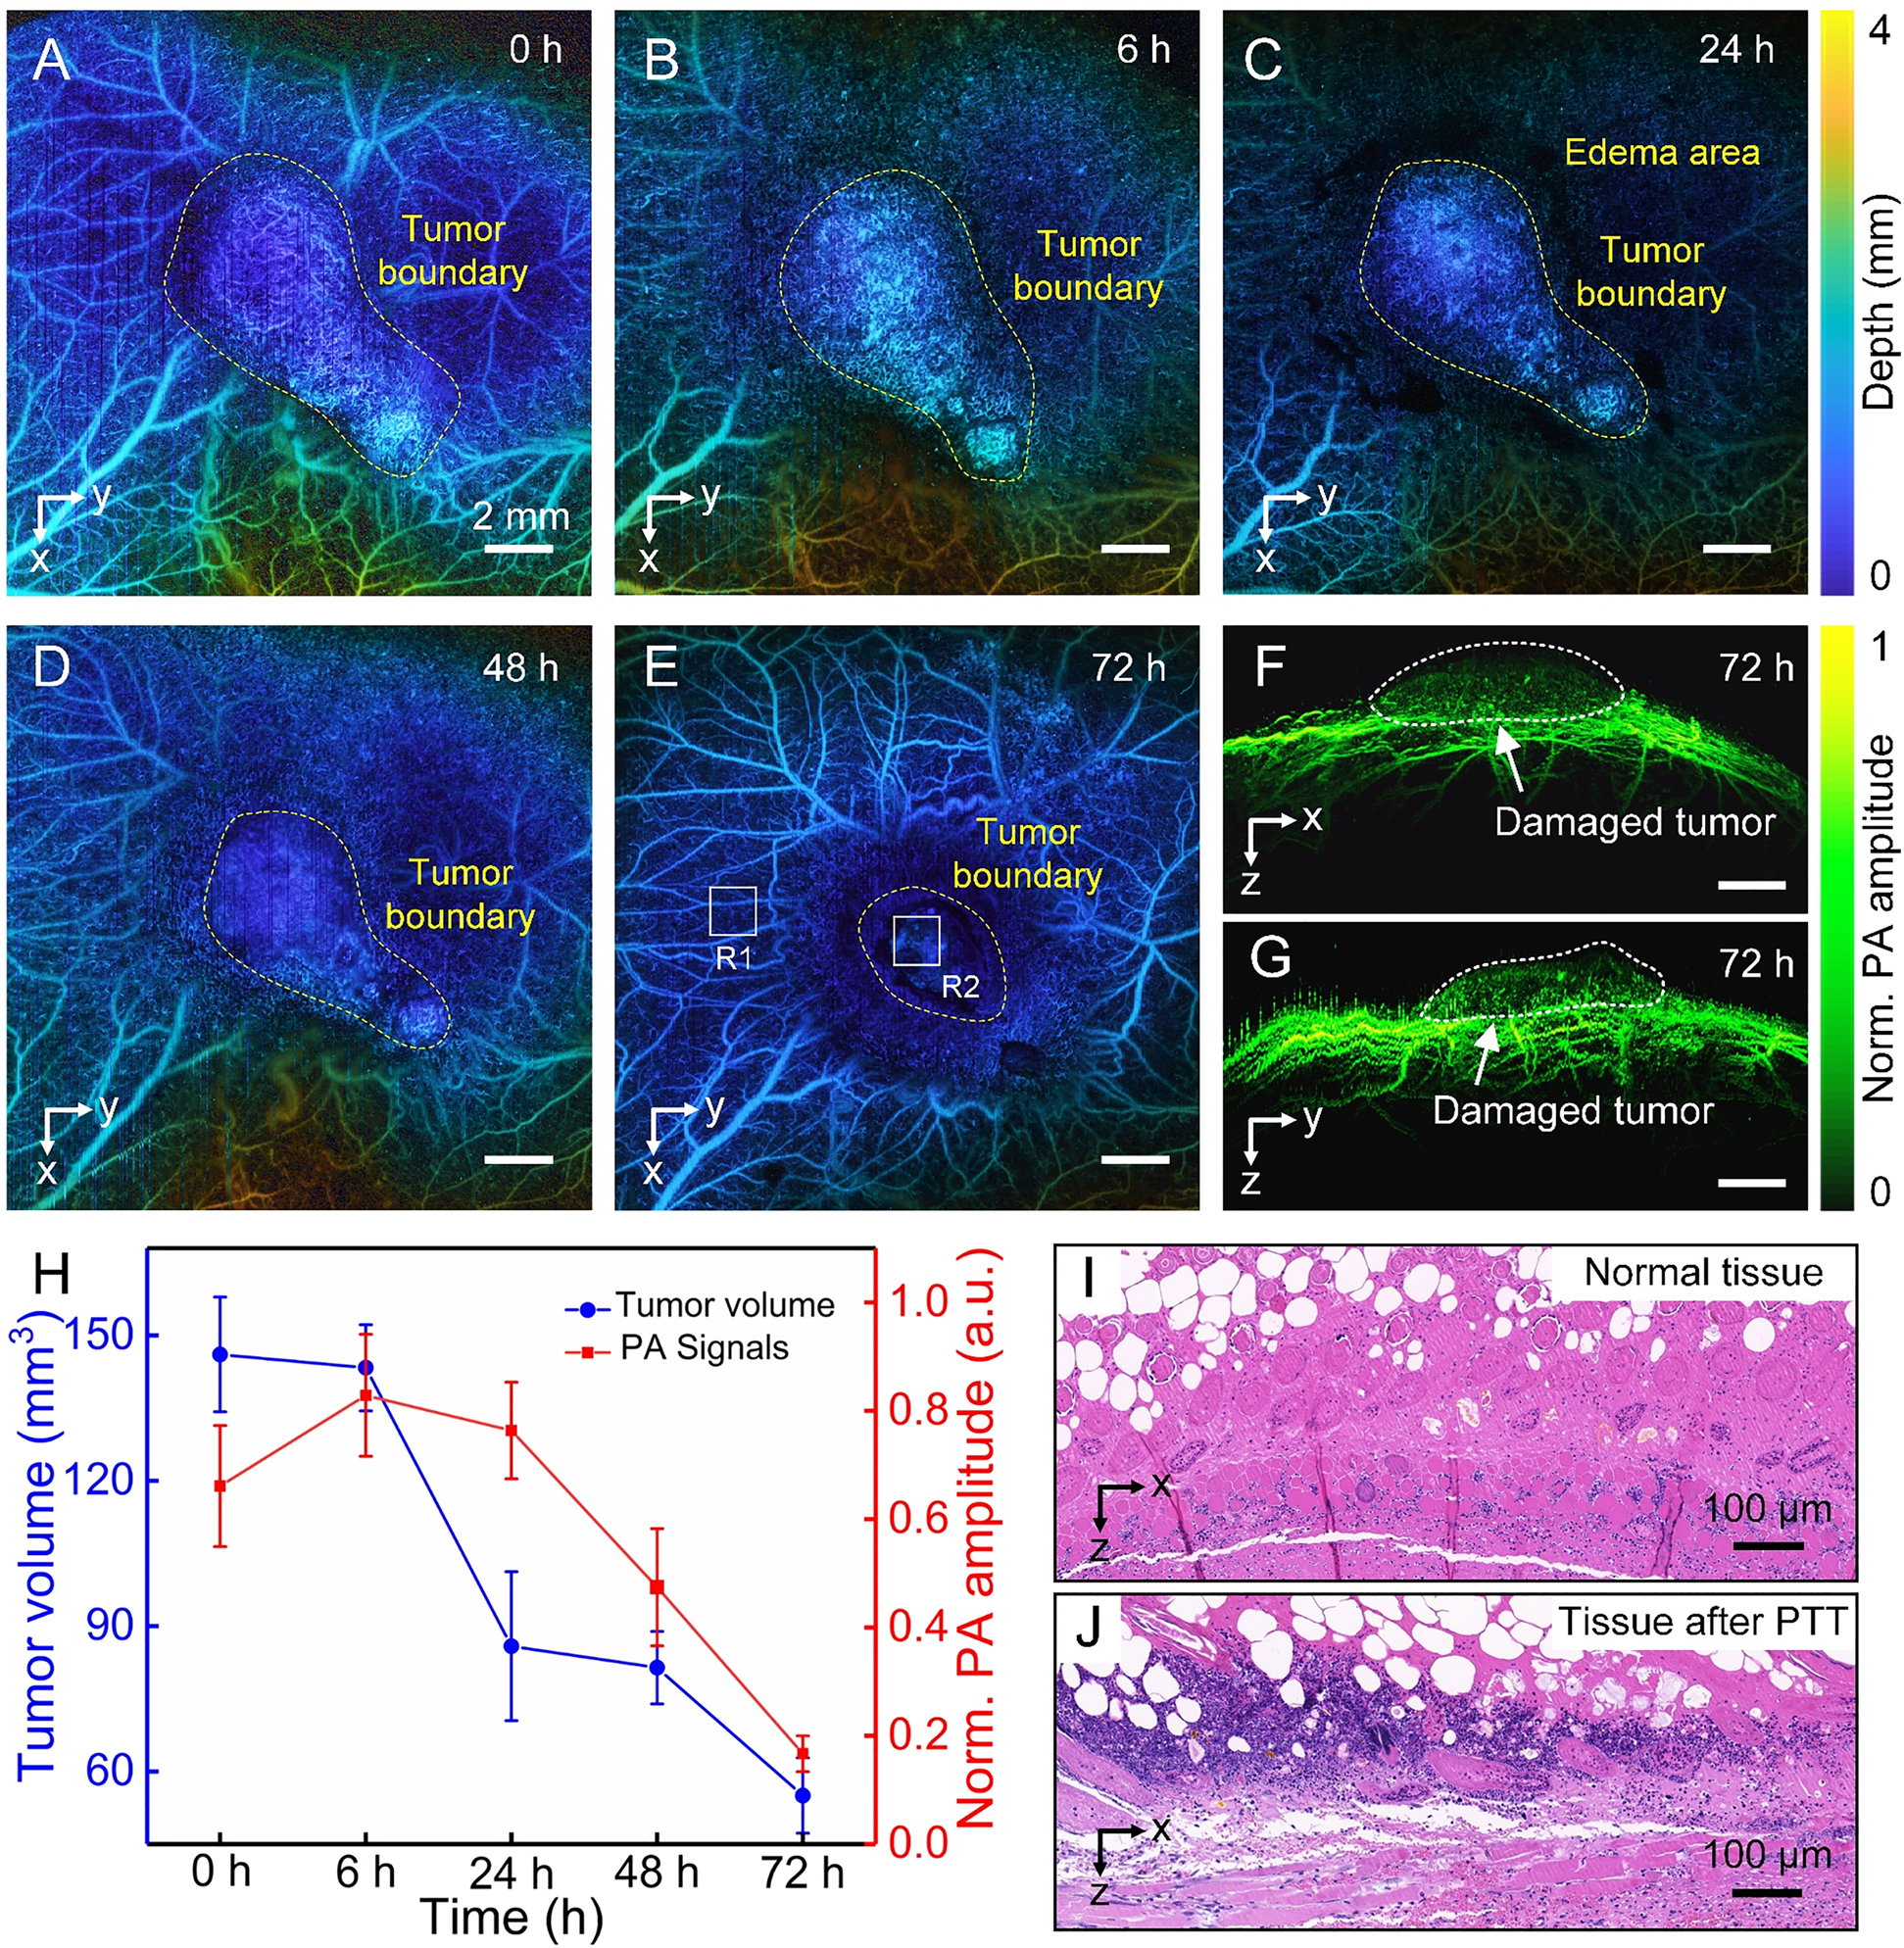
In vivo photothermal therapy after injection through the tail vein.
(A)–(E) The microvasculature was imaged at different timing to evaluate the therapeutic effect. (F) and (G) The tomographic projection images of the tumor region at 72 h after treatment. (H) Tumor volumes and PA signals amplitude at different timing after treatment. (I) Image with H&E staining histopathology of normal tissue around the tumor (R1) in Figure E. (J) Image with H&E staining histopathology in tumor site (R2) in Figure E.
4 Conclusion
In conclusion, a wavelength-switchable PAM was proposed to guide and assess the PPT by mapping the microvascular morphology and the distribution of nanoparticles with high resolution. The PAM system can reveal morphological changes in the tumor microenvironment and feeding arteries and draining veins following tumor growth. The PAM can also flexibly select near-infrared laser according to the absorption of the nanoplatforms to visualize the nanoparticles aggregation within tumor, which was used to determine the optimal irradiation timing. The in vivo experiments demonstrate the proposed photoacoustic microscopy enables the detailed quantitative visualization of tumor microvasculature and nanoparticles accumulation to guide PTT and noninvasively evaluate therapeutic effect, which may enhance PA imaging and improve therapeutic efficacy, and can be extended to guide and assess a larger field in precision medicine.
Funding source: Science and Technology Planning Project of Guangdong Province, China 10.13039/501100012245
Award Identifier / Grant number: 2015B020233016
Funding source: Science and Technology Program of Guangzhou 10.13039/100017369
Award Identifier / Grant number: 2019050001
Funding source: National Natural Science Foundation of China 10.13039/501100001809
Award Identifier / Grant number: 61822505; 11774101; 61627827
Funding source: Special Funds for the Cultivation of Guangdong College Students' Scientific and Technological Innovation (“Climbing Program” Special Funds) 10.13039/501100018601
Award Identifier / Grant number: pdjh2021a0128
-
Author contributions: All the authors have accepted responsibility for the entire content of this submitted manuscript and approved submission.
-
Research funding: This work was supported by grants from the National Natural Science Foundation of China (61822505; 11774101; 61627827), the Science and Technology Planning Project of Guangdong Province, China (2015B020233016), the Science and Technology Program of Guangzhou (2019050001), and Special Funds for the Cultivation of Guangdong College Students’ Scientific and Technological Innovation (“Climbing Program” Special Funds) (pdjh2021a0128).
-
Conflict of interest statement: The authors declare that there are no conflicts of interest related to this article.
References
[1] F. Bray, J. Ferlay, I. Soerjomataram, et al.., “Global cancer statistics 2018: GLOBOCAN estimates of incidence and mortality worldwide for 36 cancers in 185 countries,” CA Canc. J. Clin., vol. 68, pp. 394–424, 2018, https://doi.org/10.3322/caac.21492.Suche in Google Scholar PubMed
[2] F. Zhou, M. Wang, T. Luo, J. Qu, and W. R. Chen, “Photo-activated chemo-immunotherapy for metastatic cancer using a synergistic graphene nanosystem,” Biomaterials, vol. 265, p. 120421, 2021, https://doi.org/10.1016/j.biomaterials.2020.120421.Suche in Google Scholar PubMed PubMed Central
[3] B. Zhou, J. Song, M. Wang, et al.., “BSA-bioinspired gold nanorods loaded with immunoadjuvant for the treatment of melanoma by combined photothermal therapy and immunotherapy,” Nanoscale, vol. 10, pp. 21640–21647, 2018, https://doi.org/10.1039/c8nr05323e.Suche in Google Scholar PubMed PubMed Central
[4] F. Zhou, J. Yang, Y. Zhang, et al.., “Local phototherapy synergizes with immunoadjuvant for treatment of pancreatic cancer through induced immunogenic tumor vaccine,” Clin. Canc. Res., vol. 24, pp. 5335–5346, 2018, https://doi.org/10.1158/1078-0432.ccr-18-1126.Suche in Google Scholar PubMed PubMed Central
[5] S. C. Hester, M. Kuriakose, C. D. Nguyen, and S. Mallidi, “Role of ultrasound and photoacoustic imaging in photodynamic therapy for cancer,” Photochem. Photobiol., vol. 96, pp. 260–279, 2020, https://doi.org/10.1111/php.13217.Suche in Google Scholar PubMed PubMed Central
[6] M. R. Hamblin and T. Hasan, “Photodynamic therapy: A new antimicrobial approach to infectious disease,” Photochem. Photobiol. Sci., vol. 3, pp. 436–450, 2004, https://doi.org/10.1039/b311900a.Suche in Google Scholar PubMed PubMed Central
[7] C. Frochot and S. Mordon, “Update of the situation of clinical photodynamic therapy in Europe in the 2003–2018 period,” J. Porphyr. Phthalocyanines, vol. 23, no. 04n05, pp. 347–357, 2019, https://doi.org/10.1142/s1088424619300027.Suche in Google Scholar
[8] H. Lin, S. Gao, C. Dai, Y. Chen, and J. Shi, “A two-dimensional biodegradable niobium carbide (MXene) for photothermal tumor eradication in NIR-I and NIR-II biowindows,” J. Am. Chem. Soc., vol. 139, pp. 16235–16247, 2017, https://doi.org/10.1021/jacs.7b07818.Suche in Google Scholar PubMed
[9] A. C. Doughty, A. R. Hoover, E. Layton, C. K. Murray, E. W. Howard, and W. R. Chen, “Nanomaterial applications in photothermal therapy for cancer,” Materials, vol. 12, p. 779, 2019, https://doi.org/10.3390/ma12050779.Suche in Google Scholar PubMed PubMed Central
[10] S. Liu, A. Doughty, C. West, Z. Tang, F. Zhou, and W. R. Chen, “Determination of temperature distribution in tissue for interstitial cancer photothermal therapy,” Int. J. Hyperther., vol. 34, pp. 756–763, 2018, https://doi.org/10.1080/02656736.2017.1370136.Suche in Google Scholar PubMed
[11] J. Wang, D. Liang, Z. Qu, I. M. Kislyakov, V. M. Kiselev, and J. Liu, “PEGylated-folic acid-modified black phosphorus quantum dots as near-infrared agents for dual-modality imaging-guided selective cancer cell destruction,” Nanophotonics, vol. 9, pp. 2425–2435, 2020, https://doi.org/10.1515/nanoph-2019-0506.Suche in Google Scholar
[12] X. Li, J. F. Lovell, J. Yoon, and X. Chen, “Clinical development and potential of photothermal and photodynamic therapies for cancer,” Nat. Rev. Clin. Oncol., vol. 17, pp. 657–674, 2020, https://doi.org/10.1038/s41571-020-0410-2.Suche in Google Scholar PubMed
[13] Q. Li, K. Chen, W. Huang, et al.., “Minimally invasive photothermal ablation assisted by laparoscopy as an effective preoperative neoadjuvant treatment for orthotopic hepatocellular carcinoma,” Canc. Lett., vol. 496, pp. 169–178, 2021, https://doi.org/10.1016/j.canlet.2020.09.024.Suche in Google Scholar PubMed
[14] Y. Liu, P. Bhattarai, Z. Dai, and X. Chen, “Photothermal therapy and photoacoustic imaging via nanotheranostics in fighting cancer,” Chem. Soc. Rev., vol. 48, pp. 2053–2108, 2019, https://doi.org/10.1039/c8cs00618k.Suche in Google Scholar PubMed PubMed Central
[15] J. P. Celli, B. Q. Spring, I. Rizvi, et al.., “Imaging and photodynamic therapy: mechanisms, monitoring, and optimization,” Chem. Rev., vol. 110, pp. 2795–2838, 2010, https://doi.org/10.1021/cr900300p.Suche in Google Scholar PubMed PubMed Central
[16] P. Huang, J. Lin, X. Wang, et al.., “Light-triggered theranostics based on photosensitizer-conjugated carbon dots for simultaneous enhanced-fluorescence imaging and photodynamic therapy,” Adv. Mater., vol. 24, pp. 5104–5110, 2012, https://doi.org/10.1002/adma.201200650.Suche in Google Scholar PubMed PubMed Central
[17] L. Liu, Q. Chen, L. Wen, C. Li, H. Qin, and D. Xing, “Photoacoustic therapy for precise eradication of glioblastoma with a tumor site blood-brain barrier permeability upregulating nanoparticle,” Adv. Funct. Mater., vol. 29, p. 1808601, 2019, https://doi.org/10.1002/adfm.201808601.Suche in Google Scholar
[18] Z. Zhang, W. Xu, M. Kang, et al.., “An all-round athlete on the track of phototheranostics: subtly regulating the balance between radiative and nonradiative decays for multimodal imaging-guided synergistic therapy,” Adv. Mater., vol. 32, p. 2003210, 2020, https://doi.org/10.1002/adma.202003210.Suche in Google Scholar PubMed
[19] L. V. Wang, “Multiscale photoacoustic microscopy and computed tomography,” Nat. Photonics, vol. 3, pp. 503–509, 2009, https://doi.org/10.1038/nphoton.2009.157.Suche in Google Scholar PubMed PubMed Central
[20] L. V. Wang and S. Hu, “Photoacoustic tomography: in vivo imaging from organelles to organs,” Science, vol. 335, pp. 1458–1462, 2012, https://doi.org/10.1126/science.1216210.Suche in Google Scholar PubMed PubMed Central
[21] P. Beard, “Biomedical photoacoustic imaging,” Interface Focus, vol. 1, pp. 602–631, 2011, https://doi.org/10.1098/rsfs.2011.0028.Suche in Google Scholar PubMed PubMed Central
[22] Z. Wang, F. Yang, H. Ma, Z. Cheng, and S. Yang, “Photoacoustic and ultrasound (PAUS) dermoscope with high sensitivity and penetration depth by using a bimorph transducer,” J. Biophot., vol. 13, p. e202000145, 2020, https://doi.org/10.1002/jbio.202000145.Suche in Google Scholar PubMed
[23] J. Lv, S. Li, J. Zhang, et al.., “In vivo photoacoustic imaging dynamically monitors the structural and functional changes of ischemic stroke at a very early stage,” Theranostics, vol. 10, p. 816, 2020, https://doi.org/10.7150/thno.38554.Suche in Google Scholar PubMed PubMed Central
[24] Q. Chen, H. Guo, T. Jin, W. Qi, H. Xie, and L. Xi, “Ultracompact high-resolution photoacoustic microscopy,” Opt. Lett., vol. 43, pp. 1615–1618, 2018, https://doi.org/10.1364/ol.43.001615.Suche in Google Scholar
[25] J. Chen, Y. Zhang, X. Li, et al.., “Confocal visible/NIR photoacoustic microscopy of tumors with structural, functional, and nanoprobe contrasts,” Photonics Res., vol. 8, pp. 1875–1880, 2020, https://doi.org/10.1364/prj.409378.Suche in Google Scholar
[26] X. Leng, K. M. S. Uddin, J. W. Chapman, et al., “Assessing rectal cancer treatment response using coregistered endorectal photoacoustic and US imaging paired with deep learning,” Radiology, vol. 299, p. 202208, 2021.10.1148/radiol.2021202208Suche in Google Scholar
[27] F. Yang, Z. Wang, and S. Yang, “Dual raster-scanning photoacoustic small-animal imager for vascular visualization,” Jove J. Vis. Exp., vol. 161, 2020, https://doi.org/10.3791/61584.Suche in Google Scholar PubMed
[28] G. He, B. Li, and S. Yang, “In vivo imaging of a single erythrocyte with high-resolution photoacoustic microscopy,” Front. Optoelectron., vol. 8, pp. 122–127, 2015, https://doi.org/10.1007/s12200-014-0461-z.Suche in Google Scholar
[29] Z. Cheng, H. Ma, Z. Wang, and S. Yang, “In vivo volumetric monitoring of revascularization of traumatized skin using extended depth-of-field photoacoustic microscopy,” Front. Optoelectron., vol. 13, pp. 307–317, 2020, https://doi.org/10.1007/s12200-020-1040-0.Suche in Google Scholar
[30] W. Huang, R. Chen, Y. Peng, et al.., “In vivo quantitative photoacoustic diagnosis of gastric and intestinal dysfunctions with a broad pH-responsive sensor,” ACS Nano, vol. 13, pp. 9561–9570, 2019, https://doi.org/10.1021/acsnano.9b04541.Suche in Google Scholar PubMed
[31] Y. Liu, H. Liu, H. Yan, et al.., “Aggregation-induced absorption enhancement for deep near-infrared ii photoacoustic imaging of brain gliomas in vivo,” Adv. Sci., vol. 6, p. 1801615, 2019, https://doi.org/10.1002/advs.201801615.Suche in Google Scholar PubMed PubMed Central
[32] F. Yang, Z. Wang, W. Zhang, et al.., “Wide-field monitoring and real-time local recording of microvascular networks on small animals with a dual-raster-scanned photoacoustic microscope,” J. Biophot., vol. 13, p. e202000022, 2020, https://doi.org/10.1002/jbio.202000022.Suche in Google Scholar PubMed
[33] L. Nie, S. Wang, X. Wang, et al.., “In vivo volumetric photoacoustic molecular angiography and therapeutic monitoring with targeted plasmonic nanostars,” Small, vol. 10, pp. 1585–1593, 2014, https://doi.org/10.1002/smll.201302924.Suche in Google Scholar PubMed
[34] B. Guo, Z. Sheng, D. Hu, C. Liu, H. Zheng, and B. Liu, “Through scalp and skull NIR-II photothermal therapy of deep orthotopic brain tumors with precise photoacoustic imaging guidance,” Adv. Mater., vol. 30, p. 1802591, 2018, https://doi.org/10.1002/adma.201802591.Suche in Google Scholar PubMed
[35] K. Haedicke, L. Agemy, M. Omar, et al.., “High-resolution optoacoustic imaging of tissue responses to vascular-targeted therapies,” Nat. Biomed. Eng., vol. 4, pp. 286–297, 2020, https://doi.org/10.1038/s41551-020-0527-8.Suche in Google Scholar PubMed PubMed Central
[36] S. Cho, J. Baik, R. Managuli, and C. Kim, “3D PHOVIS: 3D photoacoustic visualization studio,” Photoacoustics, vol. 18, p. 100168, 2020, https://doi.org/10.1016/j.pacs.2020.100168.Suche in Google Scholar PubMed PubMed Central
[37] L. Wen, W. Ding, S. Yang, and D. Xing, “Microwave pumped high-efficient thermoacoustic tumor therapy with single wall carbon nanotubes,” Biomaterials, vol. 75, pp. 163–173, 2016, https://doi.org/10.1016/j.biomaterials.2015.10.028.Suche in Google Scholar PubMed
© 2021 Zhiyang Wang et al., published by De Gruyter, Berlin/Boston
This work is licensed under the Creative Commons Attribution 4.0 International License.
Artikel in diesem Heft
- Frontmatter
- Editorial
- Nanotechnology, photonics, and immunotherapy for cancer diagnostics and therapeutics
- Perspectives
- Balance and modulation of immunoediting for cancer treatment using synergistic nano-photo-immuno effects
- Synergistic therapeutic strategies for cancer treatment based on nanophototherapy
- Reviews
- Nanoengineered photoactive theranostic agents for cancer
- Persistent luminescence materials for deep photodynamic therapy
- Spin Hall effect of light based on a surface plasmonic platform
- Peptide-conjugated nanoparticles for targeted photodynamic therapy
- Near infrared photoimmunotherapy of cancer; possible clinical applications
- Phototherapy meets immunotherapy: a win–win strategy to fight against cancer
- Nano-ablative immunotherapy for cancer treatment
- Plasmonic gold nanostars for synergistic photoimmunotherapy to treat cancer
- Research Articles
- Use of photoimmunoconjugates to characterize ABCB1 in cancer cells
- Nanotherapeutic approaches to overcome distinct drug resistance barriers in models of breast cancer
- Nanobody-targeted photodynamic therapy for the treatment of feline oral carcinoma: a step towards translation to the veterinary clinic
- Rod–sphere cluster irradiation with femtosecond laser pulses: cut and paste at the nanoscale
- Porphyrin-lipid nanovesicles (Porphysomes) are effective photosensitizers for photodynamic therapy
- Membrane composition is a functional determinant of NIR-activable liposomes in orthotopic head and neck cancer
- Brief exposure of skin to near-infrared laser augments early vaccine responses
- Photodynamic priming with triple-receptor targeted nanoconjugates that trigger T cell-mediated immune responses in a 3D in vitro heterocellular model of pancreatic cancer
- Photomodulation of lymphatic delivery of liposomes to the brain bypassing the blood-brain barrier: new perspectives for glioma therapy
- Fe2P nanorods based photothermal therapy combined with immune checkpoint inhibitors for pancreatic cancer
- Repeated porphyrin lipoprotein-based photodynamic therapy controls distant disease in mouse mesothelioma via the abscopal effect
- Smart NIR-light and pH responsive doxorubicin-loaded GNRs@SBA-15-SH nanocomposite for chemo-photothermal therapy of cancer
- Immunostimulatory photochemotherapeutic nanocapsule for enhanced colon cancer treatment
- Magnetic black phosphorus microbubbles for targeted tumor theranostics
- Photoacoustic-guided photothermal therapy by mapping of tumor microvasculature and nanoparticle
- A drawer-type abdominal window with an acrylic/resin coverslip enables long-term intravital fluorescence/photoacoustic imaging of the liver