Recent progress in terahertz difference-frequency quantum cascade laser sources
-
Kazuue Fujita

 ,
Seungyong Jung
,
Yifan Jiang
,
Seungyong Jung
,
Yifan Jiang

Abstract
Terahertz quantum cascade laser (QCL) sources based on intra-cavity difference frequency generation are currently the only electrically pumped monolithic semiconductor light sources operating at room temperature in the 1–6-THz spectral range. Relying on the active regions with the giant second-order nonlinear susceptibility and the Cherenkov phase-matching scheme, these devices demonstrated drastic improvements in performance in the past several years and can now produce narrow-linewidth single-mode terahertz emission that is tunable from 1 to 6 THz with power output sufficient for imaging and spectroscopic applications. This paper reviews the progress of this technology. Recent efforts in wave function engineering using a new active region design based on a dual-upper-state concept led to a significant enhancement of the optical nonlinearity of the active region for efficient terahertz generation. The transfer of Cherenkov devices from their native semi-insulating InP substrates to high-resistivity silicon substrates resulted in a dramatic improvement in the outcoupling efficiency of terahertz radiation. Cherenkov terahertz QCL sources based on the dual-upper-state design have also been shown to exhibit ultra-broadband comb-like terahertz emission spectra with more than one octave of terahertz frequency span. The broadband terahertz QCL sources operating in continuous-wave mode produces the narrow inter-mode beat-note linewidth of 287 Hz, which indicates frequency comb operation of mid-infrared pumps and thus supports potential terahertz comb operation. Finally, we report the high-quality terahertz imaging obtained by a THz imaging system using terahertz QCL sources based on intra-cavity difference frequency generation.
1 Introduction
Quantum cascade lasers (QCLs) [1] are one of the best known devices created by the engineering of electron wave functions in semiconductor heterostructures grown by molecular beam epitaxy or metal organic vapor phase epitaxy crystal growth techniques. Unlike devices based on band-to-band transitions, the electrical and optical properties of QCLs, such as optical transition energy and dipole moment, upper and lower laser states lifetimes, and electron transport, are determined by their heterostructure design [2], [3], [4]. Over the past two decades, QCLs have become the most attractive semiconductor sources in the mid-infrared (mid-IR, λ≈3–30 μm) and terahertz (THz, λ≈30–300) regions.
Figure 1A shows the operating temperatures of selected QCLs based on various material systems in the mid-IR and THz ranges. Modern mid-IR QCLs can operate continuous wave (CW) at and above room temperature with several watt levels of optical power output [5], [6], [7]. The maximum wall-plug efficiency of mid-IR QCLs exceeds 27% for pulsed operation and 21% for CW operation [7], [8]. Frequency-comb emission in mid-IR QCL has been reported at room temperature with important implications for spectroscopy and metrology [9], [10]. THz QCLs have also undergone tremendous progress since their first demonstration in 2001 [11], [12]. Thanks to the advancements in both the active region and waveguide designs, the performance and functionality of THz-QCLs have been steadily improved. Their peak power output in pulsed mode now exceeds 1 W at 3.4 THz [13], [14], and their CW power output exceeds 100 mW [15]. The emission frequencies of various THz QCLs span the 1.2–5.4-THz range [16], [17]. A few tens of kHz of the emission linewidth was measured in frequency-stabilized THz QCL [18]. Broadband emission from THz QCLs has been achieved by using a heterogeneous active region design [19]. Direct frequency-comb operation of THz QCLs has also been reported [20], including devices with the octave-spanning frequency combs [21], [22]. THz QCLs, nevertheless, still require cryogenic cooling for operation; the maximum operating temperature demonstrated for these devices without the assistance of strong magnetic field is 199.5 K for pulsed operation [23] and 129 K for CW operation [24].
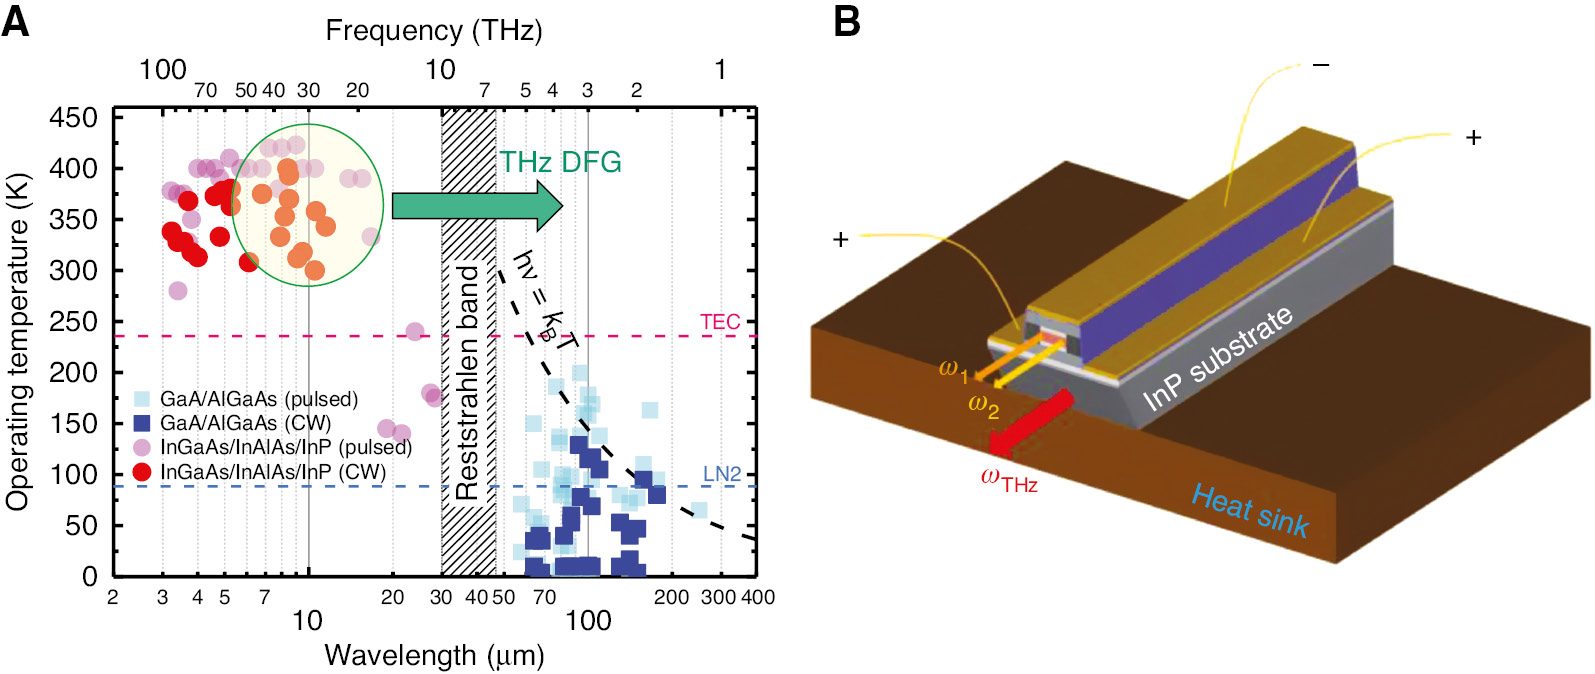
Current status of maximum operating temperature of QCLs and THz DFG-QCL schematic.
(A) Operating temperature of QCLs as a function of the emission wavelength (or frequency, top axis). THz DFG can be achieved in mid-IR quantum cascade lasers operating between 6 μm and 15 μm. (B) Schematic of a THz DFG-QCL.
An alternative approach to the generation of THz from QCLs is based on intracavity difference-frequency generation (DFG) in a dual-wavelength mid-IR QCL. This method was demonstrated for the first time by Belkin et al. in 2007 [25]. These devices, known as THz DFG-QCLs, use a mid-IR QCL active region engineered to exhibit a giant intersubband nonlinear susceptibility χ(2) for an efficient THz DFG process. Upon application of bias current, THz DFG-QCLs produce two mid-IR pump frequencies as well as THz frequency, which corresponds to the difference of the mid-IR pump frequencies, via the intra-cavity nonlinear mixing process in the device active region. The optical nonlinearity of the DFG-QCL active region does not require population inversion across the THz transition. As a result, THz DFG-QCLs can operate at room temperature, unlike THz QCLs. THz DFG-QCLs are currently the only electrically pumped, monolithic, mass-producible semiconductor sources operable at room temperature [26], [27], which can be handled like any other mid-IR QCLs, as shown in Figure 1B.
Initially, THz DFG-QCL sources were designed based on modal phase matching in the laser waveguide, which confined both mid-IR and THz modes in the laser active region [25], [26], [27]. THz radiation was outcoupled through the mid-IR waveguide facets. However, this approach was highly inefficient [28]. Due to excessive THz free-carrier absorption in the laser active region, only THz radiation generated at 10–100 μm from the waveguide facet could be outcoupled. Implementation of the Cherenkov emission scheme in THz DFG-QCLs dramatically improved both THz output power and tuning bandwidth of the devices [28], [29], [30]. Using a semi-insulating (SI) InP substrate or a high-resistivity float-zone (HR-FZ) Si substrate that permits the Cherenkov condition, Cherenkov THz DFG-QCLs emit THz radiation into the substrate and can efficiently extract THz radiation along the entire device length. The implementation of the Cherenkov scheme in DFG-QCLs resulted in more than two orders of magnitude enhancement in the THz output power and mid-IR-to-THz conversion in DFG-QCL devices (defined as the ratio of the THz power output to the product of the output powers of the two mid-IR pumps). Automatic phase matching is fulfilled for any THz frequency in the Cherenkov scheme, which allows for broadband tuning of THz DFG emission, which was demonstrated in the 1–6-THz range using an external-cavity (EC) DFG-QCL setup [29], [31], [32], [33], [34], [35], [36], [37], [38]. Monolithic electrically tunable THz DFG-QCLs have also been developed with various device configurations [33], [34], [35], [36], [37]. The state-of-the-art monolithic DFG-QCL tuners have demonstrated single-mode THz emission with a tuning range of 2.06–4.35 THz at room temperature [37].
Recently, CW operation of Cherenkov THz DFG-QCLs has been demonstrated at room temperature by Lu et al. [7], [37], [39], [40], [41] at Northwestern University, based on a buried heterostructure waveguide scheme with epi-down mounting on a diamond heat sink to reduce device thermal resistance [42]. The device produced first room-temperature CW power of 3 μW at 3.6 THz [39], and after further improvement, 14 μW at 3.4 THz was achieved by the same group. The reduction of thermal resistance also results in record THz peak power as high as 1.9 mW in pulsed mode at room temperature [7], [40], demonstrating the high potential of THz DFG-QCL devices to practical use in various THz applications.
In this paper, we review recent advances in THz DFG-QCL technology and present future prospects for THz DFG-QCLs, including new results for imaging applications. In Section 2, we discuss the basic operating principles of Cherenkov THz DFG-QCLs and present the two most commonly used DFG-QCL active region designs: the bound-to-continuum (BTC) design and the dual-upper-state (DAU) design. We also discuss broadband THz DFG-QCLs based on nonlinear mixing between a single mode selected by the distributed feedback (DFB) grating and Fabry-Perot (FP) modes selected by the laser cavity, respectively. Section 3 describes a method to dramatically improve THz outcoupling efficiency of THz DFG-QCLs based on a III–V-Si hybrid laser concept. The topic of CW operation of THz DFG-QCLs is discussed in Section 4. Depending on their design, CW THz DFG-QCLs can broadband multi-mode emission with a narrow inter-mode beat-note frequency. In Section 5, we review widely tunable THz DFG-QCL sources based on EC setup and monolithic architectures. The applications of THz DFG-QCL for imaging are presented in Section 6. Finally, Sections 7 and 8 provide future perspectives and conclusions.
2 Cherenkov phase-matching scheme and active region design
2.1 Cherenkov phase-matching scheme
Figure 2 shows the schematic of the Cherenkov THz DFG-QCL. All THz DFG-QCLs devices have so far been fabricated using only InGaAs/AlInAs/InP materials system, although other materials systems can in principle be used as well. The choice of InGaAs/AlInAs/InP materials for creating THz DFG-QCLs is determined by the high performance of mid-IR QCLs in this materials system (cf. Figure 1A) and the availability of semi-insulating substrates that can be used to extract THz radiation in the Cherenkov scheme. Cherenkov emission in THz DFG-QCL occurs when the phase velocity of the nonlinear polarization wave in the active region is higher than the phase velocity of the THz waves in the substrate. Using a slab waveguide approximation, the nonlinear polarization wave propagating along the x-direction (see Figure 2) at THz frequency (ωTHz=ω3=ω1–ω2) in the active region of DFG-QCLs can be expressed as follows [28], [32]:
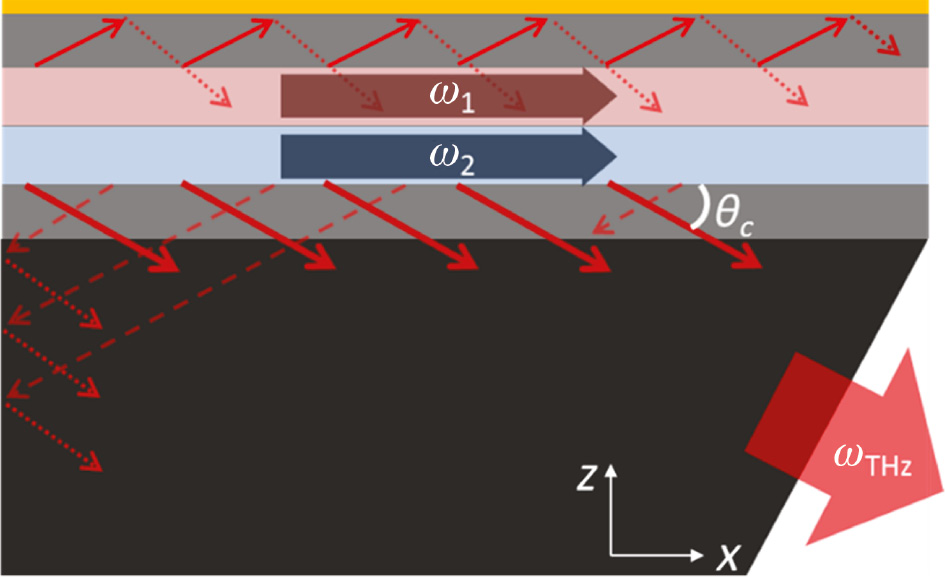
Schematic of the Cherenkov THz DFG-QCL.
Red arrows indicate the Cherenkov radiation emitting towards the top metal contact and the bottom InP substrate with an angle of θC. Mid-IR pumps are indicated as ω1 and ω2. The device layers are, starting from the top, gold (yellow), upper cladding layer (light grey), active region (red and blue), lower cladding layer and current injection layer (light grey), and SI InP substrate (dark grey).
where ε0 is the permittivity in vacuum, χ(2) is the intersubband second-order nonlinearity in the active region, E1z and
where c is the speed of light and
where nTHz is the THz refractive index of the substrate. Cherenkov waves in DFG-QCLs, propagating towards the top contact as well as the substrate, are partially reflected by the waveguide layers, pass through the active region multiple times, and interfere with each other before finally outcoupling to free space via the substrate. Initial Cherenkov DFG-QCLs used the SI InP substrate, as it provides not only the relatively low THz loss but also higher THz refractive index (nSI-InP≈3.5–3.6) in the 3–5-THz range than in the mid-IR group index for TM00 pump modes (ng≈3.35–3.40), which is nearly constant over the 8–12-μm mid-IR range. Therefore, the Cherenkov angle in the SI InP substrate is about 20°, which requires substrate facet polishing between 20° and 30° to avoid total internal reflection and to outcouple THz light parallel to the laser cavity. To avoid obscuration of THz beam, DFG-QCL devices are mounted in a way that the bottom edge of the substrate is aligned to the edge of the copper mount, as shown in Figure 1B. More advanced Cherenkov devices using a foreign substrate with an extremely low THz loss material, such as a HR-FZ Si, are discussed in Section 3. Otherwise, all devices described throughout the paper use SI InP as a substrate material to implement the Cherenkov emission scheme in THz DFG-QCLs.
2.2 Active region design
Terahertz (ωTHz) generation in DFG-QCLs occurs when two mid-IR pumps (ω1, ω2) resonantly interact with intersubband energy levels in the QCL active region engineered to possess a giant second-order nonlinear susceptibility χ(2). The active region of DFG-QCLs is designed to provide resonant nonlinear susceptibility with population inversion, which provides optical gain instead of absorption for mid-IR pumps. As a result, efficient THz generation in DFG-QCLs can be achieved. For the THz DFG-QCLs with modal phase matching, THz power in DFG-QCLs can be expressed as follows [25], [26]:
where
Figure 3A,B shows the conduction band diagrams and spectral functions A(z, E), simulated using the nonequilibrium Green’s function (NEGF) theory [49], [50], for both the BTC and the DAU active regions. Triplets of states of both active regions, shown in insets in Figure 3A,B, contribute to the resonant DFG processes. The contour plot of the spectral function represents the density of states at zero in-plane momentum. Due to the several transition channels from the single upper level to the miniband type lower levels, a single BTC active region exhibits a relatively wide gain spectrum and a heterogeneous active region design with two stacks of the BTC active regions, with each stack designed to have slightly different gain peaks, is frequently used for widely tunable THz DFG-QCL devices. For the DAU active region, the additional upper lasing level provides even more optical transition channels for stimulated emission than those available in the BTC design so that the gain bandwidth of a single DAU active region [51], [52], [53], [54], [55] can be comparable with the two-stack heterogeneous BTC active region [53], [55]. This situation is illustrated in Figure 3C, where the gain curves of the single BTC and single DAU are plotted together for comparison, and we estimate the gain bandwidth of 161 cm−1 and 262 cm−1, respectively, by assuming the mirror loss of 4 cm−1 (cavity length: L~3 mm).
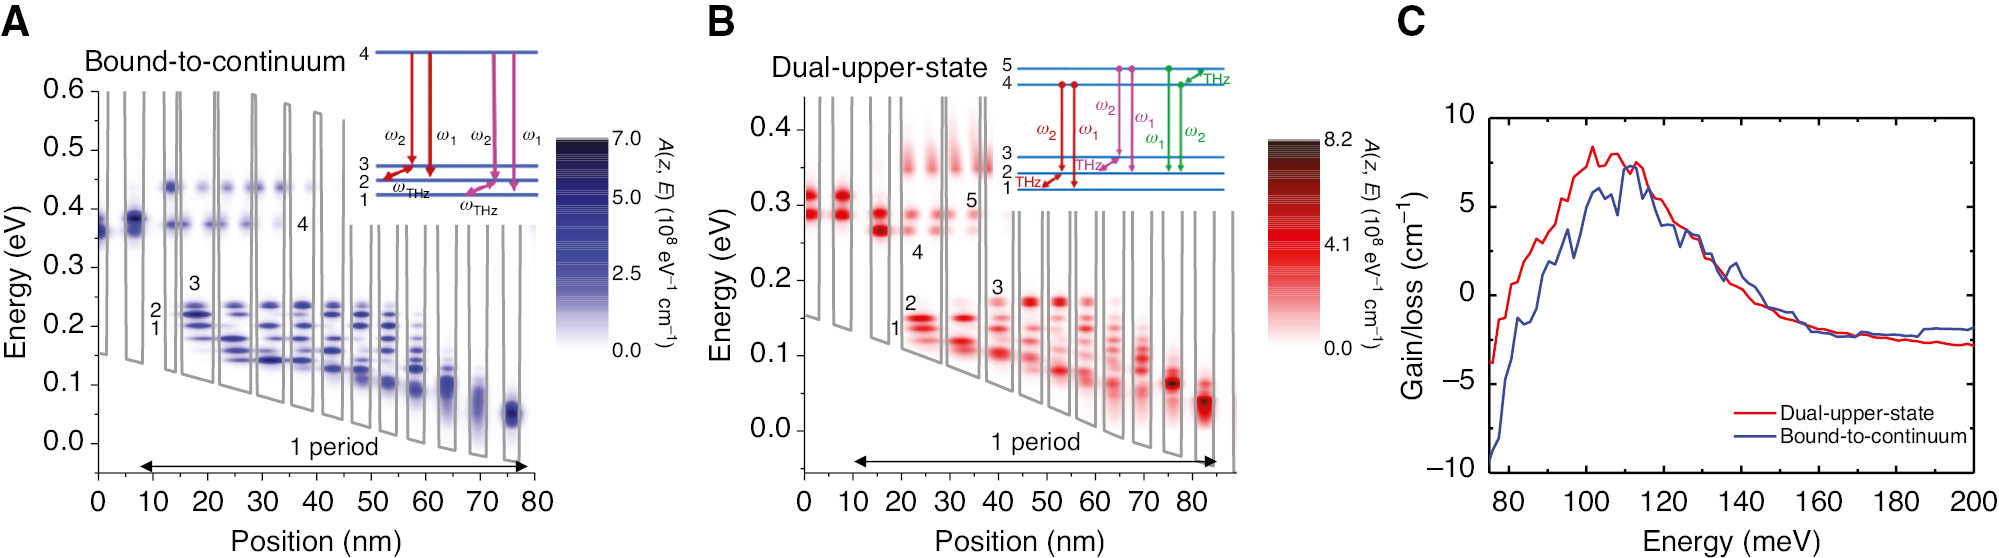
Active region structures for THz DFG-QCLs.
(A) Contour plot of the spectral function A(z, E) of a λ≈9.3 μm BTC active region design for THz DFG-QCLs as a function of position z and energy E. State 4 is the upper laser state, while states 3, 2, and 1 represent the lower laser state manifold. Relevant triplets of states that produce strong nonlinearity for THz DFG are shown in the inset. (B) Contour plot of the spectral function A(z, E) of a DAU active region design for THz DFG-QCLs as a function of position z and energy E. States 5 and 4 are the upper lasing states, while states 3, 2, and 1 represent the lower lasing state manifold. Relevant triplets of states that produce strong nonlinearity for THz DFG are shown in the inset. (C) Absorption/gain amplitude of the BTC and DAU active region designs, calculated with the NEGF transport code.
Using the band-structure parameters obtained from the previous analysis, we estimate the nonlinearity χ(2) of each active region design by combining the contributions to χ(2) of each of the triplets of states involved in the resonant DFG shown in the insets in Figure 3A,B. The contribution of each of the triplets can be written as follows:
where ΔN is the population inversion density between upper and lower laser states (we assumed here that the populations of the upper states are the same and the populations of the lower states are also the same), and zij, ωij, and Γij are the dipole matrix element, frequency, and transition linewidth broadening factor between states i and j. Assuming the mid-IR pump frequencies are sufficiently close to the corresponding intersubband transitions, i.e. ω1≈ω13 and ω2≈ω12, the value of χ(2) in Eq. (5) is principally determined by the values of ΔN, the transition dipole moments zij, and the linewidth broadening factors Γij. The value of ΔN is obtained by computing the required population inversion in a DFG-QCL to provide a threshold condition (modal gain=modal loss) in the laser cavity. We assume ΔN≈1.0×1015 cm−3 for the population inversion at room temperature. Assuming Γij=12.5 meV for the mid-IR transitions and Γij=4 meV for the THz transitions and a threshold gain of 15 cm−1 in the active region, we obtain |χ(2)|=15.1 nm/V for the 9.3 μm BTC active region design and |χ(2)|=24.7 nm/V for the DAU active region design at the same THz frequency of 3.1 THz. The higher χ(2) value for the DAU active region, compared to that for the BTC active region, is attributed to constructive addition of nonlinearity from additional triplet states accessible due to the presence of two upper states, as shown in Figure 3B inset.
To compare the performance of THz DFG-QCLs with BTC and DAU active regions [47], we have fabricated two DFG-QCL wafers: one with the two-stack BTC active region (the lower 20 periods designed for λ≈8.5 μm and the upper 20 periods designed for λ≈9.3 μm) and the other with the single DAU active region (40 periods for λ≈10.5 μm). All the epi-structures were grown on an undoped InP substrate by metal organic vapor phase epitaxy (MOVPE). Growth started with a 400-nm-thick InGaAs current injection layer (Si, 1.5×1018 cm−3), followed by a 5.0-μm-thick InP (Si, 1.5×1016 cm−3) lower cladding layer. Lattice matched InGaAs/InAlAs active regions were used as the emitting region and sandwiched between a 250-nm-thick lower In0.53Ga0.47As layer (Si, 1.5×1016 cm−3) and a 450-nm-thick upper In0.53Ga0.47As layer (Si, 1.5×1016 cm−3). The BTC active region was doped with a 30% higher average sheet carrier concentration (1.3×1011 cm−2) compared to the DAU active region. Dual-period buried gratings were defined to select two mid-IR pump wavelengths and etched 250-nm deep into the upper In0.53Ga0.47As layer. Then, the wafer was wet-etched to form 12-μm-wide stripes and buried with a SI Fe-doped InP layer for planarization of the wafer surface. Finally, a 5.0-μm-thick InP (Si, 1.5×1016 cm−3) upper cladding layer was grown, followed by a 0.3-μm-thick InP (Si, ~1018 cm−3) cap layer. Evaporation of a top Ti/Au contact was followed by electroplating a 5-μm-thick Au layer on top of the QC laser structure. After growth, the wafer was processed into ridge waveguide and the front substrate facet was polished into 20o to facilitate THz outcoupling (see Figure 2). The device cavity lengths were all identical to 3 mm, and both mid-IR facets were left uncoated. Measurements of both mid-IR and THz data of the devices were performed using 200-ns current pulses at a 100-kHz repetition rate at a heat sink temperature of 300 K.
Figure 4 depicts THz power output versus a product of two mid-IR pump powers for both heterogeneous BTC and DAU devices. Both devices emit a similar THz frequency of ~2.8 THz, as shown in the inset in Figure 4. The THz power conversion efficiency, defined as the ratio of the THz peak power to the product of mid-IR pump powers, is estimated to be ~0.8 mW/W2 for the DAU device and ~0.2 mW/W2 for the BTC device. The high conversion efficiency of the DAU device is attributed to the higher value of nonlinear susceptibility χ(2) compared to that of the BTC device.
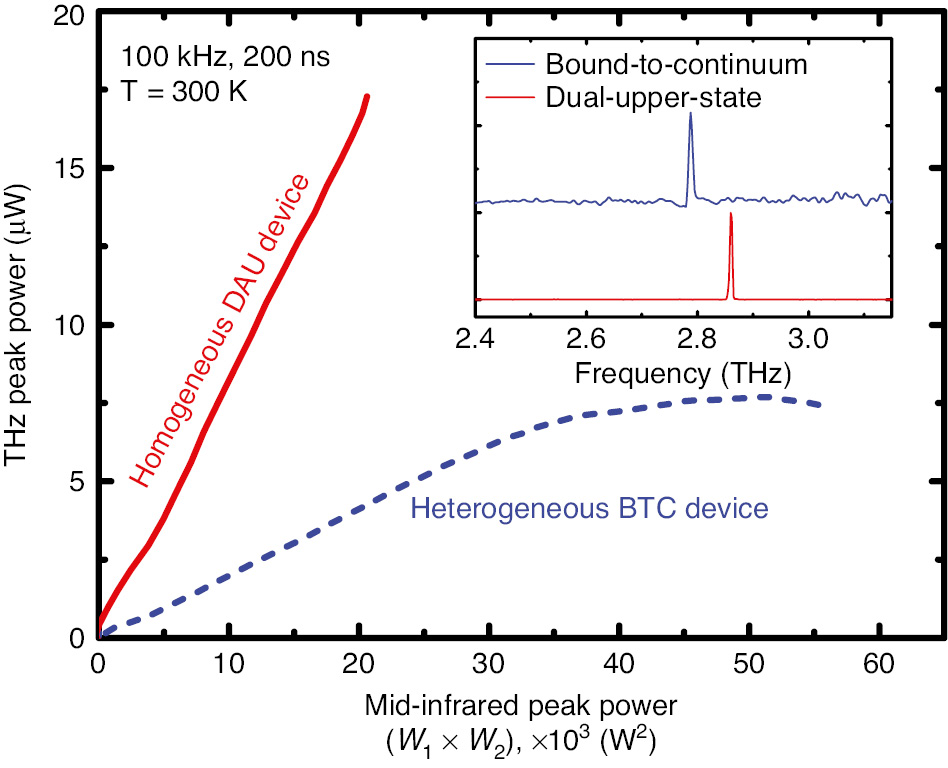
Terahertz peak power output versus the product of mid-IR pump powers for a device with the DAU active region (solid lines) and a device with the heterogeneous BTC active region at 300 K (dashed line).
Inset shows room-temperature THz emission spectra for DAU and a heterogeneous BTC devices at 300 K.
2.3 Broadband THz DFG-QCLs
In order to achieve higher THz peak power output, we designed THz DFG-QCLs with a 90-period active region based on the DAU design [48]. The increase in the number of cascades improves the active-region confinement factor, slope efficiency, and maximum mid-IR peak power output [56], [57]. In this device, we also explore the potential of generating broadband THz emission via nonlinear mixing between a single mid-IR pump frequency selected by a DFB grating and FP modes of the second mid-IR pump selected by the laser cavity [48], as shown in Figure 5A. The spectral position of the DFB emission line has been determined from the calculated gain curve shown in Figure 5B. The DFB emission position was significantly detuned about 80 cm−1 from the gain peak not to suppress the FP emission. As a result, output power and bandwidth of the FP modes are expected to be high and wide enough for the generation of broadband THz frequency. The device was fabricated as a buried heterostructure waveguide with the ridge width of 14 μm and the cavity length of 3 mm. The device was epi-up mounted and biased with a pulsed current width of 200 ns at a repetition rate of 50 kHz.
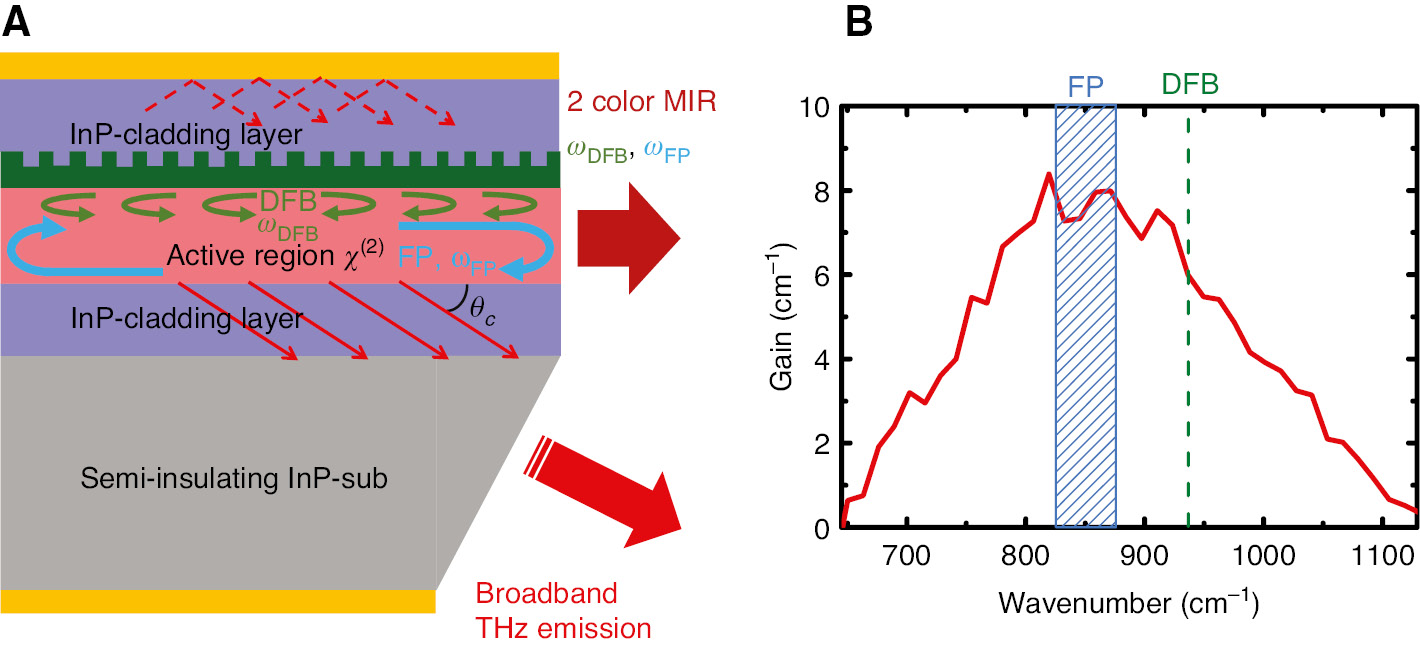
Working principle of DFB/FP device.
(A) Schematic of a DFB/FP THz DFG-QCL. (B) Gain curve of the DAU active region designs and spectral positions of a single mid-IR pump frequency selected by a DFB grating and FP modes of the second mid-IR pump selected by the laser cavity.
Figure 6A shows the THz performance of the broadband device with the 90-period DAU active region in the temperature range of 150–295 K. Using the DFB/FP pumping configuration, the device produced THz emission wider than one octave, spanning from 1.6 THz to 3.8 THz, without spectral gaps across the entire emission bandwidth. Peak THz output powers of approximately 1 mW at 150 K and ~0.2 mW at 295 K were obtained at the roll-over points. We note that the 1-mW power at 150 K is comparable with that of typical THz QCLs operating at similar temperatures [12], although several state-of-the-art THz-QCLs demonstrate higher output power around 150 K [23]. High THz power output at low temperatures is attributed mostly to the increased mid-IR pump power, as shown in the inset in Figure 6A. The mid-IR-to-THz conversion efficiency of the device stays approximately constant, as shown in the inset in Figure 6A. The small changes in the conversion efficiency may be attributed to the reduction in the linewidth of intersubband transitions with a temperature that can lead to an increase in the DFG nonlinearity, cf. Eq. (5). Figure 6B,C shows mid-IR and THz spectra of the presented device measured at different temperatures. Stable single-mode operation as well as multimode operation is obtained throughout the temperature ranges from 150 K to 295 K. The THz emission bandwidth remains nearly the same over the whole temperature range and slightly blue-shifts at higher temperatures due to the red-shift of the center of FP comb of lines of the second mid-IR pump.
![Figure 6: Temperature characteristics of the DFB/FP DFG-QCL.(A) Current-THz-light-output characteristics of the 14-μm-wide and 3-mm-long DFG-QCL at different heat sink temperatures measured in pulsed mode [48]. Inset shows the temperature dependence of the mid-IR-to-THz conversion efficiency (left axis) and product of mid-IR pump powers (right axis). Mid-IR (B) and THz (C) emission spectra of the device in (A) at different temperatures. The insets in panel (B) show mode details of the FP pump spectra.](/document/doi/10.1515/nanoph-2018-0093/asset/graphic/j_nanoph-2018-0093_fig_006.jpg)
Temperature characteristics of the DFB/FP DFG-QCL.
(A) Current-THz-light-output characteristics of the 14-μm-wide and 3-mm-long DFG-QCL at different heat sink temperatures measured in pulsed mode [48]. Inset shows the temperature dependence of the mid-IR-to-THz conversion efficiency (left axis) and product of mid-IR pump powers (right axis). Mid-IR (B) and THz (C) emission spectra of the device in (A) at different temperatures. The insets in panel (B) show mode details of the FP pump spectra.
Another device, referred to as the narrowband device below, demonstrates even higher THz peak power and mid-IR-to-THz conversion efficiency at room temperature, compared to those of the broadband device shown in Figure 6. Except for the slight difference in the DFB wavelength position, the narrowband device has identical dimensions (a 3.0-mm-long, 14-μm-wide buried heterostructure) and is also chosen from the same wafer used for the broadband device. Figure 7A shows that room-temperature mid-IR and THz emission spectra of the narrowband device. Mid-IR pump 1 has a single-frequency peak at ~960 cm−1 (λDFB~10.4 μm); mid-IR pump 2 has a number of FP modes, with a relatively narrow FP bandwidth centered at 860 cm−1 (λFP~11.6 μm). The room-temperature mid-IR emission spectrum of this device is shown in the inset in Figure 7A. Multi-mode THz emission is observed at the center frequency of ~3 THz with a bandwidth of ~1.2 THz that is about 1 THz narrower than the bandwidth of the broadband device. As shown in Figure 7B, mid-IR peak power of up to 1.61 W and the threshold current density of 2.1 kA/cm2 are obtained for the narrowband device at room temperature. The narrowband device produced maximum THz peak power of ~0.3 mW, which is an impressive performance considering the device operating in the multimode regime. The THz maximum wall-plug efficiency (WPE) is estimated to be 0.6×10⁻⁵, which is approximately the same as the recorded (0.7×10⁻⁵) WPE of single-frequency THz DFG-QCLs reported in Refs. [7], [40]. Figure 7C shows THz output power versus the product of the two mid-IR pump powers for the broadband and narrowband devices. The narrowband device produces the record conversion efficiency of 1.2 mW/W2, corresponding to a factor of 6 improvement in the efficiency, compared to that of the broadband DFG-QCL. As the active region is designed to possess high χ(2) for DFG near 3~3.5 THz and THz power is proportional to ω2 [see Eq. (4)], a more efficient DFG process in the 2.8–3.5 THz band is responsible for such high efficiency in the narrowband device.
![Figure 7: Room-temperature performance of a 3-mm-long, 14-μm-wide DFG-QCL with a narrower FP pump spectrum [48].(A) Mid-IR (inset) and THz emission spectra of the device. (B) THz peak power (red solid line), the mid-IR FP and DFB pump powers (dashed lines), and voltage (black solid line) versus current density. (C) Peak THz output powers versus the products of mid-IR pump powers for the narrowband device and the broadband device.](/document/doi/10.1515/nanoph-2018-0093/asset/graphic/j_nanoph-2018-0093_fig_007.jpg)
Room-temperature performance of a 3-mm-long, 14-μm-wide DFG-QCL with a narrower FP pump spectrum [48].
(A) Mid-IR (inset) and THz emission spectra of the device. (B) THz peak power (red solid line), the mid-IR FP and DFB pump powers (dashed lines), and voltage (black solid line) versus current density. (C) Peak THz output powers versus the products of mid-IR pump powers for the narrowband device and the broadband device.
3 THz extraction scheme
The power output of THz DFG-QCLs is highly dependent on the extraction efficiency of THz DFG radiation from the device. For Cherenkov THz DFG-QCLs, the substrate is the medium in which the Cherenkov THz beam propagates towards the outcoupling facets. The use of a proper substrate material with low optical loss and an appropriate THz refractive index is imperative to achieve high THz outcoupling efficiency in Cherenkov DFG-QCLs. Until recently, all Cherenkov THz DFG-QCLs were operated on SI high-resistivity (HR) InP substrates, which are native substrates for growing high-performance InGaAs/AlInAs mid-IR QCLs and DFG-QCLs. SI InP has a THz refractive index of nSI-InP~3.5–3.6, satisfying the Cherenkov DFG condition in Eq. (3) and relatively low THz loss. However, despite the low free carrier concentration in SI InP (~109 cm−3), the presence of two-phonon, differential-phonon, and impurities-related absorption bands limits the absorption length for terahertz radiation to ~2 mm near 3.5 THz [58]. In addition, a relatively large THz refractive index results in the Cherenkov emission cone angle of ~20°, which is larger than the critical angle of ~16° at the semiconductor-air interface. To avoid the total internal reflection of the Cherenkov emission, DFG-QCL devices have the InP substrate facet polished into a wedge shape with an angle between 20° and 30°. However, this only provides outcoupling for a “bottom” portion of the Cherenkov radiation cone.
Using HR-FZ Si as a substrate for Cherenkov DFG-QCLs provides many advantages and can dramatically improve device performance compared to the DFG-QCLs on SI InP substrates. HR-FZ Si has the value of the refractive index (ns~3.4), which matches well with the group index ng~3.37 in typical DFG-QCLs to fulfill the Cherenkov condition over the entire THz range. The Cherenkov cone angle of ~10° in the Si substrate is smaller than the critical angle so that the DFG-QCLs on Si substrates do not require the substrate facet polishing. The shallow cone angle also enables complete extraction of the lateral portion of the Cherenkov beam, resulting in increased THz outcoupling efficiency. In addition, extremely low THz loss in HR-FZ Si, as shown in Figure 8, enables a long extraction length of THz waves. For example, the absorption length in HR-FZ Si at 3.5 THz is longer than 5 cm compared to the length of ~1–2 mm for SI InP [58], [59]. Furthermore, very small THz refractive index dispersion of HR-FZ Si offers beam-steering-free wavelength-tuning operation in DFG-QCLs [32].
![Figure 8: Comparison of HR-FZ Si and SI InP substrates.The refractive indices (A) and optical absorption (B) of HR-FZ Si (red) and SI InP (blue) as a function of frequency [59].](/document/doi/10.1515/nanoph-2018-0093/asset/graphic/j_nanoph-2018-0093_fig_008.jpg)
Comparison of HR-FZ Si and SI InP substrates.
The refractive indices (A) and optical absorption (B) of HR-FZ Si (red) and SI InP (blue) as a function of frequency [59].
To quantify enhanced “lateral” extraction efficiency in a DFG-QCL device with HR-FZ Si, three-dimensional (3D) finite-element simulations using (COMSOL Inc., Stockholm, Sweden) have been performed by ignoring the optical losses in both substrates. Figure 9A,B shows simulation results obtained from a 203-μm-long Cherenkov THz DFG-QCL operating at 3.5 THz on a SI InP substrate (Figure 9A) and a HR-FZ Si substrate (Figure 9B). The nonlinear-polarization sources in the QCL active region are modeled by setting dipoles to radiate forward-propagating waves (direction to the facet) at a fixed frequency of 3.5 THz in TM polarization (oscillating across the layers). The substrate facet polishing angles were 20° for the InP substrate and 10° for the Si substrate. We estimate the facet outcoupling efficiency of each case by comparing the incoming THz power onto the substrate facet to the outcoupled THz power on the air screen, as shown in Figure 9. Our simulations show that the facet outcoupling efficiency of the device with the SI InP substrate is about 30% and that with the HR-FZ Si is about 45%, indicating that the enhanced lateral extraction of the Cherenkov beam in the HR-FZ Si devices leads to 50% improvement in the efficiency compared to that of the SI InP devices.
![Figure 9: 3D Simulation results of Cherenkov THz DFG-QCLs.(A) Schematic of the Cherenkov THz DFG emission from a narrow-ridge THz DFG-QCL. (B) 3D COMSOL simulation of the THz power intensity outcoupled from the SI InP device to air. The yellow lines are the power streamlines indicating propagation direction of THz power outcoupled to equal points on the air monitor. All simulations assume uniform mid-IR pumps intensity in the laser cavity. Similar simulations are performed for the HR-FZ Si device. (C) The ratio of THz power of the HR-FZ-Si DFG-QCL to THz power of the SI InP reference device at different cavity lengths [59].](/document/doi/10.1515/nanoph-2018-0093/asset/graphic/j_nanoph-2018-0093_fig_009.jpg)
3D Simulation results of Cherenkov THz DFG-QCLs.
(A) Schematic of the Cherenkov THz DFG emission from a narrow-ridge THz DFG-QCL. (B) 3D COMSOL simulation of the THz power intensity outcoupled from the SI InP device to air. The yellow lines are the power streamlines indicating propagation direction of THz power outcoupled to equal points on the air monitor. All simulations assume uniform mid-IR pumps intensity in the laser cavity. Similar simulations are performed for the HR-FZ Si device. (C) The ratio of THz power of the HR-FZ-Si DFG-QCL to THz power of the SI InP reference device at different cavity lengths [59].
Figure 9C displays the ratio of THz power of a 3.5-THz DFG-QCL on the HR-FZ Si to that on the SI InP with different cavity lengths. The expected power output from longer cavity devices (PTHz) is obtained by using the following expression written as follows:
where ηext is the extraction efficiency of the Cherenkov cone through the facet, as determined from the COMSOL simulations, I0 is the linear power density (W/m) of the THz Cherenkov wave emitted from the laser waveguide into the substrate, Lcav is the laser cavity length, and αsub is the absorption coefficient of the substrate. The power output of the SI InP device barely increases after the cavity length exceeds the absorption length of the THz radiation in the SI InP substrate (~0.5–2 mm in the 3–5-THz range [58]). In contrast, the extremely long THz absorption length (>5 cm) in HR-FZ Si allows the power output of the HR-FZ Si device to continuously increase with the cavity length.
For the proof of concept demonstration, the laser structure was grown on a 660-μm-thick SI InP substrate by a commercial foundry (IQE Inc., Cardiff, UK). The active region of our DFG-QCL is designed based on the BTC transition scheme [45], and its waveguide structure is similar to that of the device reported in Ref. [29]. The growth started with a 200-nm-thick In0.53Ga0.47As current injection/etch-stop layer followed by a 3-μm-thick InP cladding layer and a 200-nm-thick In0.53Ga0.47As waveguide layer. Then, two 25-repetition stacks of active regions, the bottom one designed for the peak gain at 8.5 μm and the top one designed for the gain peak at 9.5 μm, were grown with In0.53Ga0.47As/In0.52Al0.48As superlattices. The active regions were capped with a 300-nm-thick In0.53Ga0.47As waveguide layer, a 3-μm-thick InP cladding layer, a 100-nm-thick InP contact layer, and finally a 10-nm-thick In0.53Ga0.47As capping layer.
A piece of the grown wafer was processed into DFB lasers with the side current injection scheme [29] following conventional dry-etched ridge waveguide fabrication steps. The first-order surface gratings with two sections to select two mid-IR pump frequencies were fabricated using e-beam lithography and dry etching. The grating pitches for the 9.02-m short wavelength (λshort) and the 10.08-μm long (λlong) wavelength pumps are 1.408 μm and 1.584 μm, respectively. The completely processed wafer die was cleaved into two pieces, one for the characterization as the reference devices on the SI InP substrate and the other, for wafer bonding to the HR-FZ Si substrate.
The completely processed QCL wafer was transfer-printed on HR-FZ Si using (SU-8 MicroChem Corp., Westborough, MA, USA) epoxy as an adhesive layer. Detailed fabrication steps can be found in Ref. [59]. We first defined 50-μm-wide 8-μm-tall SU-8 epoxy supporting elements next to each QCL ridge on the processed wafer to prevent epi-layer damage during the wafer-bonding process. Using crystal glue (Crystalbond 509), we then attached the wafer to a piece of glass slide in a way that laser ridges face the glass side. Then, the InP substrate was mechanically and chemically removed until the top surface of the InGaAs current injection/etch stop layer was completely revealed. The exposed surface of the current injection layer was then bonded to a 1-mm-thick HR-FZ Si wafer coated with a 100-nm-thick SU-8 layer. The bonding was performed in the Applied Microengineering Ltd., wafer bonding machine at a pressure of 1 MPa and a temperature of 180°C for 15 min. Finally, the glass slide was removed by dissolving the crystal glue with acetone and the QCL-on-Si wafer was diced into laser bars using a dicing saw. The front facets of the Si and reference InP devices were polished at 15° and 30°, respectively, to outcouple THz Cherenkov emission in the direction parallel to the laser cavity. All facets were left uncoated.
Figure 10 shows the scanning electron microscopy images of the facets of the devices on InP and Si substrates. The somewhat roughened surface of the facet of the QCL-on-Si originates from the dicing process (devices on SI InP were cleaved). The thickness of the SU-8 bonding layer is estimated from Figure 10B to be about 100 nm. According to our simulations, a 100-nm-thick SU-8 layer has about 90% transmission of the THz Cherenkov radiation into the Si substrate at 3.5 THz. Devices were indium-soldered to copper blocks in the episide-up configuration and wire bonded.
![Figure 10: Scanning electron microscope images: the reference InP device (A) and the Si device (B) [59].](/document/doi/10.1515/nanoph-2018-0093/asset/graphic/j_nanoph-2018-0093_fig_010.jpg)
Scanning electron microscope images: the reference InP device (A) and the Si device (B) [59].
Figure 11A displays the mid-IR and THz spectra measured from the Si device where stable dual single-mode mid-IR pump operation was obtained at the peak wavelengths of 994 cm−1 (λlong=10.1 μm) and 1110 cm−1 (λshort=9.0 μm), as determined by the DFB grating pitches. The InP devices also showed the identical peak spectral positions. THz emission frequency of both devices is 3.48 THz well corresponding to the frequency difference of the mid-IR pumps. Figure 11B shows the mid-IR light-current-voltage characteristics of the best performing InP and Si devices with the identical dimensions (22-μm-wide width and 4.2-mm-long cavity length) for comparison. Both devices show nearly the same threshold current of 4.5 A for the short wavelength pump, while the long wavelength pump of the Si device starts lasing at 6.5 A. Increased bias voltage in the Si device is likely due to the reduced thickness of the current injection layer during InP substrate wet-etching, which can be overcome by using a thicker current injection layer.
![Figure 11: Device performance of the DFG-QCL on a HR-FZ Si substrate.(A) The emission spectra of the DFG-QCL on the HR-FZ Si substrate. All measurements were performed at 20°C under pulsed operation with 40-ns current pulses at 15-kHz repetition rate. (B) Light-current-voltage of the SI InP (left panel) and HR-FZ Si (right panel) devices. (C) THz peak power and mid-IR-to-THz conversion efficiency of the SI InP (open symbol) and HR-FZ Si (closed symbol) devices [59].](/document/doi/10.1515/nanoph-2018-0093/asset/graphic/j_nanoph-2018-0093_fig_011.jpg)
Device performance of the DFG-QCL on a HR-FZ Si substrate.
(A) The emission spectra of the DFG-QCL on the HR-FZ Si substrate. All measurements were performed at 20°C under pulsed operation with 40-ns current pulses at 15-kHz repetition rate. (B) Light-current-voltage of the SI InP (left panel) and HR-FZ Si (right panel) devices. (C) THz peak power and mid-IR-to-THz conversion efficiency of the SI InP (open symbol) and HR-FZ Si (closed symbol) devices [59].
THz peak power and the mid-IR-to-THz conversion efficiency of both devices are plotted in Figure 11C. THz power of the reference InP device is as high as 50 μW with the conversion efficiency of 60 μW/W2, while that of the Si device produces 270 μW with the efficiency of 480 μW/W2 at the maximum bias current, resulting in a factor of 5 improvement in THz power and a factor of 8 improvement in the conversion efficiency. The power improvement is in excellent agreement with the simulation result, as estimated in Figure 9C. The THz power ratio of the Si device to the InP device was maintained over the measured bias current range.
4 CW operation
4.1 CW THz DFG-QCLs
CW operation at room temperature is a crucially important target to be accomplished for all semiconductor light sources. Achieving room-temperature CW operation in THz DFG-QCLs is challenging because of its high threshold current density as well as high thermal resistance, caused by the adoption of a side current injection scheme for the Cherenkov devices with SI InP substrates [30]. Nevertheless, room-temperature CW operation of THz DFG-QCL has been demonstrated. Initial reports used DFG-QCLs with buried heterostructure waveguides that were epi-down mounted on a diamond heat sink [42]. In this section, we discuss CW THz DFG-QCL devices that operate in an episide-up configuration and that avoids the complexity of the epi-down mounting. Our CW THz DFG-QCL was based on a DAU active region emitting at λ~6.8 μm [41]. The implementation of THz DFG-QCLs with a relatively short wavelength DAU active region that exhibits very low threshold current density [52] enabled room-temperature CW operation without complicated epi-down mounting. Single-mode THz emission at 2.6 THz with CW THz power output of 0.6 μW and THz threshold current density of 1.3 kA/cm2 was obtained at room temperature.
The conduction-band diagram of the injector/active/injector parts of the QCL heterostructure is shown in Figure 12. The heterostructure is made of strain-balanced In0.6Ga0.4As/In0.44Al0.56As layers. The active region is based on the DAU design in which the transitions take place from two anti-crossed upper states to multiple lower states and many transition channels lead to a broad-gain spectrum, as discussed in details in Section 2. The emission wavelength was chosen to be ~6.8 μm as mid-IR QCLs have shown better device performance owing to a smaller value of internal absorption as well as a higher gain coefficient [52]. Several triplets of states involved in the optical resonance were designed to obtain χ(2) in the ~6.8-μm DAU active region and the estimated nonlinearity at 3 THz is |χ(2)|=7.8 nm/V. This value is significantly smaller than the value obtained for our previous ~11 μm DAU active region presented in Section 2, which mainly results from the low population inversion carrier density [Δn, see Eq. (5)] due to the low threshold gain in the short-wavelength device, as well as smaller values of the dipole matrix elements between the subbands involved in the nonlinear mixing process.
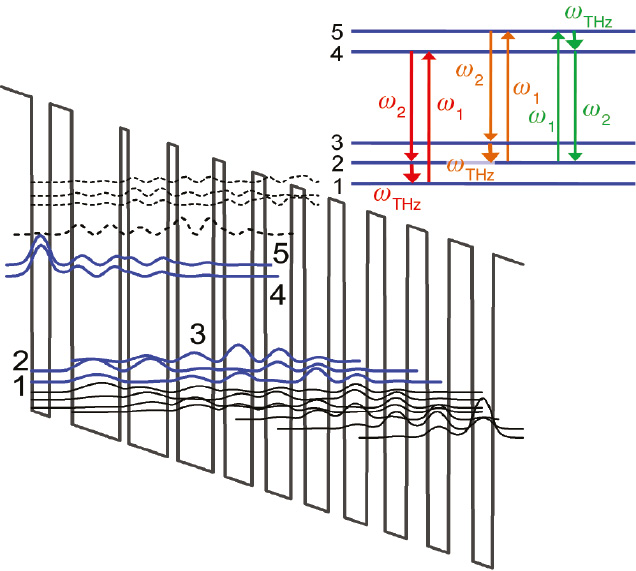
Schematic conduction band diagram and moduli squared of the relevant wave functions of the injector/active/injector parts in the active region.
The strain-balanced In0.6Ga0.4As/In0.44Al0.56As layer sequence of one period of the active layers, in angstroms, starting from the injection barrier (towards the right side) is as follows: 37/24/26/60/9/49/11/45/12/36/15/32/16/30/18/29/21/28/24/27/28/26, where the InAlAs barrier layers are in bold, InGaAs QW layers are in Roman, and doped layers (Si, 1×1017 cm−3) are underlined. Schematic description of the DFG process for the dual-upper-state active region is also shown in the inset.
The waveguide core in our CW devices consisted of identical DAU active regions with 40 cascade stages. All layers were grown with nearly identical thicknesses and doping levels to the λ~11-μm DAU device discussed in Section 2, except for the active region that is based on the strain compensated InGaAs/InAlAs with a sheet doping density of 1.0×1011 cm−2 in each QCL stage. Two separate buried grating sections were defined for the two-wavelength emission and etched into the upper n-In0.53Ga0.47As guide layers. The grating coupling coefficient κ was calculated to be ~25 cm−1 for both mid-IR pumps. The wafer was etched to form 12-μm-wide ridge waveguides and buried with a SI InP (Fe-doped) layer.
For CW THz power measurements, a 12-μm-wide, 3-mm-long device was modulated with a low-frequency pulse (quasi-CW, 25-ms pulse width and 20-Hz repetition rate) to be compatible with the response time of a helium-cooled silicon bolometer. The inset in Figure 13A shows maximum average power as a function of duty cycle at three different temperatures, −30°C, 0°C, and 20°C. The average powers consistently increase at low duty cycles and start saturating at duty cycle above 40%. The maximum average powers of 4.1 μW at −30°C, 2.2 μW at 0°C, and 1.2 μW at 20°C were obtained at a duty cycle of 35%. The CW current-light output (I-L) characteristics for mid-IR and THz signals at room temperature are shown in Figure 13A. For mid-IR pumps, the DFB device exhibited total output power of 85 mW with a threshold current density of ~0.9 kA/cm2 and ~1.3 kA/cm2 for the long and short pump wavelengths, respectively. A prominent kink at the current of ~0.47 A in the I-L curve may be attributed to the transition from single wavelength operation to dual wavelength operation. For THz signal, the DFB device showed THz output power of 0.61 μW with conversion efficiency of 0.35 mW/W2. The threshold current density for THz light was obtained to be as low as, Jth~1.3 kA/cm2, which corresponds to the Jth of the short pump wavelength. We estimate that the threshold input power for THz emission is only ~5.9 W, nearly half power compared to that of the previously reported CW DFG-QCLs [37], which allows for the CW operation without the epi-down mounting configuration. Figure 13B is the CW lasing mid-IR and THz spectra measured at DC bias current of 0.54 A without any modulations. Single-mode operation at λ~6.4 μm and λ~6.8 μm with a frequency spacing of 2.8 THz was observed. The frequency of the single-mode THz spectrum was in good agreement with the spacing of the mid-IR pump spectra.
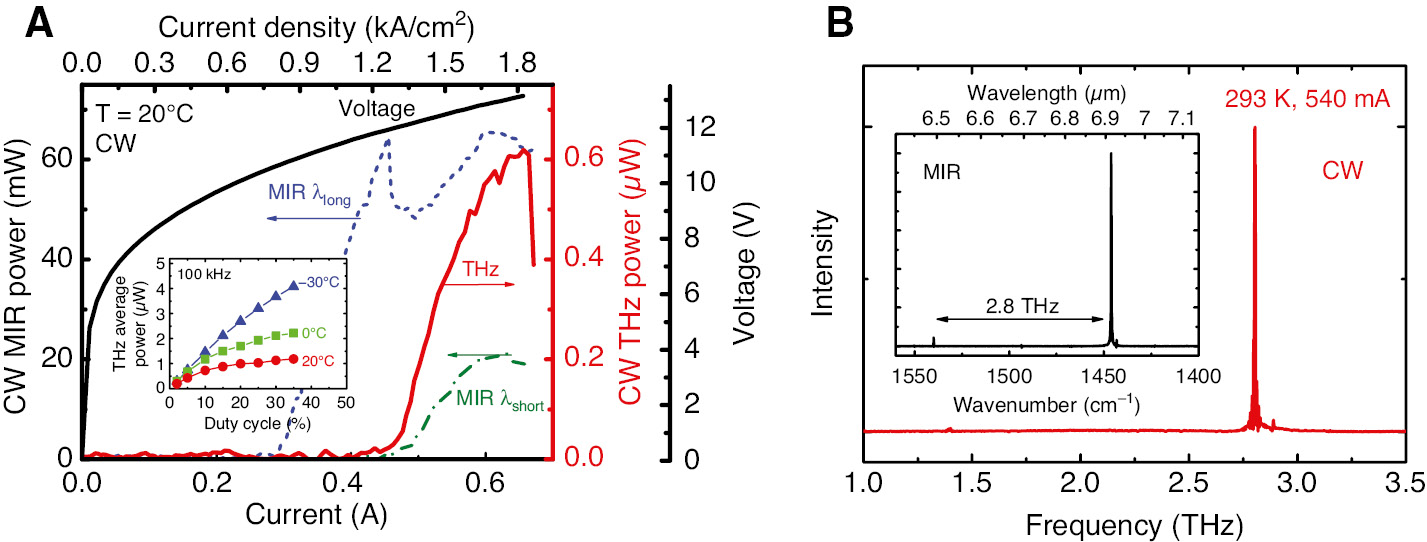
Room temperature CW performance of the CW THz DFG-QCL.
(A) Room-temperature current-voltage-light (I-V-L) output characteristics of the mid-IR (dashed lines, bottom and left axis) and THz emission (solid red line, bottom and right axis) measured in the CW mode. Inset: average power as a function of the duty cycle. (B) Room-temperature CW THz emission spectrum, taken at a current of 0.54 A. The inset shows room-temperature mid-IR emission spectrum of the device in the CW mode.
4.2 Broadband emission from CW THz DFG-QCLs
The single-mode THz CW device with the DAU active region (λ~6.8 μm) presented in the previous section can also operate in the CW multi-mode regime by using the broadband device concept described in Section 2 [60]. The CW multimode operation is especially of great interest due to the potential generation of THz frequency comb by generating mid-IR frequency comb via four-wave mixing and down-converting the mid-IR comb into THz band via DFG process within the same active region of a DFG-QCL, which could result in a monolithic room-temperature THz frequency-comb source.
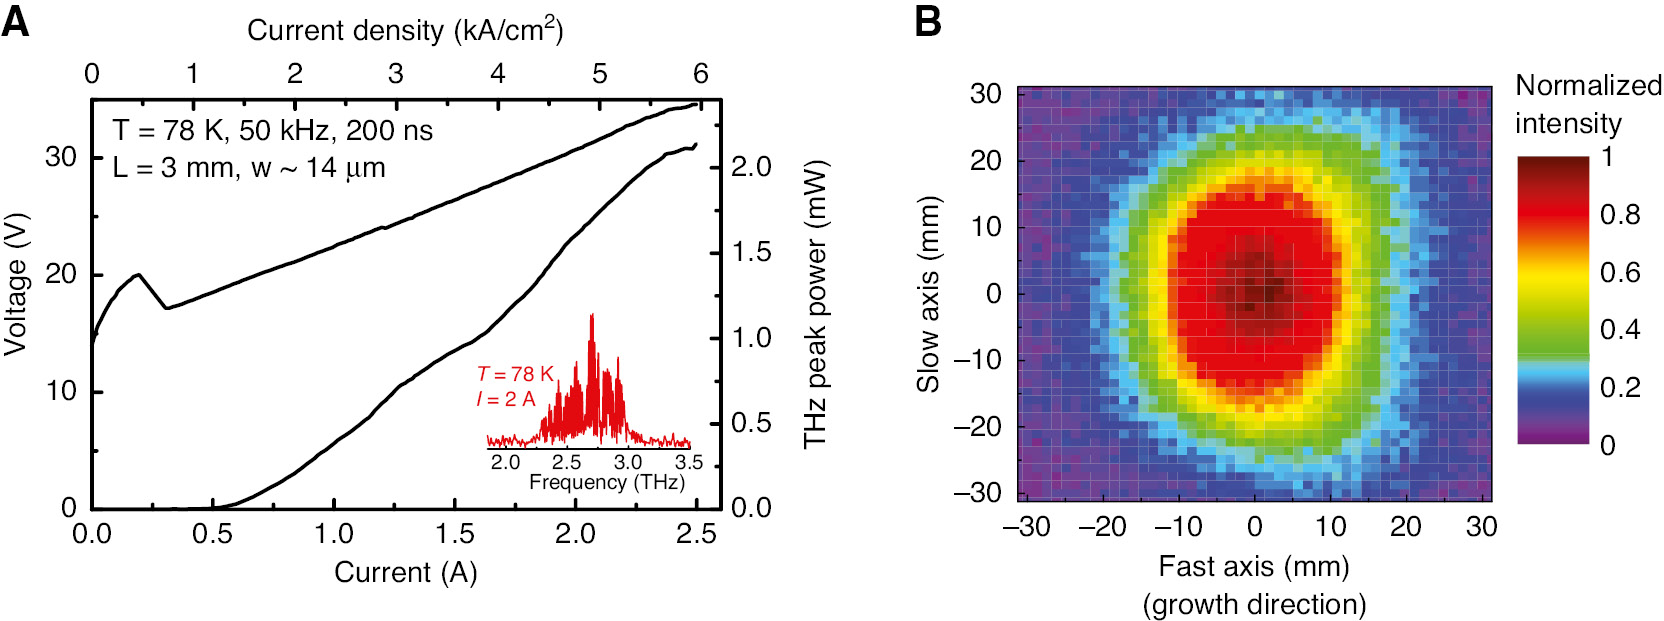
In order to achieve broadband CW THz emission, we essentially implement the same approach used in the pulsed THz multimode device with a highly detuned DFB line from the gain peak in which both a single-mode DFB line and a group of FP modes interact with each other to produce THz light. The CW current-light output (I-L) characteristics for mid-IR and THz signals for a 12-μm-wide, 3-mm-long device measured at 78 K are shown in Figure 14A. The DFG-QCL exhibits mid-IR CW power of 1.07 W (combined power of the mid-IR FP and DFB pumps) and CW power of over 20 μW, despite producing a broadband spectrum (Figure 14D). First, the DFB mode lases at λDFB=6.3 μm, and then the FP emission is observed at around λFP~6.7 μm, as shown in Figure 14B. Threshold current densities for DFB and FP emissions are 0.46 kA/cm2 for λDFB and 0.78 kA/cm2 for λFP. The bandwidth of the FP spectra broadens as the current increased, which is observed for most of the measured samples, and seems to be attributable to a broad gain bandwidth of the DAU active region. Figure 14B depicts the temperature dependence of THz CW I-L characteristics in the temperature range of 78–260 K. It shows THz output power of approximately 20 μW at 78 K and 2 μW at 220 K. CW THz operation was observed up to 260 K. Figure 14C displays the THz emission spectrum of the DFB device at the current of 650 mA. At 78 K, the broadband emission extends from 1.6 THz to 3.5 THz, covering more than one octave with 124 modes. Our inspection shows that there is a slight difference between measured THz spectra and that expected from mid-IR spectra due presumably to combined effects of high THz absorption in the device, the frequency dependence of the DFG efficiency and optical nonlinearity, water absorption, and detector spectral response.
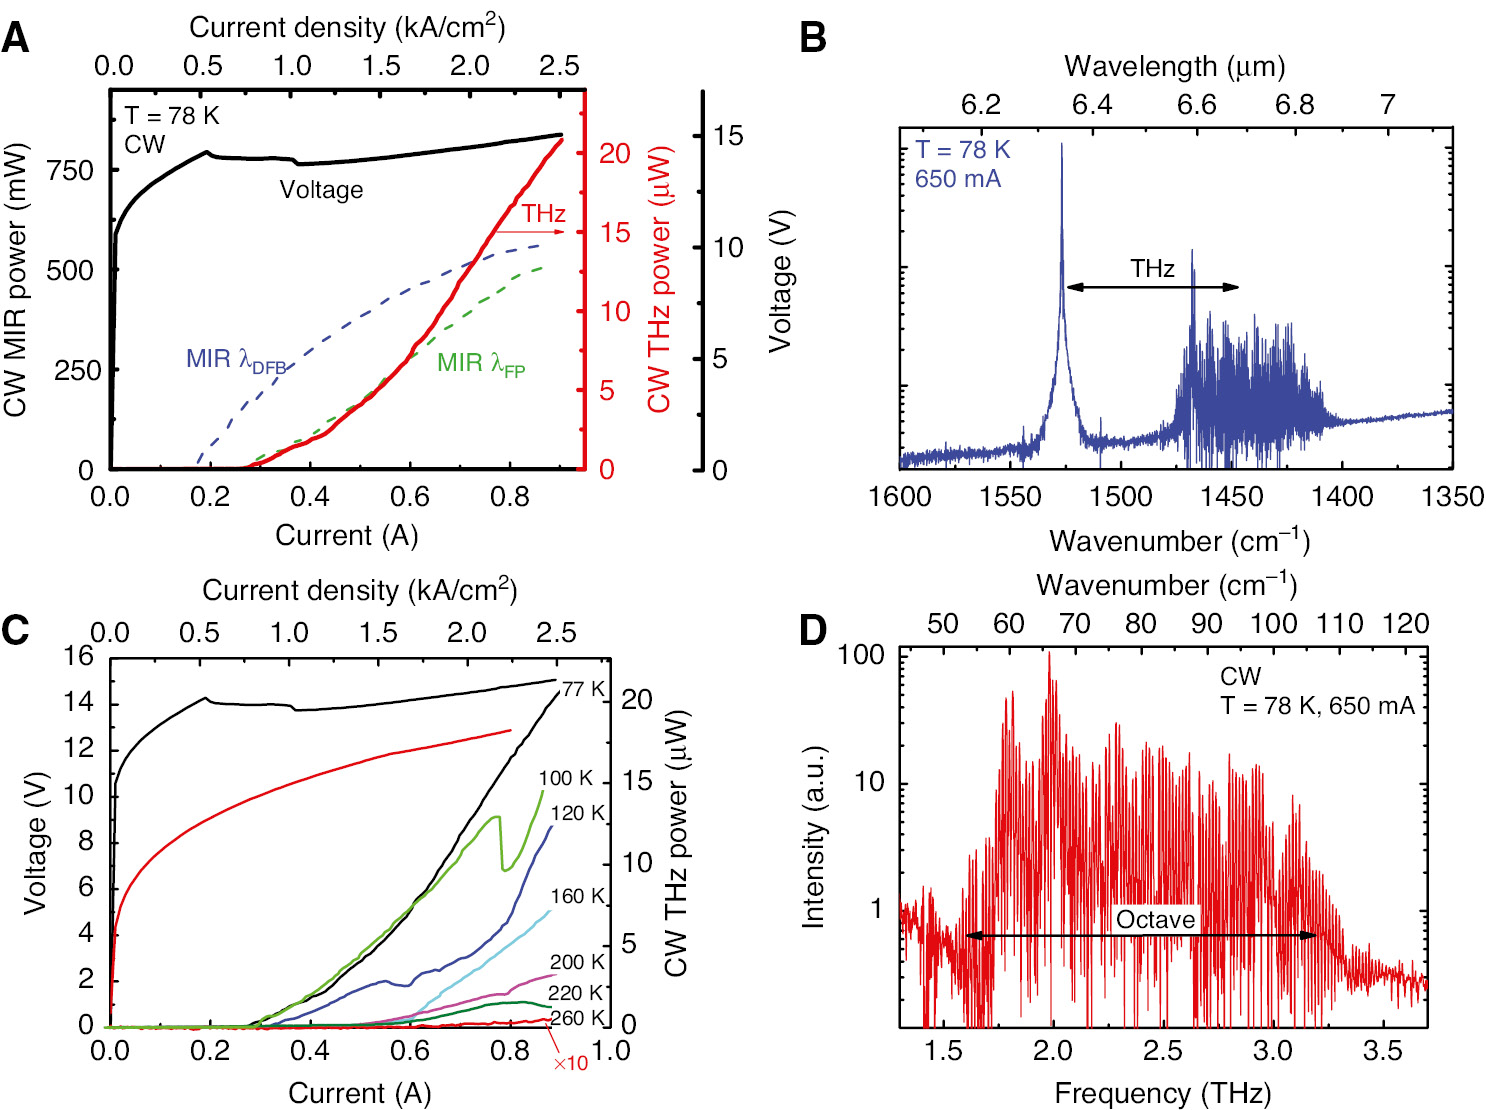
CW performance of a 3-mm-long, 12-μm-wide DFB/FP device for broadband THz emission.
(A) CW current-light characteristics of the mid-IR pump powers (dashed lines) and the THz emission (solid line). (B) Mid-IR spectrum measured with bias current of 650 mA at the heat sink temperature of 78 K. (C) THz output power measured at different heat sink temperatures. I-V curves measured at 78 and 260 K are also shown. (D) THz spectrum measured with bias current of 650 mA at the heat sink temperature of 78 K.
To characterize the spectral emission and its coherence, we performed beat-note measurement for the mid-IR FP modes. Although this method cannot directly evaluate THz comb operation, we investigate the spectral behavior of mid-IR FP modes for the potential generation of THz comb. The mid-IR beat-note signal of our free-running CW DFG-QCL was generated by inter-mode beating of the mid-IR FP modes having the mode spacing of ~15 GHz, estimated from the measurement result shown in Figure 14B. The setup of the measurement is similar to that described in Ref. [21], except for the point that we used a double ridge horn antenna (Agilent HP 11966E, the detection bandwidth between 1 GHz and 18 GHz), instead of a dipole antenna, for the electrical beat note measurement. The beat-note signal emitting through the cryostat window was collected by using the horn antenna attached to a microwave spectrum analyzer (HP 8593E) with the frequency range between 9 kHz and 21 GHz and the resolution bandwidth (RBW) between 30 Hz and 1 MHz. A highly stabilized low-noise current driver (Wavelength Electronics Model QCL 1500) was used to bias our DFG-QCL. The beat-note signal was amplified by using a preamplifier with an amplification gain of 40 dB and recorded in a single-sweep mode with the RBW of 30 kHz. Figure 15A plots the beat-note spectra at different currents. The beat-note spectra stay fairly narrow in the current range of 540–630 mA with a full width at half maximum (FWHM) of 30 kHz limited by the RBW, as shown in Figure 15B. To further evaluate the linewidth, high-resolution scans were performed with the RBW of 51 Hz and the span range of 100 kHz. Very narrow beat-note linewidth of 287 Hz at 15.1255 GHz was observed at 550 mA, as shown in Figure 15C, and such narrow beat-note linewidth indicates a well-defined phase (or inter-mode spacing) established within the mid-IR comb modes. The behavior of free-running beat note indicates frequency comb operation for mid-infrared FP spectra.
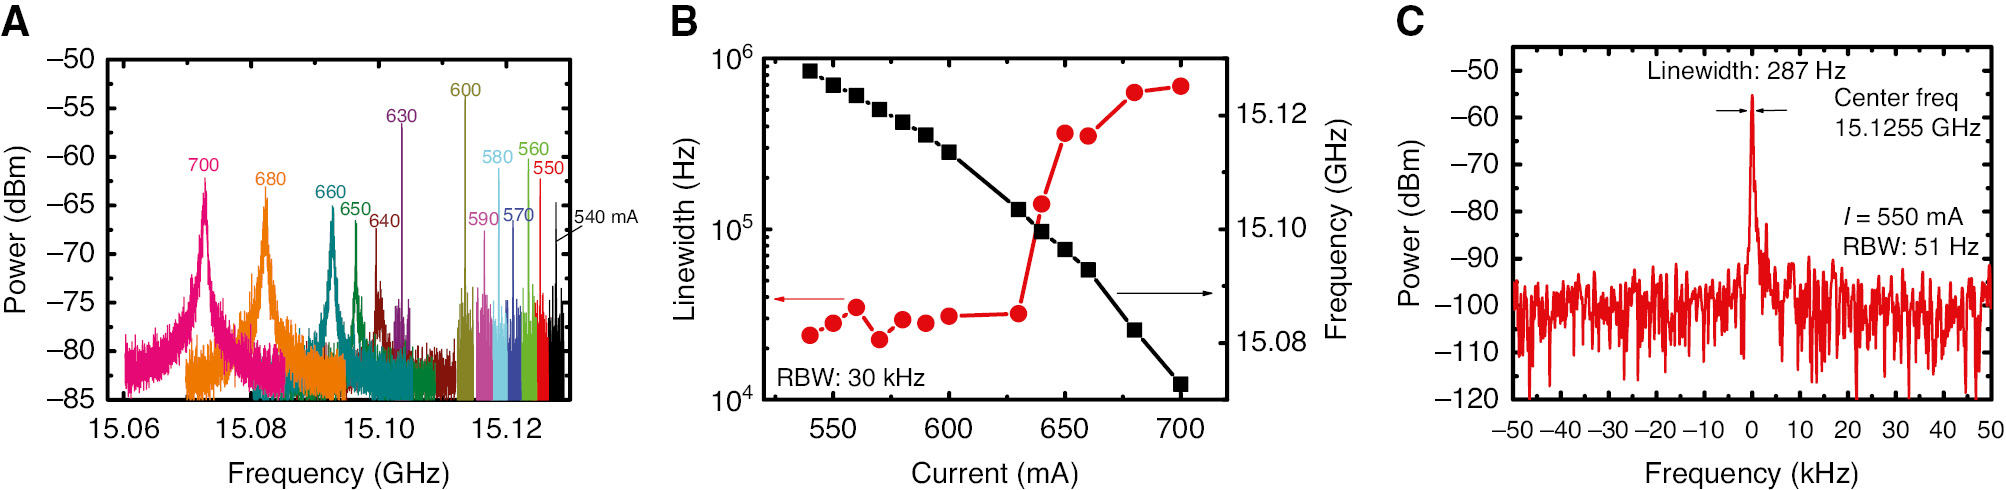
Frequency comb performance.
(A) Beat-note spectra of a 3-mm-long, 12-μm-wide, DFB/FP THz DFG-QCL biased with different currents at the heat sink temperature of 78 K. The currents are indicated on top of each spectrum. (B) Beat-note linewidth and frequency as functions of currents. (C) Beat-note spectrum measured with bias current of 550 mA at 78 K.
The ultra-broadband CW THz DFG-QCLs demonstrated here could become an ideal candidate for octave-spanning semiconductor-based THz frequency comb. Much broader spectral bandwidth could be obtained by engineering the mid-IR spectra as well as active region structures. Although THz QCL technologies have demonstrated comb operation and octave spanning emission, operating temperatures of such THz QCL comb devices are only below liquid-nitrogen temperature, Tmax<60 K [21], [22]. Thus, the realization of the ultra-broadband THz spectra from THz DFG-QCLs that potentially feature comb operation is a significant milestone towards semiconductor-based room-temperature comb sources. In fact, our ultra-broadband device has already operated at temperature of above 260 K in CW mode. By optimizing the device structure, room-temperature comb operation could be possible in the near future.
4.3 THz linewidth characterization
THz linewidth of a free-running DFG-QCL is characterized to address its potential use in high precision measurements such as heterodyne spectroscopy [61]. The THz linewidth of ~6 GHz (0.2 cm−1) of THz DFG-QCLs reported in the literatures [29], [62] is limited by the optical resolution of a Fourier-transform infrared spectrometer. To characterize THz linewidth of our DFG-QCL, a heterodyne-detection system is used to measure a beat note between THz emission of a free-running DFG-QCL and a reference comb tooth of a free-space THz frequency comb synthesizer (FCS).
Our DFG-QCL used for the THz linewidth characterization is designed to operate under CW mode. The devices were fabricated as 2-mm-long 12-μm-wide buried heterostructure lasers with dual-wavelength mixed gratings integrated along the laser cavity. The gratings were designed to select the wavelengths of the mid-IR pumps at 8.47 μm and 9.11 μm to target THz DFG emission near 2.5 THz, to be within the optical bandwidth of the hot electron bolometer (HEB) used in the heterodyne-detection system. Figure 16A shows the mid-IR spectra of our DFG-QCL operating under CW mode at the heat sink temperature of 85 K. Above the bias current of 400 mA, another mode near 1185 cm−1 appeared so that two THz emission lines at 2.49 THz and 2.58 THz were observed. The maximum CW THz power of 0.5 μW was obtained at 0.55 A at the same heat sink temperature shown in Figure 16B.
![Figure 16: Emission spectra and power output of the DFG-QCL.(A) Mid-IR spectra of the DFG-QCL operating under CW mode at the heat sink temperature of 85 K. (B) Light-current-voltage characteristics of the DFG-QCL operating under CW mode at the heat sink temperature of 85 K. THz power was measured under quasi-CW mode with 500-Hz repetition frequency and 1-ms pulse width for requirement of a gating frequency for the Si bolometer [61].](/document/doi/10.1515/nanoph-2018-0093/asset/graphic/j_nanoph-2018-0093_fig_016.jpg)
Emission spectra and power output of the DFG-QCL.
(A) Mid-IR spectra of the DFG-QCL operating under CW mode at the heat sink temperature of 85 K. (B) Light-current-voltage characteristics of the DFG-QCL operating under CW mode at the heat sink temperature of 85 K. THz power was measured under quasi-CW mode with 500-Hz repetition frequency and 1-ms pulse width for requirement of a gating frequency for the Si bolometer [61].
The schematic of the heterodyne measurement setup is shown in Figure 17A. The FSC is generated in a MgO-doped lithium niobate waveguide using a femtosecond mode-locked fiber laser emitting around 1.5 μm at a repetition rate adjustable to ~250 MHz. The HEB has the optical bandwidth of 2.5 THz and the electrical bandwidth of 250 MHz. Off-axis parabolic mirrors collect and collimate the THz DFG-QCL and reference THz comb beams. To generate beat notes, a THz beam splitter made of a mylar film is placed at the optical path where two beams intersect. The beat note further induces the HEB electrical that is sent to a fast Fourier transform spectrum analyzer. Within its bandwidth, the HEB can detect both the signal at 250 MHz, generated by the intermodal beating of the THz comb, and the pair of beat notes between the THz DFG-QCL emission line and the closest neighboring comb teeth.
![Figure 17: Experimental setup for THz linewidth measurement.(A) Schematic diagram of the heterodyne-detection measurement setup. (B) Typical beat-note spectrum obtained from our DFG-QCL for the integration time of 2 ms [61].](/document/doi/10.1515/nanoph-2018-0093/asset/graphic/j_nanoph-2018-0093_fig_017.jpg)
Experimental setup for THz linewidth measurement.
(A) Schematic diagram of the heterodyne-detection measurement setup. (B) Typical beat-note spectrum obtained from our DFG-QCL for the integration time of 2 ms [61].
Figure 17B shows the measured beat note between the THz DFG-QCL and FSC comb emission lines. The linewidth of the referencing THz comb involved in the beating process is ~130 Hz at 1-s integration time [63], [64], which is considerably narrower than the linewidth of the measured beat note. Therefore, we reasonably assume that the beat-note linewidth represents the THz emission linewidth of the DFG-QCL. We measured the beat notes at various integration times ranging from 20 μs to 2 ms of the spectrum analyzer where logarithmic broadening of the beat notes is observed as the integration time increases. The logarithmic dependence of the linewidth indicates that the flicker (1/f) noise that limits the linewidth of mid-IR QCLs [65] is also the major noise component of THz linewidth in DFG-QCLs [61]. Using a Gaussian fitting to the beat note, we estimate the THz emission linewidth of 125 kHz limited by the RBW (100 kHz) of the spectral analyzer for the shortest integration time of 20 μs corresponding to the acquisition time of the single FFT spectrum in the spectrum analyzer [61].
5 Tunable THz DFG-QCLs
Single-mode broad tunability of THz DFG-QCLs makes these sources highly favorable for a variety of THz applications. THz tuning of DFG-QCLs requires tuning mid-IR pump frequencies. Mid-IR pumps can be in general tuned by using an EC system or a monolithic architecture. Advantages of the EC system include unprecedented tuning range and reduced device fabrication effort to make dual single-mode operation in DFG-QCLs. In fact, “dual” single-mode operation demands careful selection of wavelength positions with respect to the gain bandwidth and careful balancing of two coupling coefficients for the two mid-IR pumps. When such balance is not perfect, the laser often ends up with operation of only one mid-IR pump or with a very limited dynamic range for dual-color mid-IR lasing. This problem is significantly relaxed in the EC DFG-QCL system as the feedback for one or even both of the mid-IR pumps can be controlled by the external optics. On the other hand, the monolithic tuner can offer superior compactness and reliability as it does not require external optics and moving parts. Monolithic sources are also amenable to low-cost mass production, which may not be easily obtained from the EC system that requires external optics alignment and has moving parts.
5.1 External cavity tuner
Our EC system, as shown in Figure 18A, employs the Littrow-type configuration where an external grating provides optical feedback of the first-order diffraction beam coupled into a QCL gain chip [66]. Lasing wavelength can be tuned by changing the angle of incident laser beam from the QCL with respect to the grating surface. To implement the Littrow-type configuration for THz radiation tuning in our DFG-QCLs, we fix one pump wavelength by a DFB grating etched into the QCL waveguide and the other pump wavelength is selected by the external grating [32]. Optical components used in our EC system include an aspheric anti-reflection (AR)-coated collimating lens, gold diffraction grating, and computer-controlled rotation stage. Both mid-IR and THz emissions were collected from the front facets of QCL chips. It should be noted that the DFB grating could be replaced with another external grating to realize the dual EC system, which provides enormous advantages in device fabrication and optimization of the DFG-QCLs, as described in Ref. [62].
![Figure 18: EC DFG-QCL.(A) Schematic of the Littrow-type EC DFG-QCL system. (B) Mid-IR spectra and power output of the two mid-IR pumps measured at different EC grating orientations. The QCL was biased at a current density of 8.0 kA/cm−2. Blue circles and red triangles indicate powers of the DFB mode ω1 and the EC mode ω2, respectively, as a function of ω2 pump wavenumber. The dashed line shows the transmission of the mid-IR long-pass filter used in power measurements. (C) The mid-IR to THz conversion efficiency (red circles) and THz power (blue squares) as a function of THz frequency. (Bottom panel) THz emission spectra of the THz EC DFG-QCL system measured at different EC grating angles. The QCL was biased at a current density of 8.0 kA/cm2 [32], [35].](/document/doi/10.1515/nanoph-2018-0093/asset/graphic/j_nanoph-2018-0093_fig_018.jpg)
EC DFG-QCL.
(A) Schematic of the Littrow-type EC DFG-QCL system. (B) Mid-IR spectra and power output of the two mid-IR pumps measured at different EC grating orientations. The QCL was biased at a current density of 8.0 kA/cm−2. Blue circles and red triangles indicate powers of the DFB mode ω1 and the EC mode ω2, respectively, as a function of ω2 pump wavenumber. The dashed line shows the transmission of the mid-IR long-pass filter used in power measurements. (C) The mid-IR to THz conversion efficiency (red circles) and THz power (blue squares) as a function of THz frequency. (Bottom panel) THz emission spectra of the THz EC DFG-QCL system measured at different EC grating angles. The QCL was biased at a current density of 8.0 kA/cm2 [32], [35].
Wide tunability of EC DFG-QCLs requires broad mid-IR active region gain bandwidth and suppression of FP lasing of the QCL chip. Utilizing the BTC active region design that demonstrated wide gain bandwidth with high gain ensures an extended tuning range without significant penalty in output power [3], [66], [67]. We used two stacks of the BTC active regions, resulting in FWHM of the laser gain of 280 cm−1, as estimated from electroluminescence emission from circular mesa structures processed from the same wafer. To suppress mid-IR FP modes, an AR coating is deposited at the back facet of the QCL chip. A pair of 650-nm-thick YF3 and 360-nm-thick ZnSe layers has been deposited using an electron beam evaporator, resulting in an estimated facet reflectivity of 1.5% near 1080 cm−1.
Experimental results obtained from the EC DFG-QCL system with a 22-μm-wide, 2.3-mm-long, back facet AR-coated, ridge waveguide laser chip are shown in Figure 18B and C. The laser chip had a 1.6-mm-long DFB grating section to select the emission frequency of one of the mid-IR pumps. The grating section length was determined to provide proper coupling strength to the DFB emission line so that a stable dual-color operation of the device over a broad tuning range can be achieved. The front facet of the device was polished at a 30° angle for outcoupling Cherenkov emission. Figure 18B shows the mid-IR emission spectra and power output of the two mid-IR pumps at different EC grating positions at a fixed current density of 8.0 kA/cm2. A long-pass filter was used to spectrally separate the two mid-IR pumps, and the power outputs in Figure 18B are calibrated based on the filter transmission. The mid-IR spectra taken for different EC grating orientation show that DFB pump ω1 stays at 963 cm−1, while the EC pump ω2 is tuned continuously from 1009 cm−1 to 1182 cm−1, resulting in the THz tuning of 4.5 THz (from 1.4 THz to 5.9 THz). As the EC pump ω2 is tuned towards the DFB pump ω1, the mid-IR emission switches from the dual-frequency (ω1 and ω2) operation to the single-frequency (ω1) operation. Figure 18B also shows that output power of the DFB pump ω1 increases as the EC pump ω2 power decreases due to detuning from the gain center of the device active region. These characteristics indicate gain competition between the mid-IR pumps [68].
Figure 18C shows THz emission spectra, peak power, and mid-IR-to-THz conversion efficiency at different external grating angles with respect to the DFG-QCL device biased at a current density of 8.0 kA/cm2. THz peak power of 90 μW and mid-IR-to-THz conversion efficiency of ηconv=250 μW/W2 were obtained at 3.8 THz. The conversion efficiency peaks near 3.7–4.5 THz and gradually falls off at both ends of the tuning curve. On the high-frequency end, the efficiency of THz generation is limited by the onset of high optical loss in InGaAs/AlInAs/InP materials due to tails of LO-phonon absorption bands (Reststrahlen band). On the low-frequency end, the efficiency is primarily limited by the ωTHz2 dependence of the DFG efficiency [32], [69].
5.2 Monolithic tuner
Compared to the EC tuners, monolithic THz DFG-QCL tuners are more suitable for compact and portable systems as they do not require moving parts, external optics, and complicated optical alignment [33], [35]. In addition, the monolithic tuner can be constructed as an on-chip array system where a THz tuning range comparable to that of the EC system can be achieved [36]. A schematic design of our monolithic tuner is shown in Figure 19A. Our device consists of two grating sections that provide optical feedbacks to mid-IR pumps and a gap section that separates the grating sections for electrical isolation to minimize thermal cross-talk. As the DC bias of each grating section increases the device heating, the effective refractive index of each grating becomes larger so that we expect the red-shift of both mid-IR pumps. However, THz emission is expected to red- or blue-shift as its spectral shift relies on the frequency difference of the mid-IR pumps. For example, THz emission will blue-shift (red-shift) when low (high) mid-IR frequency red-shifts.
![Figure 19: Monolithic tunable THz DFG-QCL.(A) Schematic of the monolithic tunable THz DFG-QCL, illustrating the front DFB section for the short wavelength (ω1) mode selection and the back DBR section for the long wavelength (ω2) mode selection. LDBR indicates the effective cavity length for the DBR mode. (B) THz spectra measured at various DC biases applied to the DFB section (the first four peaks from the left show in red) and to the DBR section (14 peaks on the right side shown in blue) in reference to the THz emission at zero DC current (the fifth peak from the left shown in black). (C) Details of THz emission tuning as a function of DC current applied to either DFB or DBR section. Open squares are THz emission frequencies calculated from the frequencies of mid-IR pumps. Filled red circles are experimentally measured positions of THz emission frequencies as shown in (B) [33], [59].](/document/doi/10.1515/nanoph-2018-0093/asset/graphic/j_nanoph-2018-0093_fig_019.jpg)
Monolithic tunable THz DFG-QCL.
(A) Schematic of the monolithic tunable THz DFG-QCL, illustrating the front DFB section for the short wavelength (ω1) mode selection and the back DBR section for the long wavelength (ω2) mode selection. LDBR indicates the effective cavity length for the DBR mode. (B) THz spectra measured at various DC biases applied to the DFB section (the first four peaks from the left show in red) and to the DBR section (14 peaks on the right side shown in blue) in reference to the THz emission at zero DC current (the fifth peak from the left shown in black). (C) Details of THz emission tuning as a function of DC current applied to either DFB or DBR section. Open squares are THz emission frequencies calculated from the frequencies of mid-IR pumps. Filled red circles are experimentally measured positions of THz emission frequencies as shown in (B) [33], [59].
Our device employs the surface grating structure to provide a feedback for single-mode operation. After several iterations of modal grating simulations performed using COMSOL, the optimal grating etch depth is determined to be 170 nm at which the grating coupling coefficient of 25 cm−1 is obtained for both mid-IR pumps. The grating periods were selected to provide THz emission at 3.5 THz, where the best performance of DFG-QCLs is currently achieved. We fabricated 2.7-mm-long ridge waveguide devices with 22-mm ridge width. The lasers had two 1.2-mm-long grating sections separated by a 300-mm gap.
Dual single-mode mid-IR lasing at ω1=1056 cm−1 and ω2=937 cm−1 was observed by applying a pulsed bias only to the front section, and no DC bias was applied to the device. In this case, the front-grating section operates as DFB grating, and the back-grating section, as distributed Bragg reflector (DBR) grating. Both spectral positions were in excellent agreement with the designed wavelength positions for the DFB and the DBR gratings. Dual single-mode operation was observed up to the front section current of 1.6×Ith (where Ith is threshold current for the same setup). When the front section is pumped above 1.6×Ith, additional FP modes start lasing near 1000 cm−1.
Wavelength tuning of the device was achieved by applying DC bias either to the front section or to the back section. For the tuning of the DBR mode (ω2), the front DFB section was biased at fixed pulse current (50 kHz, 50 ns, I=1.3×Ith) and the back DBR section was biased only with DC current below lasing threshold. As DC bias increased, the DBR mode was significantly red-shifted with the total DBR tuning of 17 cm−1 for the DC bias varying in the range of 0–600 mA. A residual red-shift of the front DFB mode was also observed in this configuration primarily due to thermal cross-talk across the grating sections [32], [34]. For tuning of the DFB mode (ω1), the front section was biased simultaneously with pulsed and DC currents using a bias tee. In this case, the DFB mode was red-shifted with the total DFB tuning of 7 cm−1 with the DC bias varying in the range of 0–250 mA. As DC current to either section further increased, the power output was quenched due to excessive heating.
Room-temperature THz emission spectra of the device for different DC currents are shown in Figure 19B. As expected, THz emission shifts opposite directions dependent on the grating section biased with DC current. When DC bias is applied to the front DFB section, the red-shifted high mid-IR frequency, ω1, decreases the difference between the two mid-IR pumps, leading to the red-shift of the THz emission. When DC bias is applied to the back DBR section, the red-shifted low mid-IR frequency, ω2, increases the difference between the two mid-IR pumps, leading to the blue-shift of the THz emission. The total tuning range of the device was 580 GHz, 180 GHz red-shift, and 400 GHz blue-shift, as shown in Figure 19B. Side mode suppression ratio of more than 20 dB with narrow linewidth of 10 GHz, limited by a FTIR resolution, was obtained. Figure 19C shows that the peak spectral positions of THz emission at different DC bias currents are perfectly matched with the estimated THz spectral positions based on the mid-IR pump tuning. Fine tuning of THz emission to fill the periodic spectral gap caused by mode hopping of the mid-IR pump was achieved by applying DC bias to both the front DFB and back DBR sections at the same time.
6 Applications
There are many applications for coherent THz sources, including medical imaging, security screening, heterodyne receivers, spectroscopy, and trace gas detection [70], [71]. The work on THz imaging technology based on a THz-QCL has been performed widely in two-dimensional (2D) imaging with a raster-scanning method [72], [73], [74], 3D imaging [75], real-time imaging with a microbolometer focal-plane array [76], [77], [78], and imaging by self-mixing [79], [80]. Although device performances of THz DFG-QCLs have significantly been improved, potential use of THz DFG-QCLs in those applications has not been addressed so far. As THz DFG-QCLs have shown a better THz far-field pattern [29], compared to that of THz-QCLs with metal-metal waveguide [12], [81], these devices could be suitable for non-destructive inspection and quality control [70]. Here, we present THz non-destructive imaging with a THz DFG-QCL. We performed THz imaging experiments with a broadband THz DFG-QCL device using a DFB/FP configuration operated in pulsed current mode (1% duty cycle at 50-kHz repetition rate) at 78 K in order to obtain high THz peak output power. The THz light-current characteristic measured with the DFB/FP device is shown in Figure 20A. The device provides THz peak power of 2.1 mW, which is the highest value ever reported from THz DFG-QCLs, and the THz emission spans from 2.2 to 3.1 THz. We note that this device is capable to produce average power of more than 100 μW at higher duty cycles, and the power was measurable with a thermopile detector (Ophir: 3A-P-THz).
Performance of THz DFG-QCL operated at 78 K for terahertz imaging.
(A) Current-light output characteristics of the THz emission of a 3-mm-long, 14-μm-wide DFB/FP device measured at 78 K, and voltage (left axis) versus current density. (B) The 2D far-field intensity profile of the device shown in (A).
To map the 2D far-field emission patterns of the devices, we used a setup consisting of two motorized XY translation stages. A Golay-cell detector was mounted on the translation stage and placed about 5.9 cm away from the device to scan laser beam profiles along the emission plane. Our measurements were performed with a resolution of 1.25 mm. Figure 20B shows a THz beam pattern of our device operating with 1% duty cycle at 100-kHz repetition rate at 78 K. We estimate the beam FWHM values of 37.2 mm along the slow axis (perpendicular to the epi-growth direction) and 25 mm along the fast axis (parallel to the epi-growth direction); the corresponding divergence angles are 35° and 23.9°, respectively. The narrow FWHM along the fast axis is due to a large THz aperture corresponding to the thickness of the InP substrate (~350 μm). In edge-emitting metal-metal THz QCLs, ring-like fringe patterns in their far-field beam are frequently observed due to far-field interference of coherent radiation in deep sub-wavelength apertures [77]. In contrast, our DFG-QCL emitting THz light through the large substrate aperture shows the Gaussian-like beam pattern that is much favorable for THz imaging applications.
Our THz imaging setup is shown in Figure 21A. THz beam from our device is collimated with an off-axis parabolic mirror and focused onto a testing sample, made on a stainless-steel plate partially etched with letters of “HPK,” using an aspheric plastic lens (Tsurupica, Pax Co.). Then, the beam transmitted through the sample was collimated and focused into a Golay-cell detector by using another aspheric lens and parabolic mirror. The sample was placed in a paper envelope and then mounted on a computer-controlled two-axis translation stage to construct THz images by a raster-scanning method (100×180 pixels, a scan step of 200 μm along both horizontal and vertical directions) [72], [73], [74]. Sample images taken by a visible camera and by our THz imaging system with the DFG-QCL are shown in Figure 21B and C, respectively. The high-quality THz image confirms that our DFG-QCL showing good beam quality and high THz output power can be employed in various THz applications.
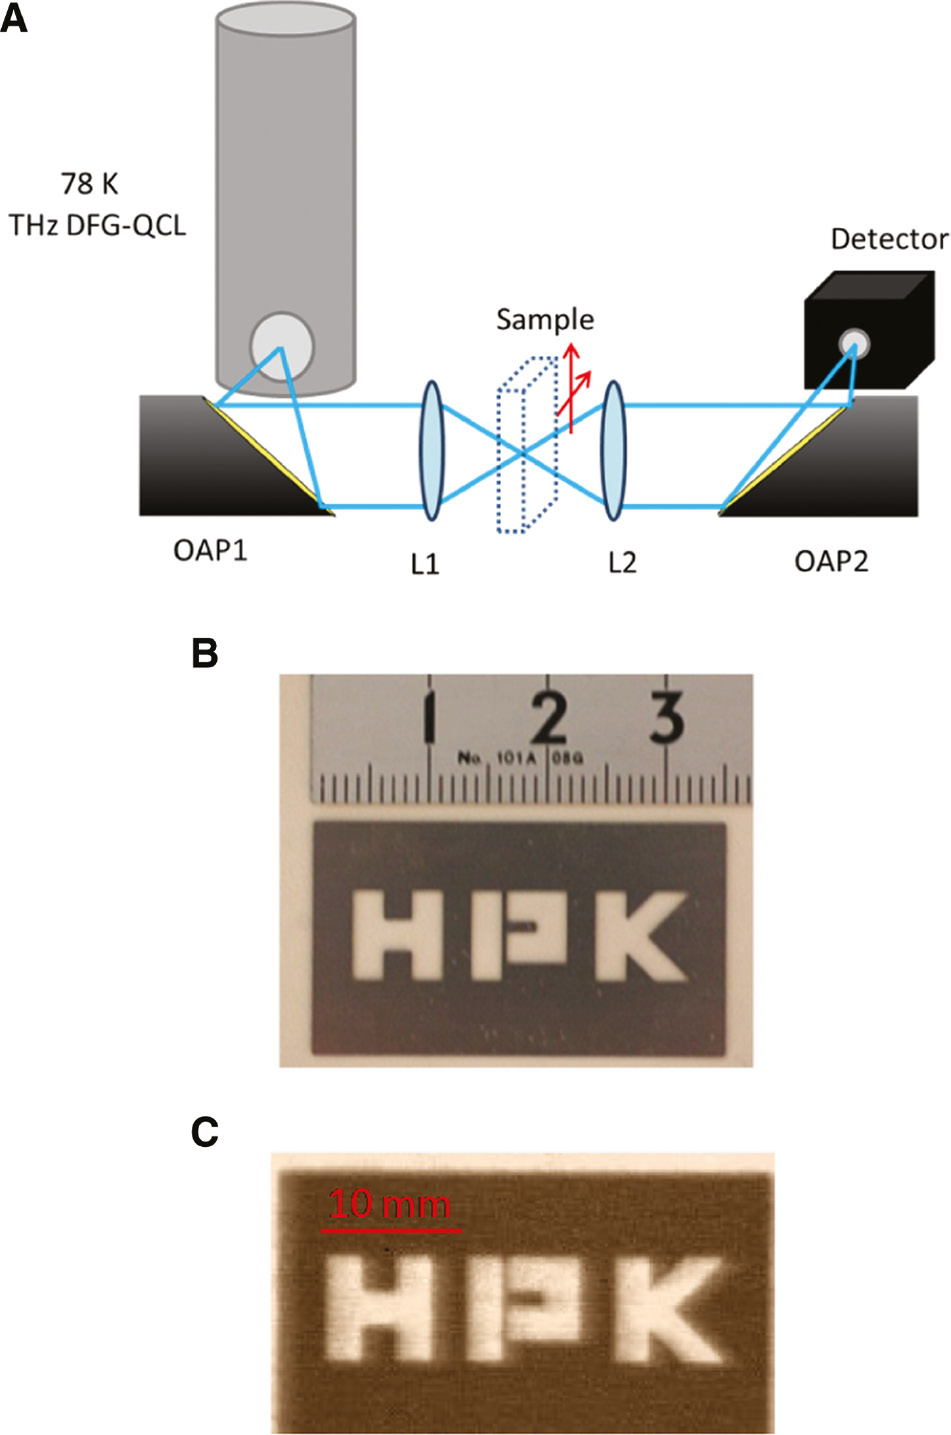
Terahertz imaging of the DFG-QCL.
(A) Schematic diagram of terahertz imaging system using a THz DFG-QCL operated at 78 K. (B) Photograph of stainless-steel plate with openings in the shape of the letters “HPK”. (C) Terahertz image of the stainless plate in paper envelope with THz DFG-QCL.
7 Future development
As discussed above, the performances of THz DFG-QCLs have been tremendously improved. A future challenge is to improve the WPE whose value is only ~0.7×10⁻⁵ at room temperature and 2.7×10⁻⁵ at 78 K (Figure 20A). So far, these results are achieved from the devices with the SI InP substrate where the THz outcoupling efficiency is below 10% of THz power generated in their active region. In order to comprehend the fundamental limit of THz generation in THz DFG-QCLs, photon-flux conversion efficiency is estimated by using the Manley-Rowe relations [69], as the energy difference between mid-IR and THz frequencies is significantly large (more than 100 meV). According to the Manley-Rowe relations, the nonlinear process in DFG-QCL described in Figure 3A,B, can be expressed as follows:
where Ii is intensity of optical waves. The equation shows that the rate at which photons at frequency ωTHz (and frequency ω2) are created is equal to the rate at which photons at frequency ω1 are annihilated. The device in Figure 7, which shows 0.3 mW of peak THz power as well as ~0.6×10⁻⁵ of the WPE at room temperature, generates photon flux of 1.5×10¹⁷ s−1 for THz power, ωTHz at 3 THz, while photon flux for each mid-IR pumps is estimated to be ~1.0×10¹⁹ s−1. The mid-IR-to-THz conversion efficiency for photon flux,
8 Conclusions
We reviewed recent developments on THz DFG-QCLs and reported new results for THz imaging using our THz DFG-QCL. As the first experimental demonstration of THz DFG-QCL in 2007, the THz output power output has risen drastically over the past decade, as shown in Figure 22, with frequencies spanning the entire terahertz range from 1 to 6 THz. While the Cherenkov phase-matching scheme in THz DFG-QCLs resulted in a few mW of THz peak power output in pulsed mode and over 10 μW of THz power output in CW operation, new approaches are required to further improve the device performance, particularly for WPE at room temperature. We reported that the DAU active region design provides higher optical nonlinearity for THz DFG. Besides, the introduction of the III–V-on-silicon hybrid laser concept to a THz DFG-QCL results in dramatic improvement in THz outcoupling efficiency. We also reviewed the performance of single-mode, tunable THz DFG-QCLs based on EC and monolithic device configurations. The EC THz DFG-QCLs demonstrated ultra-broadband single mode tuning from 1 to 6 THz. Using electrically isolated dual grating sections, we demonstrated a method of monolithic tuning in a single DFG-QCL device. Our monolithic DFG-QCL tuners operated in pulsed mode at room temperature and provided single-mode THz tuning from 3.44 to 4.02 THz. In addition to the single-mode broadband tuning, we demonstrated the high-performance, ultra-broadband operation of room-temperature THz sources based on homogeneous DAU-QCLs with single DFB grating. The THz DFG device demonstrates gap-less broadband spectrum spanning more than one octave from 1.6 THz to 3.8 THz, with peak output power of ~0.2 mW at room temperature. Furthermore, using a DAU active region emitting at 6.8 μm, a THz DFG-QCL operating in CW at 78 K produces CW THz power of 20 μW and displays ultra-broadband emission. The broadband DFG-QCLs may have great potential to produce THz frequency comb for applications such as THz spectroscopy and heterodyne detection. Encouragingly, the mid-IR beat-note linewidth as narrow as 287 Hz, observed from the broadband CW THz DFG-QCL, may indicate potential generation of THz comb in our devices. In the near future, the simultaneous use of both methods, the DAU active region design and III–V-on-silicon hybrid laser concept, would produce THz sub-mW average power at room temperature, which will open up a new opportunity for THz applications, as we already witnessed from the high-quality terahertz non-destructive imaging measured with our broadband THz DFG-QCL.
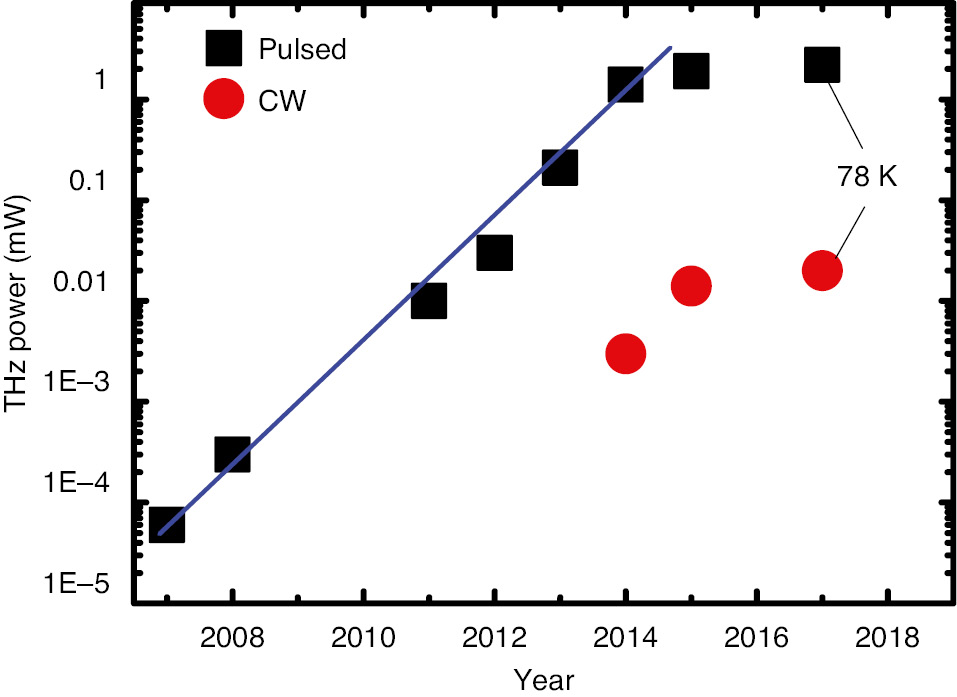
Timeline for the maximum output power in pulsed and CW modes at room temperature obtained by THz DFG-QCLs.
The data for 2007 and 2017 are given at cryogenic temperatures, all other data are at room temperature.
References
[1] Faist J, Capasso F, Sivco DL, Sirtori C, Hutchinson AL, Cho AY. Quantum cascade laser. Science 1994;264:553–6.10.1126/science.264.5158.553Suche in Google Scholar PubMed
[2] Faist J. Quantum cascade lasers. Oxford, Oxford University Press, 2013.10.1093/acprof:oso/9780198528241.001.0001Suche in Google Scholar
[3] Faist J, Hofstetter D, Beck M, Aellen T, Rochat M, Blaser S. Bound-to-continuum and two-phonon resonance, quantum-cascade lasers for high duty cycle, high-temperature operation. IEEE J Quantum Electron 2002;38:533–46.10.1109/JQE.2002.1005404Suche in Google Scholar
[4] Yamanishi M, Edamura T, Fujita K, Akikusa N, Kan H. Theory of the intrinsic linewidth of quantum-cascade lasers: hidden reason for the narrow linewidth and line-broadening by thermal photons. IEEE J Quantum Electron 2008;44:12–29.10.1109/JQE.2007.907563Suche in Google Scholar
[5] Beck M, Hofstetter D, Aellen T, et al. Continuous wave operation of a mid-infrared semiconductor laser at room temperature. Science 2002;295:301–5.10.1126/science.1066408Suche in Google Scholar PubMed
[6] Lyakh A, Maulini R, Tsekoun A, et al. 3 W continuous-wave room temperature single-facet emission from quantum cascade lasers based on nonresonant extraction design approach. Appl Phys Lett 2009;95:141113.10.1063/1.3238263Suche in Google Scholar
[7] Razeghi M, Lu QY, Bandyopadhyay N, et al. Quantum cascade lasers: from tool to product. Opt Express 2015;23:8462–75.10.1364/OE.23.008462Suche in Google Scholar PubMed
[8] Lyakh A, Suttinger M, Go R, Figueiredo P, Todi A. 5.6 μm quantum cascade lasers based on a two-material active region composition with a room temperature wall-plug efficiency exceeding 28%. Appl Phys Lett 2016;109:121109.10.1063/1.4963233Suche in Google Scholar
[9] Hugi A, Villares G, Blaser S, Liu HC, Faist J. Mid-infrared frequency comb based on a quantum cascade laser. Nature 2012;492:229.10.1038/nature11620Suche in Google Scholar PubMed
[10] Faist J, Villares G, Scalari G, et al. Quantum cascade laser frequency combs. Nanophotonics 2016;5:272–91.10.1515/nanoph-2016-0015Suche in Google Scholar
[11] Köhler R, Tredicucci A, Beltram F, et al. Terahertz semiconductor-heterostructure laser. Nature 2002;417:156.10.1038/417156aSuche in Google Scholar PubMed
[12] Williams BS. Terahertz quantum-cascade lasers. Nat Photonics 2007;1:517.10.1038/nphoton.2007.166Suche in Google Scholar
[13] Brandstetter M, Deutsch C, Krall M, et al. High power terahertz quantum cascade lasers with symmetric wafer bonded active regions. Appl Phys Lett 2013;103:171113.10.1063/1.4826943Suche in Google Scholar
[14] Li L, Chen L, Zhu J, et al. Terahertz quantum cascade lasers with>1 W output powers. Electron Lett 2014;50:309–11.10.1049/el.2013.4035Suche in Google Scholar
[15] Williams BS, Kumar S, Hu Q, Reno JL. High-power terahertz quantum-cascade lasers. Electron Lett 2006;42:89–91.10.1049/el:20063921Suche in Google Scholar
[16] Walther C, Fischer M, Scalari G, Terazzi R, Hoyler N, Faist J. Quantum cascade lasers operating from 1.2 to 1.6 THz. Appl Phys Lett 2007;91:131122.10.1063/1.2793177Suche in Google Scholar
[17] Wienold M, Röben B, Lü X, et al. Frequency dependence of the maximum operating temperature for quantum-cascade lasers up to 5.4 THz. Appl Phys Lett 2015;107:202101.10.1063/1.4935942Suche in Google Scholar
[18] Vitiello MS, Consolino L, Bartalini S, et al. Quantum-limited frequency fluctuations in a terahertz laser. Nat Photonics 2012;6:525.10.1038/nphoton.2012.145Suche in Google Scholar
[19] Turčinková D, Scalari G, Castellano F, Amanti MI, Beck M, Faist J. Ultra-broadband heterogeneous quantum cascade laser emitting from 2.2 to 3.2 THz. Appl Phys Lett 2011;99:191104.10.1063/1.3658874Suche in Google Scholar
[20] Burghoff D, Kao TY, Han N, et al. Terahertz laser frequency combs. Nat Photonics 2014;8:462.10.1038/nphoton.2014.85Suche in Google Scholar
[21] Rösch M, Scalari G, Beck M, Faist J. Octave-spanning semiconductor laser. Nat Photonics 2015;9:42–7.10.1038/nphoton.2014.279Suche in Google Scholar
[22] Rösch M, Beck M, Süess MJ, et al. Heterogeneous terahertz quantum cascade lasers exceeding 1.9 THz spectral bandwidth and featuring dual comb operation. Nanophotonics 2018;7:237–42.10.1515/nanoph-2017-0024Suche in Google Scholar
[23] Fathololoumi S, Dupont E, Chan CW, et al. Terahertz quantum cascade lasers operating up to~200 K with optimized oscillator strength and improved injection tunneling. Opt Express 2012;20:3866–76.10.1364/OE.20.003866Suche in Google Scholar PubMed
[24] Wienold M, Röben B, Schrottke L, et al. High-temperature, continuous-wave operation of terahertz quantum-cascade lasers with metal-metal waveguides and third-order distributed feedback. Opt Express 2014;22:3334–48.10.1364/OE.22.003334Suche in Google Scholar PubMed
[25] Belkin MA, Capasso F, Belyanin A, et al. Terahertz quantum-cascade-laser source based on intracavity difference-frequency generation. Nat Photonics 2007;1:288.10.1038/nphoton.2007.70Suche in Google Scholar
[26] Belkin MA, Capasso F, Xie F, et al. Room temperature terahertz quantum cascade laser source based on intracavity difference-frequency generation. Appl Phys Lett 2008;92:201101.10.1063/1.2919051Suche in Google Scholar
[27] Lu QY, Bandyopadhyay N, Slivken S, Bai Y, Razeghi M. Room temperature single-mode terahertz sources based on intracavity difference-frequency generation in quantum cascade lasers. Appl Phys Lett 2011;99:131106.10.1063/1.3645016Suche in Google Scholar
[28] Vijayraghavan K, Adams RW, Vizbaras A, et al. Terahertz sources based on Čerenkov difference-frequency generation in quantum cascade lasers. Appl Phys Lett 2012;100:251104.10.1063/1.4729042Suche in Google Scholar
[29] Vijayraghavan K, Jiang Y, Jang M, et al. Broadly tunable terahertz generation in mid-infrared quantum cascade lasers. Nat Commun 2013;4:2021.10.1038/ncomms3021Suche in Google Scholar PubMed
[30] Belkin MA, Capasso F. New frontiers in quantum cascade lasers: high performance room temperature terahertz sources. Phys Scr 2015;90:118002.10.1088/0031-8949/90/11/118002Suche in Google Scholar
[31] Lu QY, Bandyopadhyay N, Slivken S, Bai Y, Razeghi M. Widely tuned room temperature terahertz quantum cascade laser sources based on difference-frequency generation. Appl Phys Lett 2012;101:251121.10.1063/1.4773189Suche in Google Scholar
[32] Jiang Y, Vijayraghavan K, Jung S, et al. External cavity terahertz quantum cascade laser sources based on intra-cavity frequency mixing with 1.2–5.9 THz tuning range. J Opt 2014;16:094002.10.1088/2040-8978/16/9/094002Suche in Google Scholar
[33] Jung S, Jiang A, Jiang Y, et al. Broadly tunable monolithic room-temperature terahertz quantum cascade laser sources. Nat Commun 2014;5:4267.10.1038/ncomms5267Suche in Google Scholar PubMed
[34] Lu QY, Slivken S, Bandyopadhyay N, Bai Y, Razeghi M. Widely tunable room temperature semiconductor terahertz source. Appl Phys Lett 2014;105:201102.10.1063/1.4902245Suche in Google Scholar
[35] Jung S, Jiang Y, Vijayraghavan K, et al. Recent progress in widely tunable single-mode room temperature terahertz quantum cascade laser sources. IEEE J Sel Top Quantum Electron 2015;21:134–43.10.1109/JSTQE.2015.2428054Suche in Google Scholar
[36] Jiang A, Jung S, Jiang Y, Vijayraghavan K, Kim JH, Belkin MA. Widely tunable terahertz source based on intra-cavity frequency mixing in quantum cascade laser arrays. Appl Phys Lett 2015;106:261107.10.1063/1.4923374Suche in Google Scholar
[37] Lu Q, Wu D, Sengupta S, Slivken S, Razeghi M. Room temperature continuous wave, monolithic tunable THz sources based on highly efficient mid-infrared quantum cascade lasers. Sci Rep 2016;6:23595.10.1038/srep23595Suche in Google Scholar PubMed PubMed Central
[38] Hugi A, Terazzi R, Bonetti Y, et al. External cavity quantum cascade laser tunable from 7.6 to 11.4 μm. Appl Phys Lett 2009;95:061103.10.1063/1.3193539Suche in Google Scholar
[39] Lu QY, Bandyopadhyay N, Slivken S, Bai Y, Razeghi M. Continuous operation of a monolithic semiconductor terahertz source at room temperature. Appl Phys Lett 2014;104:221105.10.1063/1.4881182Suche in Google Scholar
[40] Razeghi M, Lu QY, Bandyopadhyay N, Slivken S. Recent development of high power, widely tunable THz quantum cascade laser sources based on difference-frequency generation. InUnmanned/Unattended Sensors and Sensor Networks XI; and Advanced Free-Space Optical Communication Techniques and Applications 2015 Oct 13 (Vol. 9647, p. 964703). International Society for Optics and Photonics.10.1117/12.2202967Suche in Google Scholar
[41] Fujita K, Ito A, Hitaka M, Dougakiuchi T, Edamura T. Low-threshold room-temperature continuous-wave operation of a terahertz difference-frequency quantum cascade laser source. Appl Phys Express 2017;10:082102.10.7567/APEX.10.082102Suche in Google Scholar
[42] Lu QY, Bandyopadhyay N, Slivken S, Bai Y, Razeghi M. Room temperature terahertz quantum cascade laser sources with 215 μW output power through epilayer-down mounting. Appl Phys Lett 2013;103:011101.10.1063/1.4812814Suche in Google Scholar
[43] Berger V, Sirtori C. Nonlinear phase matching in THz semiconductor waveguides. Semicond Sci Technol 2004;19:964.10.1088/0268-1242/19/8/003Suche in Google Scholar
[44] Hashizume N, Kondo T, Onda T, Ogasawara N, Umegaki S, Ito R. Theoretical analysis of Cerenkov-type optical second-harmonic generation in slab waveguides. IEEE J Quantum Electron 1992;28:1798–815.10.1109/3.142578Suche in Google Scholar
[45] Faist J, Beck M, Aellen T, Gini E. Quantum-cascade lasers based on a bound-to-continuum transition. Appl Phys Lett 2001;78:147–9.10.1063/1.1339843Suche in Google Scholar
[46] Fujita K, Edamura T, Furuta S, Yamanishi M. High-performance, homogeneous broad-gain quantum cascade lasers based on dual-upper-state design. Appl Phys Lett 2010;96:241107.10.1063/1.3455102Suche in Google Scholar
[47] Fujita K, Hitaka M, Ito A, et al. Terahertz generation in mid-infrared quantum cascade lasers with a dual-upper-state active region. Appl Phys Lett 2015;106:251104.10.1063/1.4923203Suche in Google Scholar
[48] Fujita K, Hitaka M, Ito A, Yamanishi M, Dougakiuchi T, Edamura T. Ultra-broadband room-temperature terahertz quantum cascade laser sources based on difference frequency generation. Opt Express 2016;24:16357–65.10.1364/OE.24.016357Suche in Google Scholar PubMed
[49] Kubis T, Yeh C, Vogl P, Benz A, Fasching G, Deutsch C. Theory of nonequilibrium quantum transport and energy dissipation in terahertz quantum cascade lasers. Phys Rev B 2009;79:195323.10.1103/PhysRevB.79.195323Suche in Google Scholar
[50] Jirauschek C, Kubis T. Modeling techniques for quantum cascade lasers. Appl Phys Rev 2014;1:011307.10.1063/1.4863665Suche in Google Scholar
[51] Fujita K, Furuta S, Dougakiuchi T, Sugiyama A, Edamura T, Yamanishi M. Broad-gain (Δλ/λ 0~0.4), temperature-insensitive (T 0~510K) quantum cascade lasers. Opt Express 2011;19:2694–701.10.1364/OE.19.002694Suche in Google Scholar PubMed
[52] Fujita K, Furuta S, Sugiyama A, et al. High-performance quantum cascade lasers with wide electroluminescence (~600 cm−1), operating in continuous-wave above 100 C. Appl Phys Lett 2011;98:231102.10.1063/1.3596706Suche in Google Scholar
[53] Dougakiuchi T, Fujita K, Akikusa N, Sugiyama A, Edamura T, Yamanishi M. Broadband tuning of external cavity dual-upper-state quantum-cascade lasers in continuous wave operation. Appl Phys Express 2011;4:102101.10.1143/APEX.4.102101Suche in Google Scholar
[54] Fujita K, Yamanishi M, Furuta S, Sugiyama A, Edamura T. Extremely temperature-insensitive continuous-wave quantum cascade lasers. Appl Phys Lett 2012;101:181111.10.1063/1.4765073Suche in Google Scholar
[55] Dougakiuchi T, Fujita K, Sugiyama A, Ito A, Akikusa N, Edamura T. Broadband tuning of continuous wave quantum cascade lasers in long wavelength (>10 μm) range. Opt Express 2014;22:19930–5.10.1364/OE.22.019930Suche in Google Scholar PubMed
[56] Gmachi C, Capasso F, Tredicucci A, et al. Dependence of the device performance on the number of stages in quantum-cascade lasers. IEEE J Sel Top Quantum Electron 1999;5:808–16.10.1109/2944.788454Suche in Google Scholar
[57] Fujita K, Furuta S, Sugiyama A, et al. High-performance λ~8.6 μm quantum cascade lasers with single phonon-continuum depopulation structures. IEEE J Quantum Electron 2010;46:683–8.10.1109/JQE.2010.2048015Suche in Google Scholar
[58] Alyabyeva LN, Zhukova ES, Belkin MA, Gorshunov BP. Dielectric properties of semi-insulating Fe-doped InP in the terahertz spectral region. Sci Rep 2017;7:7360.10.1038/s41598-017-07164-1Suche in Google Scholar PubMed PubMed Central
[59] Jung S, Kim JH, Jiang Y, Vijayraghavan K, Belkin MA. Terahertz difference-frequency quantum cascade laser sources on silicon. Optica 2017;4:38–43.10.1364/OPTICA.4.000038Suche in Google Scholar
[60] Fujita K, Ito A, Hitaka M, Dougakiuchi T, Edamura T. Development of THz light sources based on QCL technology. In Quantum Sensing and Nano Electronics and Photonics XV 2018 Jan 26 (Vol. 10540, p. 105401J). International Society for Optics and Photonics.Suche in Google Scholar
[61] Consolino L, Jung S, Campa A, et al. Spectral purity and tunability of terahertz quantum cascade laser sources based on intracavity difference-frequency generation. Sci Adv 2017;3:e1603317.10.1126/sciadv.1603317Suche in Google Scholar PubMed PubMed Central
[62] Jiang Y, Vijayraghavan K, Jung S, et al. Spectroscopic study of terahertz generation in mid-infrared quantum cascade lasers. Sci Rep 2016;6:21169.10.1038/srep21169Suche in Google Scholar PubMed PubMed Central
[63] Bartalini S, Consolino L, Cancio P, et al. Frequency-comb-assisted terahertz quantum cascade laser spectroscopy. Phys Rev X 2014;4:021006.10.1103/PhysRevX.4.021006Suche in Google Scholar
[64] Consolino L, Taschin A, Bartolini P, et al. Phase-locking to a free-space terahertz comb for metrological-grade terahertz lasers. Nat Commun 2012;3:1040.10.1038/ncomms2048Suche in Google Scholar PubMed
[65] Yamanishi M, Hirohata T, Hayashi S, Fujita K, Tanaka K. Electrical flicker-noise generated by filling and emptying of impurity states in injectors of quantum-cascade lasers. J Appl Phys 2014;116:183106.10.1063/1.4901582Suche in Google Scholar
[66] Wittmann A, Gresch T, Gini E, et al. High-performance bound-to-continuum quantum-cascade lasers for broad-gain applications. IEEE J Quantum Electron 2008;44:36–40.10.1109/JQE.2007.909516Suche in Google Scholar
[67] Hugi A, Maulini R, Faist J. External cavity quantum cascade laser. Semicond Sci Technol 2010;25:083001.10.1088/0268-1242/25/8/083001Suche in Google Scholar
[68] Geiser M, Pflügl C, Belyanin A, et al. Gain competition in dual wavelength quantum cascade lasers. Opt Express 2010;18:9900–8.10.1364/OE.18.009900Suche in Google Scholar PubMed
[69] Boyd RW. Nonlinear optics. 3rd ed. Oxford, Academic Press, 2008.Suche in Google Scholar
[70] Tonouchi M. Cutting-edge terahertz technology. Nat Photonics 2007;1:97.10.1038/nphoton.2007.3Suche in Google Scholar
[71] Vitiello MS, Scalari G, Williams B, De Natale P. Quantum cascade lasers: 20 years of challenges. Opt Express 2015;23:5167–82.10.1364/OE.23.005167Suche in Google Scholar PubMed
[72] Kim SM, Hatami F, Harris JS, et al. Biomedical terahertz imaging with a quantum cascade laser. Appl Phys Lett 2006;88:153903.10.1063/1.2194229Suche in Google Scholar
[73] Barbieri S, Alton J, Baker C, Lo T, Beere HE, Ritchie D. Imaging with THz quantum cascade lasers using a Schottky diode mixer. Opt Express 2005;13:6497–503.10.1364/OPEX.13.006497Suche in Google Scholar PubMed
[74] Bründermann E, Havenith M, Scalari G, et al. Turn-key compact high temperature terahertz quantum cascade lasers. Opt Express 2006;14:1829–41.10.1364/OE.14.001829Suche in Google Scholar PubMed
[75] Nguyen KL, Johns ML, Gladden LF, et al. Three-dimensional imaging with a terahertz quantum cascade laser. Opt Express 2006;14:2123–9.10.1364/OE.14.002123Suche in Google Scholar PubMed
[76] Lee AW, Qin Q, Kumar S, Williams BS, Hu Q, Reno JL. Real-time terahertz imaging over a standoff distance (>25 meters). Appl Phys Lett 2006;89:141125.10.1063/1.2360210Suche in Google Scholar
[77] Lee AW, Hu Q. Real-time, continuous-wave terahertz imaging by use of a microbolometer focal-plane array. Opt Lett 2005;30:2563–5.10.1364/OL.30.002563Suche in Google Scholar PubMed
[78] Oda N, Lee AW, Ishi T, Hosako I, Hu Q. Proposal for real-time terahertz imaging system with palm-size terahertz camera and compact quantum cascade laser. In Terahertz Physics, Devices, and Systems VI: Advanced Applications in Industry and Defense 2012 (Vol. 8363, p. 83630A). International Society for Optics and Photonics.10.1117/12.917682Suche in Google Scholar
[79] Dean P, Lim YL, Valavanis A, et al. Terahertz imaging through self-mixing in a quantum cascade laser. Opt Lett 2011;36:2587–9.10.1364/OL.36.002587Suche in Google Scholar PubMed
[80] Wienold M, Hagelschuer T, Rothbart N, et al. Real-time terahertz imaging through self-mixing in a quantum-cascade laser. Appl Phys Lett 2016;109:011102.10.1063/1.4955405Suche in Google Scholar
[81] Adam AJ, Kašalynas I, Hovenier JN, et al. Beam patterns of terahertz quantum cascade lasers with subwavelength cavity dimensions. Appl Phys Lett 2006;88:151105.10.1063/1.2194889Suche in Google Scholar
[82] Lyakh A, Maulini R, Tsekoun A, Go R, Patel CK. Multiwatt long wavelength quantum cascade lasers based on high strain composition with 70% injection efficiency. Opt Express 2012;20:24272–9.10.1364/OE.20.024272Suche in Google Scholar PubMed
©2018 Kazuue Fujita and Seungyong Jung et al., published by De Gruyter, Berlin/Boston
This work is licensed under the Creative Commons Attribution-NonCommercial-NoDerivatives 4.0 License.
Artikel in diesem Heft
- Review Articles
- Toward a mechanistic understanding of plasmon-mediated photocatalysis
- Waveguide-integrated superconducting nanowire single-photon detectors
- Acoustic phonons in nanowires probed by ultrafast pump-probe spectroscopy
- Germanium-based integrated photonics from near- to mid-infrared applications
- Recent progress in terahertz difference-frequency quantum cascade laser sources
- Research Articles
- Optically processed microlens array for single-beam lithography of plasmonic structures
- Thermally robust ring-shaped chromium perfect absorber of visible light
- Epsilon-near-zero medium for optical switches in a monolithic waveguide chip at 1.9 μm