Fracture mechanical evaluation of the material HCT590X
-
Britta Schramm

 and
Deborah Weiß
and
Deborah Weiß

Abstract
For a reliable, strength-compliant and fracture-resistant design of components and technical structures and for the prevention of damage cases, both the criteria of strength calculation and fracture mechanics are essential. In contrast to strength calculation the fracture mechanics assumes the existence of cracks which might further propagate due to the operational load. First, the present paper illustrates the general procedure of a fracture mechanical evaluation of fatigue cracks in order to assess practical damage cases. Fracture mechanical fundamentals which are essential for the calculation of the stress intensity factors KI and the experimental determination of fracture mechanical material parameters (e.g. threshold ΔKI,th against fatigue crack growth, crack growth rate curve) are explained in detail. The subsequent fracture mechanical evaluation on the basis of the local stress situation at the crack tip and the fracture mechanical material data is executed for different materials and selected crack problems. Hereby, the main focus is on the material HCT590X as it is the essential material being investigated by TRR285.
1 Introduction
The failure of components and technical structures due to mechanical stresses can be divided into strength failure and fracture mechanical failure [1, 2]. Strength failure occurs in the case of static loading when the maximum stress σmax reaches the tensile strength Rm or the yield strength RP0.2. In case of cyclic loading, strength failure takes place when the maximum stress amplitude σa,max is larger than the fatigue strength σD. By comparing the effective stress (e. g. maximum stress σmax or maximum stress amplitude σa,max) with the permitted stress σper and σa,per the proofs of strength and fatigue strength are carried out. In addition to the material parameters mentioned before, safety factors (SF against fracture, SY against yielding, and SD against fatigue fracture) as well as in the case of fatigue strength calculation the surface coefficient b1 of the material and the size coefficient b2 of the component are considered.
In contrast, fracture mechanical failure is caused by defects and cracks which initiate and/or propagate under the operational load. In this case, the fracture mechanical stress variable – the stress intensity factor KI in the case of static loading and the cyclic stress intensity factor ΔKI in the case of cyclic loading – reaches a fracture mechanical material limit. Unstable crack propagation occurs when the stress intensity factor KI reaches the material dependent fracture toughness KIC. Fatigue cracks grow in a stable manner as long as the cyclic stress intensity factor ΔKI is larger than the threshold ΔKI,th against fatigue crack propagation and smaller than the cyclic fracture toughness ΔKIC, which can be calculated using the R-ratio and the fracture toughness KIC.
For a reliable, strength-compliant and fracture-resistant design of components and technical structures and for the prevention of damage cases, both the criteria of (fatigue) strength calculation and fracture mechanics have to be taken into account. The interaction of (fatigue) strength calculation and fracture mechanics [1, 2] is shown in Figure 1.
![Figure 1:
Interaction of (fatigue) strength calculation and fracture mechanics [2].](/document/doi/10.1515/mt-2022-0191/asset/graphic/j_mt-2022-0191_fig_001.jpg)
Interaction of (fatigue) strength calculation and fracture mechanics [2].
First, the present paper illustrates the general procedure of a fracture mechanical evaluation of fatigue cracks in order to assess practical damage cases and is structured as follows. Herefore, knowledge about fracture mechanical parameters and concepts is required which are presented in Section 2. In addition, fracture mechanical material parameters (e.g. threshold ΔKI,th against fatigue crack growth, crack growth rate curve) are necessary. Hence, the experimental procedure to determine these parameters is described in Section 3. In this context, crack growth rate curves of different materials are presented as well. Thereby, the focus is especially on HCT590X as it is the essential material being investigated by TRR285 [3], [4], [5]. The subsequent fracture mechanical evaluation on the basis of the local stress situation at the crack tip and the experimentally determined fracture mechanical material data is executed in Section 4 for selected crack problems. Hereby, it is shown among other things how the range of fatigue crack growth differs from material to material. Additionally, the difference between strength failure and fracture mechanical failure is discussed.
2 Fatigue crack growth under cyclic mixed mode
Cracks are defined as local cuts in a component or a technical structure. Thereby, they can already exist in form of material defects or manufacturing defects or develop due to the operational load [2]. In case of time-varying loading crack propagation is possible and a distinction is made between stable crack growth (fatigue crack growth) and unstable crack growth. Stable crack growth occurs in a controlled manner over a long period of time. The subsequent uncontrolled and very fast unstable crack growth results in the total failure of the structure. The phases of stable and unstable crack growth can be seen on the fracture surfaces of broken machine parts and specimens, see Figure 2.
![Figure 2:
Stable and unstable crack propagation on fracture surfaces [2].](/document/doi/10.1515/mt-2022-0191/asset/graphic/j_mt-2022-0191_fig_002.jpg)
Stable and unstable crack propagation on fracture surfaces [2].
2.1 Local stress fields and stress intensity factors
As a consequence of cracks, the force flow is sharply redirected. While in the crack-free region in Figure 3 the transmission of forces through the structure is not disturbed, the embedded crack and the surface crack cause a redirection of force flow. Here, at the crack tips the force flow lines are very close to each other, indicating high local stresses (local singular stress field).

Force flow for a crack-free region, an embedded crack and a surface crack.
There are different parameters to describe the situation at the crack tip from a fracture mechanical point of view, such as (i) stress intensity factor K, (ii) energy release rate G, and (iii) J-integral. While the J-integral can be used for both linear-elastic material behavior and elastic-plastic behavior, the first two parameters mentioned can be used exclusively in the context of linear-elastic fracture mechanics. In the following, stress intensity factors are considered.
The structure in Figure 4a shows an edge crack with the crack length a and is subjected to a time-varying loading with constant stress amplitude σa(t).

Essential parameters of fatigue crack growth, a) local stress situation in the vicinity of the crack, b) crack growth rate curve.
The elastic stress field σ
ij
(t) in the vicinity of the crack is described by Equation (1) for a time-varying loading situation for plane mixed mode considering the local stress singularity directly at the crack tip if the polar coordinate r approaches zero. The intensity of the stress field is characterized by the stress intensity factors KI and KII representing the appropriate mode situation (see Section 2.2) as well as by dimensionless functions
The definitions of the stress intensity factor KI and the cyclic stress intensity factor ΔKI for mode I loading are presented in Equation (2). These factors depend on the external load σ or Δσ, the crack length a and the geometry factor YI.
The crack growth rate da/dN considers the crack elongation da per load cycle dN and is determined experimentally (Section 3.1). If the crack growth rate da/dN is plotted in a double-logarithmic diagram as a function of the cyclic stress intensity factor ΔKI, the crack growth rate curve (Figure 4b) is obtained.
The crack growth rate curve reaches at both ends two limit values in an asymptotic way: the threshold ΔKI,th against fatigue crack growth and the cyclic fracture toughness ΔKIC. In the case of long cracks, a fatigue crack is not able to propagate if the cyclic stress intensity factor ΔKI is below this threshold ΔKI,th. If the cyclic stress intensity factor ΔKI is equal to or even larger than the second value ΔKIC, unstable crack propagation occurs. Hence, according to linear elastic fracture mechanics (LEFM) fatigue crack growth takes place as long as Equation (3) is fulfilled.
Numerous crack propagation concepts have been developed, e.g. Paris-law [6], Erdogan/Ratwani-Equation [7] and the Forman-Mettu-Equation [8], in order to describe the crack growth rate curve in the form da/dN = f(∆KI, R) mathematically. With this mathematical description of the crack growth rate curve, for example, the residual lifetime NC of the structure can be calculated by integration. However, it should be noted that such an integration of the remaining service life is only possible in a closed form for a constant geometry factor YI and a constant load. For complex geometries, changing stress situations and increasing crack lengths, a numerical integration of the service lifetime is indispensable. Therefore, numerical programs are often used to simulate crack propagation in complex structures under complex loading situations [9, 10].
2.2 Fundamental local crack modes and mixed mode loading
Irwin [11] defined three fundamental local crack modes which consider the different loadings of a crack and are characterized by different propagation directions, as shown in Figure 5. Mode I applies for all normal stresses σ which cause crack opening. Mode II involves all plane shear stresses τ resulting in an opposite sliding of the crack surfaces in x-direction and, therefore, a kinking of the crack with the kinking angle φ0. Mode III is characterized by a transverse sliding of the crack planes in z-direction due to a non-plane stress state and results in the twisting of the crack with the twisting angle ψ0.
![Figure 5:
Local crack modes: Mode I, mode II and mode III (according to [2]), a) loading situations, b) crack growth (kinking angle φ0, twisting angle ψ0).](/document/doi/10.1515/mt-2022-0191/asset/graphic/j_mt-2022-0191_fig_005.jpg)
Local crack modes: Mode I, mode II and mode III (according to [2]), a) loading situations, b) crack growth (kinking angle φ0, twisting angle ψ0).
If the above-mentioned basic crack modes appear in combination due to the external loading and/or the orientation of the crack, a mixed mode stress situation occurs [12], [13], [14]. While plane mixed mode (2D mixed mode) considers the superposition of mode I and mode II, spatial mixed mode (3D mixed mode) takes all three modes into account. In case of mixed mode, the singular stress field in the crack area is nonsymmetrical, see embedded crack in Figure 3. Hence, the elastic stress field does not only depend on the cyclic stress intensity factor ΔKI of mode I, but also on the cyclic stress intensity factor ΔKII of mode II and/or ΔKIII of mode III. In this case, a cyclic equivalent stress intensity factor ΔKeq, see Section 2.3, is calculated and compared to fracture mechanical material parameters in order to make statements about the ability of crack growth.
2.3 Fracture mechanical concepts
The prediction of crack propagation requires statements about the cyclic equivalent stress intensity factor ΔKeq in case of mixed mode loadings and about the kinking angles φ0 as well as the twisting angles ψ0. These statements are possible by using fracture mechanical concepts. Some selected concepts which can be used for homogeneous and isotropic materials as well as for different loading situations are mentioned in the following. Very well-known concepts for plane crack problems are for instance the criteria of Erdogan and Sih [14] and Richard [15]. The maximum tangential stress (MTS) concept for plane crack problems by Erdogan and Sih is based on the tangential stress σφ and assumes that the crack grows in the direction φ0 which is perpendicular to the maximum tangential stress. Thereby, predictions of crack propagation direction as well as of the beginning of stable and unstable crack growth are possible. This concept was extended to the
3 Fracture mechanical characterization of HCT590X
In order to design components and structures reliably and to evaluate them with regard to fatigue crack growth, fracture mechanical material parameters (e.g. threshold ΔKI,th against fatigue crack growth, crack growth rate da/dN and fracture toughness KIC) are required. Since they are material-dependent, they have to be determined experimentally for each material. The tests carried out within the scope of this paper, taking into account the ASTM standard E 647–08 [20], are described in the following section. Experimentally determined crack growth rate curves of the material HCT590X are presented as well. This material investigated here is a dual-phase steel supplied in form of a hot-dip galvanized thin sheet. The chemical composition is listed in Table 1.
Chemical composition of HCT590X according to [21].
| Fe | C | Si | Mn | P | S | Cr + Mo | others | |
|---|---|---|---|---|---|---|---|---|
| Mean value | 97.500 | 0.051 | 0.233 | 1.700 | 0.006 | <0.005 | 0.337 | 0.0879 |
| Standard deviation | 0.013 | 0.003 | 0.0024 | 0.027 | 0.0003 | 0.0001 | 0.0039 |
Dual-phase steels exhibit a very low yield strength ratio combined with very high tensile strength and strong work hardening due to its ferritic (soft) base structure in which a martensitic second phase is inserted in an island-like manner. They are characterized by good cold formability, which makes them especially suitable for components with complex designs.
3.1 Fracture mechanical specimens and experimental procedure
The experimental determination of the crack growth rate curves is carried out according to ASTM E 647 [20]. Figure 6a shows the experimental set-up consisting of the electro-mechanical dynamic test system E10000 (Instron) and compact tension specimens (CT specimens). Before starting the actual test, a fatigue crack with the length a = 5 mm is initiated in order to exclude any influences of the starter notch on the results of the fatigue crack growth tests.

Experimental investigations for the determination of crack growth rate curves, a) experimental set-up, b) two test types for the determination of the lower and the upper branch.
During the test procedure, the crack length a is continuously measured by means of the direct electro potential drop method [2]. Thereby, a constant electric current I is induced at the top of the specimen and the potential difference U is measured above and below the notch, as shown in Figure 6a.
Due to the reduction of the residual ligament as a result of crack growth, the ohmic resistance within the specimen increases. This results in an increase of the potential difference U compared to the initial potential difference U0. Using a calibration curve, the quotient U/U0 provides the respective crack length a. The geometry-dependent calibration curve has to be determined in advance either numerically by potential simulations or experimentally by specific rest marks on the surface of the fatigue crack as a result of individual overloads in a separate test. Then, the position of each rest mark (Figure 2) is measured. The subsequent plotting of the crack length present at the position of an overload relative to the ligament (a/w) versus the quotient U/U0 provides the calibration curve.
The two types of tests which are required to determine the entire crack growth rate curve are schematically shown in Figure 6b. In the first test type, the cyclic stress intensity factor ΔKI is chosen in such a way that the crack grows at an average crack growth rate da/dN. With increasing crack length a, the cyclic stress intensity factor ΔKI is exponentially reduced until a crack growth rate defining the crack stop (∼10−7mm/load cycles) and, hence, the threshold ΔKI,th is reached. In this way, the middle and lower part of the crack growth rate curve is determined. In the second test type, the maximum and minimum load (Fmax and Fmin) and, therefore, the cyclic load ΔF are kept constant. Consequently, as the crack length increases, the cyclic stress intensity factor ΔKI increases as well, resulting in the middle and upper part of the crack growth rate curve. By combining both branches the entire crack growth rate curve is obtained.
3.2 Crack growth rate curves of different materials
In the following, selected results are presented which illustrate the fracture mechanical behavior of different materials as well as the influence of the stress ratio (R-ratio) on crack growth rate curves. First, Figure 7 shows experimentally determined crack growth rate curves of HCT590X [5] measured for different stress ratios (namely R = 0.1, 0.3 and 0.5). For larger R-ratios the fracture mechanical curve is shifted to the left side resulting in a lower threshold and a smaller cyclic fracture toughness. For example, the threshold ΔKI,th for an R-ratio of 0.1 is 5.3 MPam1/2 and for R = 0.5 it is 4.5 MPm1/2. However, whereas a significant impact can be observed for the low and the high crack growth rate, the influence of different R-ratios is only slightly pronounced in the midrange of the curve. This experimentally measured fracture mechanical behavior of HCT590X for different R-ratios corresponds with literature and long-term experiences on this topic [2].

Crack growth rate curves of HCT590X for different stress ratios (R-ratios).
Table 2 summarizes the determined thresholds ΔKI,th and cyclic fracture toughness for the examined R-ratios.
Threshold values ΔKI,th and cyclic fracture toughness ΔKIC of HCT590X for different R-ratios.
| Stress ratio (R-ratio) | 0.1 | 0.3 | 0.5 |
|---|---|---|---|
| Threshold ΔKI,th [MPam1/2] (mean value) | 5.3 | 4.8 | 4.5 |
| Cyclic fracture toughness ΔKIC [MPam1/2] | 63 | 49 | 35 |
Using the Forman/Mettu-Equation, Equation (4), the entire crack growth rate curve can be described mathematically in dependency of the R-ratio. Thereby, the equation consists of several material-dependent quantities which have to be adjusted to the experimental data.
The adjustment of the material-dependent quantities valid for different R-ratios is given in the following Table 3.
Parameters of Forman/Mettu-equation.
| CFM | n FM | p | q | ΔK0 | K C | α | smax/σ0 | C th+ | a 0 |
|---|---|---|---|---|---|---|---|---|---|
| 2.6E-12 | 2.5 | 0.3 | 0.87 | 183.4 | 2213.6 | 3 | 0.3 | −0.0845 | 0.0381 |
In Figure 8, the crack growth rate curve of the material HCT590X for a R-ratio of 0.1 is compared with corresponding curves of other selected materials (EN AW 7075, 34CrNiMo6 and 51CrV4) [16, 22] for the same stress ratio. Hereby, significant differences can be recognized in the curves. 34CrNiMo6 has a lower threshold ΔKI,th, but a higher cyclic fracture toughness ΔKIC than 51CrV4. The crack growth rate curve of the aluminum alloy and its corresponding fracture mechanical parameters is located on the left side of all steel curves and exhibits a double-S-shape which is typical for this group of materials. The crack growth rate curve of HCT590X is shifted to the right side compared to the aluminum resulting in better fracture mechanical properties. However, the comparison of HCT590X with 34CrNiMo6 and 51CrV4 shows that this material is more susceptible to crack growth as the threshold is with ΔKI,th = 5.3 MPam1/2 lower compared to the other steels.

Crack growth rate curves of different materials.
3.3 Mixed mode investigations
As already mentioned in Section 2.2, the basic crack modes can also appear in combination due to the external loading and/or the orientation of the crack. Fracture mechanical concepts enable the prediction of the kinking angle φ0 in the presence of a mixed mode stress situation. Functions of the kinking angle φ0 in dependency of the mixed mode ratio KII/(KI + KII) calculated using the criteria of Erdogan and Sih, Richard, Nuismer, Amestoy, and Sih (see Section 2.3 and [23]) are shown in Figure 9.
![Figure 9:
Comparison of fracture mechanical concepts with experimentally determined kinking angles φ0 in dependency of mixed mode ratio [23].](/document/doi/10.1515/mt-2022-0191/asset/graphic/j_mt-2022-0191_fig_009.jpg)
Comparison of fracture mechanical concepts with experimentally determined kinking angles φ0 in dependency of mixed mode ratio [23].
It can be seen that the results up to a mixed mode ratio of 0.3 do not show large differences. For example, all concepts deliver a kinking angle of φ0 = 0° for pure mode I loading. For a larger mode II influence or for pure mode II loading, there is a significant scatter between the different concepts. The comparison with experimentally determined kinking angles for different materials (here PMMA, Araldit B, PVC and aluminum alloys) shows only a small scatter. Hence, the prediction of kinking angles φ0 by using different fracture mechanical concepts is in good agreement with each other as well as with the experimental findings especially for a huge mode I portion.
Investigations about the crack propagation in relation to the mixed mode influence are also carried out within the framework of TRR285 [3], [4], [5] whose main research focus is the method development for mechanical joinability in versatile process chains. One of the mechanical joining processes considered there is clinching, in which very thin sheets of HCT590X with just a thickness of 1.5 mm are joined together. For the fracture mechanical investigations of these thin sheets CTS-specimens are taken from them and tested with an appropriate loading device. The experimental determined kinking angles φ0 [24] for different mixed mode ratios [24] are shown in Figure 9. Even for such thin specimens the experimental investigations deliver kinking angles in good accordance with (i) the values of other materials for the different mixed mode ratios and with (ii) the theoretical predictions of the fracture mechanical concepts.
4 Fracture mechanical assessment of fundamental crack problems
For the prevention of fatigue crack growth and fatigue fracture, strength calculations as well as fracture mechanical evaluations have to be taken into account. The two-criteria concept in Figure 1 clarifies the interaction of these concepts. There, the strength limits σD (as fatigue strength) and Rm (as tensile strength) are shown as well as the fracture mechanical limits ΔKI,th (as threshold against fatigue crack propagation) and KIC (as fracture toughness). With stresses σ and stress amplitudes σa reaching the strength limits Rm and σD, strength failure occurs. In contrast, a fracture mechanical evaluation requires the existence of a crack. Thereby, the length of the technical crack generally corresponds to the size of the defect that is detectable via nondestructive testing [2].
If a component is subjected to a cyclic load Δσ, even a load level far below the fracture limit might cause crack propagation. In this context, the following questions arise:
Under which conditions does the crack grow?
Whereto does the crack grow?
How fast does the crack grow?
What is the remaining lifetime of the structure?
The conditions for crack growth are also presented in the two-criteria-concept in Figure 10.

Illustration of the two-criteria-concept using a stress versus crack length – diagram (σ or σa vs. a – diagram).
Below the threshold curve (ΔKI,th-curve), a crack with the crack length a is not capable of growth. With reaching the fracture toughness curve (KIC-curve) fracture mechanical failure in form of unstable crack propagation occurs. The region marked in gray shows the area of stable crack propagation. Fatigue crack growth is possible if the cyclic stress intensity factor ΔKI is larger than the threshold ΔKI,th against fatigue crack propagation and smaller than the cyclic fracture toughness ΔKIC of the material which can be estimated by using the static fracture toughness KIC and the R-ratio (ΔKIC = KIC(1−R)). In the following, selected crack problems are presented and their assessment with regard to strength failure and fracture mechanical failure is explained in detail.
Thereby, the material parameters (tensile strength Rm, yield strength RP0.2, threshold ΔKI,th against fatigue crack growth, and fracture toughness KIC) presented in Table 4 are considered.
Materials and material parameters.
| Materials | Rm (MPa) | RP0.2 (MPa) | ΔKI,th (MPam1/2) | KIC (MPam1/2) |
|---|---|---|---|---|
| HCT590X | 620 | 420 | 5.3 | 70 |
| EN AW 7075 | 540 | 470 | 2.5 | 30 |
| C45 | 785 | 645 | 5.9 | 47.4 |
| 51CrV4 | 900 | 600 | 12.2 | 117 |
| 34CrMo4 | 1000 | 450 | 65 | |
| 35CrMo13-5 | 1000 | 40 | ||
| 34CrNiMo6 | 1123 | 1006 | 8.1 | 135.2 |
4.1 Griffith crack in an infinitely extended plate
The Griffith crack – the fundamental crack model in fracture mechanics – considers an internal crack in an infinitely extended plate. For tensile loading of the plate, the geometry factor YI is 1. Using this information and Equation (2), the calculation of the critical stress σc or of the critical crack length ac is possible, for which unstable crack growth occurs, as shown in Equation (5).
The same procedure, Equation (6), enables the determination of the cyclic stress Δσth or of the crack length ath, for which stable fatigue crack growth is possible.
The relationship between the component load in form of a cyclic normal stress Δσ and the crack dimension (crack length a) within the component is shown in Figure 11 for the material HCT590X. Here, the two limit curves (threshold curve and fracture toughness curve) are derived by using Equations (6) and (7) as well as the experimentally determined material parameters KIC and ΔKI,th (see Section 3).

Fatigue crack growth assessment for the Griffith-crack, a) area of stable fatigue crack growth for the material HCT590X, b) threshold curves (ΔKI,th–curves) for the material HCT590X and other selected materials.
For a given component load Δσ either the crack length ath at which stable crack propagation is possible or the critical crack length ac at which unstable crack propagation occurs can be determined. In addition, if a certain crack length a is known, the corresponding stresses Δσth and ΔσC can be read off.
For cyclic loading a crack is able to propagate if the corresponding cyclic stress intensity factor ΔKI is larger than the threshold ΔKI,th. Figure 11b shows different threshold curves (ΔKI,th–curves) for various materials (namely HCT590X, EN AW 7075, C45, 51CrV4 and 34CrNiMo6). Under the assumption of an external component load of Δσ = 200 MPa a crack with the crack length of a = 0.22 mm is capable of growth for the material HCT590X. For other materials the corresponding crack lengths vary between a = 0.05 mm for EN AW 7075, a = 0.27 mm for C45, a = 0.52 mm for 34CrNiMo6 and a = 1.19 mm for 51CrV4.
Figure 12 illustrates the relationship between strength failure and fracture mechanical failure of different materials in dependency of the crack length a. Strength failure occurs when the effective stress σ reaches the tensile strength Rm. Fracture mechanical failure occurs when the stress intensity factor KI reaches the fracture toughness KIC. With increasing fracture toughness KIC the fracture mechanical limit curves shift to higher values. For an initial crack of a = 2 mm, fracture mechanical failure (unstable crack propagation) occurs for the materials EN AW 7075, C45, 35CrMo13-5, and 34CrMo4. In contrast to that, strength failure takes place in the case of HCT590X, 51CrV4, and 34CrNiMo6.
![Figure 12:
Interaction between strength failure and fracture mechanical failure of HCT590X and other selected materials [1] for the crack length a = 2 mm.](/document/doi/10.1515/mt-2022-0191/asset/graphic/j_mt-2022-0191_fig_012.jpg)
Interaction between strength failure and fracture mechanical failure of HCT590X and other selected materials [1] for the crack length a = 2 mm.
4.2 Cracks starting at notches (notch crack problem)
In technical practice, cracks start very often at notches and bores. This is particularly the case with riveted or clinched joints, e.g. in aircraft and automobile components. These mechanical joints are subject of research of the TRR285 [3], [4], [5].
An example of a notch crack problem is shown in Figure 13a for a tensile loaded plate. This example assumes a width of 2w = 50 mm, a thickness of t = 1.5 mm and a circular hole with radius r = 4 mm in the middle of the disc. Cracks can start on both sides of this hole and grow perpendicular to the tensile stress σ. The crack length a is measured from the middle of the circular hole. For this mode I crack problem the stress intensity factor KI is calculated by Equation (2). The geometry function YI, Equation (7), required for this calculation is determined by numerical analysis in dependency of the a/w-ratio.
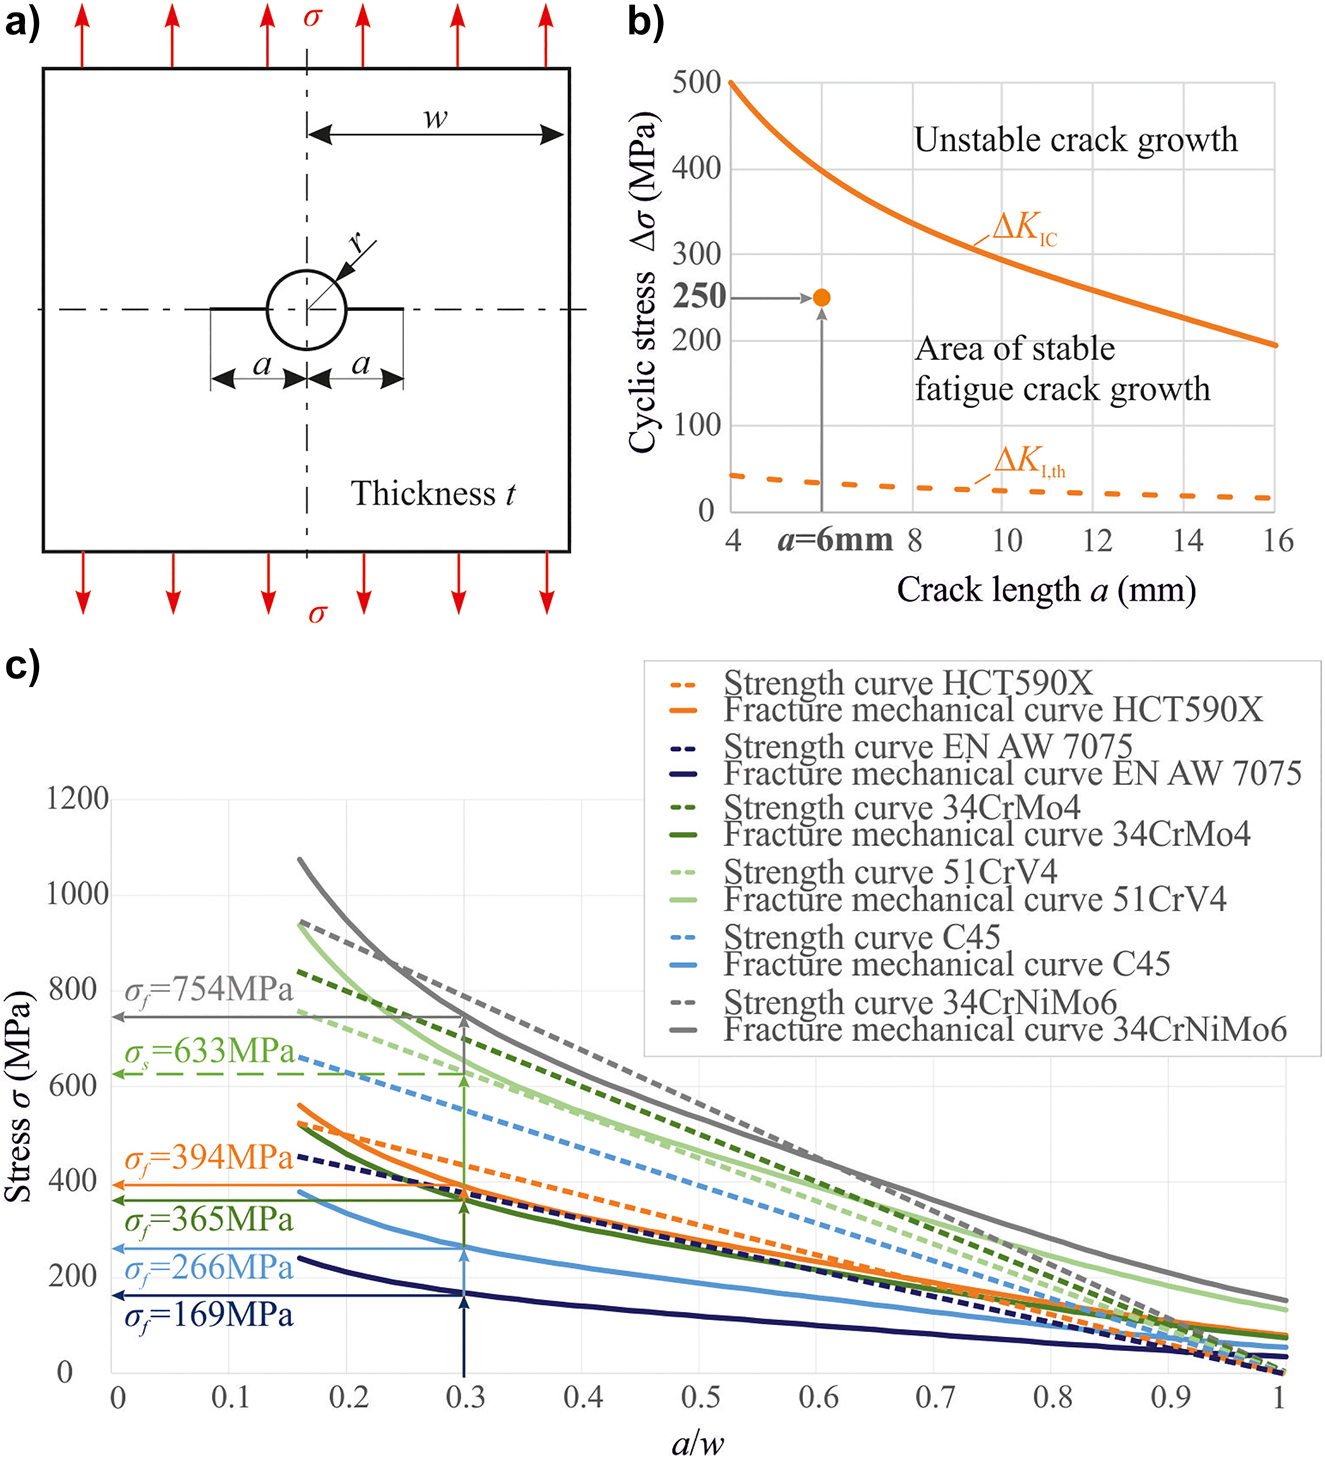
Cracks starting from a hole (notch crack problem), a) geometrical dimensions of the structure, the notch and the crack, b) area of fatigue crack growth for the material HCT590X, c) comparison of failure types for different materials.
A crack with the initial crack length a0 = 2 mm (total crack length a = 6 mm) leads to an a/w-ratio of 0.24. The corresponding YI-factor, calculated by Equation (7), is 1.15. An external cyclic stress Δσ of 250 MPa leads to a cyclic stress intensity factor ΔKI of 39.5 MPam1/2 which is larger than the threshold against fatigue crack growth of HCT590X and smaller than the cyclic fracture toughness at a R-ratio of 0.1, see Table 1. This fracture mechanical evaluation is illustrated graphically in Figure 13b by the fracture mechanical limit curves of the mentioned material.
Here, the threshold curve (ΔKI,th-curve) determined by using Equations (2) and (8) as well as the threshold of HCT590X defines the starting of the area of stable fatigue crack growth in dependency of crack length a. If the cyclic fracture toughness ΔKIC is used instead of the threshold ΔKI,th, the second limit curve (fracture toughness curve) is obtained. This second curve defines the begin of unstable crack growth. The considered data point (a = 6 mm/Δσ = 250 MPa) is located between these two limit curves and, thus, within the range of stable fatigue growth. The crack is, therefore, capable of growth. However, these geometric dimensions and current loading situation do not directly lead to unstable failure.
Another type of illustration (Figure 13c) for evaluating the strength failure is the introduction of a strength curve, in which ideal-plastic material behavior is assumed [25]. Hereby, the load limit is set equal to the tensile strength Rm for the complete residual cross-section. For a width of 2w, the relationship shown in Equation (8) enables the determination of the strength curve. The stress σs is the applied external stress at which fracture occurs in the residual cross-section (strength failure). This Equation results in a linearly decreasing straight line (strength curve) when plotted against the a/w-ratio.
The fracture mechanical curves in Figure 13c are obtained by considering the fracture toughness KIC, the determined geometry factor function YI, Equation (7), as well as the formulaic relation in Equation (9). Here, σf is the applied stress at which fracture mechanical failure occurs.
The strength curves and fracture mechanical curves determined in this way for the different materials (HCT590X, EN AW 7075, 34CrMo4, 51CrV4, C45, and 34CrNiMo6) are shown in Figure 13c. For a/w-ratio of 0.3 which corresponds to a crack length of a = 7.4 mm, fracture mechanical failure occurs at σ f = 169 MPa for the aluminum alloy, at σ f = 266 MPa for C45, at σ f = 365 MPa for 34CrMo4, at σ f = 394 MPa for HCT590X and at σ f = 754 MPa for 34CrNiMo6 since the fracture mechanical curve is below the strength curve at this a/w-ratio. In the case of 51CrV4 the strength curve is located below the fracture mechanical curve. Hence, the stress at which the structure fails due to strength failure is σs = 633 MPa.
5 Conclusions
The aim of any engineering activity is, among others, (i) the prevention of damages to components and structures, (ii) the evaluation of local cracks that occur during operation, as well as (iii) the definition and implementation of life-extending measures if necessary. For this purpose, concepts of strength calculation and fracture mechanics are required in order to avoid damages caused by mechanical stresses. The crack problems discussed in detail in this paper as well as practical damage cases described in [1, 26] confirm that both concepts of strength calculation and fracture mechanics are essential for a systematic damage analysis.
As presented in this paper, the fracture mechanical evaluation of a component with a technical crack requires information about the local stress situation at the crack tip (e.g. stress intensity factor KI) as well as fracture mechanical material parameters (e.g. threshold ΔKI,th against fatigue crack growth, crack growth rate curve). The general procedure of a fracture mechanical evaluation which uses fracture mechanical concepts and compares stress intensity factors with experimentally determined material parameters, was exemplified for selected crack problems and different materials (e. g. HCT590X). The experimental investigations required for the determination of fracture mechanical material parameters were discussed in Section 3 using the example of material HCT590X. For different R-ratios the crack growth rate curves deviate from each other. For a R-ratio of 0.1 a threshold of 5.31 MPam1/2 is obtained. For higher R-ratios the curve is shifted to the left, hence to smaller thresholds. The comparison with other materials enables a better understanding of the fracture mechanics behavior of HCT590X.
Furthermore, the interaction between strength failure and fracture mechanical failure was discussed for the example of the Griffith crack for different materials in dependency of the crack length a. Hereby, the illustration of two limit curves (threshold curve and fracture toughness curve) enables among other things statements about the failure type in dependency of a given component load or crack length. In addition, the influence of the material on both curves was shown. Furthermore, a similar approach with a slightly different type of representation was carried out for the notch cracking problem confirming as well that the consideration of strength aspects and fracture mechanical characteristics are required for a thorough assessment of a technical structure.
Nomenclature
- a
-
crack length
- a 0
-
initial crack length
- a c
-
critical crack length
- a th
-
crack length for which stable fatigue crack growth is possible
- b 1
-
surface coefficient of the material
- b 2
-
size coefficient of the component
- da
-
crack elongation
- da/dN
-
crack growth rate
- dN
-
load cycles
-
-
dimensionless function for mode I
-
-
dimensionless function for mode II
- F, ΔF
-
load, cyclic load
- F max
-
maximum load
- F min
-
minimum load
- I
-
electric current
- ΔKeq
-
cyclic equivalent stress intensity factor
- K I
-
stress intensity factor (mode I)
- K II
-
stress intensity factor (mode II)
- K IC
-
fracture toughness
- K I,max
-
maximum stress intensity factor (mode I)
- K I,min
-
minimum stress intensity factor (mode I)
- ΔKI
-
cyclic stress intensity factor (mode I)
- ΔKII
-
cyclic stress intensity factor (mode II)
- ΔKIII
-
cyclic stress intensity factor (mode III)
- ΔKIC
-
cyclic fracture toughness
- ΔKI,th
-
threshold against fatigue crack growth
- ΔKeq
-
cyclic equivalent stress intensity factor
- N C
-
residual lifetime
- r
-
polar coordinate
- r
-
radius
- R
-
stress ratio
- R m
-
tensile strength
- R P0.2
-
yield strength
- S D
-
safety factor against fatigue fracture
- S F
-
safety factor against fracture
- S Y
-
safety factor against yielding
- t
-
thickness
- t
-
time
- U
-
potential difference
- U 0
-
initial potential difference
- x, y, z
-
cartesian coordinates
- Y I
-
geometry factor (mode I)
- Y II
-
geometry factor (mode II)
- β
-
angle (crack position)
- σ, Δσ
-
normal stress, cyclic normal stress
- σ a
-
stress amplitude
- σ a,max
-
maximum stress amplitude
- σ a,per
-
allowable stress amplitude
- σ c
-
critical stress
- σ D
-
fatigue strength
- σ eq
-
equivalent stress
- σ eq,max
-
maximum equivalent stress
- σ ij (t)
-
elastic stress field for a time-varying loading situation
- σ max
-
maximum stress
- σ min
-
minimum stress
- σ per
-
allowable stress
- Δσth
-
cyclic stress for which stable fatigue crack growth is possible
- σφ
-
tangential stress
- τ, Δτ
-
shear stress, cyclic shear stress
- φ
-
polar coordinate
- φ 0
-
kinking angle
- ψ 0
-
twisting angle
-
Author contributions: All the authors have accepted responsibility for the entire content of this submitted manuscript and approved submission.
-
Research funding: This project was funded by the Deutsche Forschungsgemeinschaft (DFG, German Research Foundation) – TRR 285 – Project-ID 418701707.
-
Conflict of interest statement: The authors declare no conflicts of interest regarding this article.
References
[1] H. A. Richard, G. Kullmer, B. Schramm, and A. Riemer, “Schadensvermeidung und Lebensdauerverlängerung in technischen Komponenten,” Mater. Test., vol. 53, pp. 11–12, 2011, https://doi.org/10.3139/120.110277.Search in Google Scholar
[2] H. A. Richard and M. Sander, Fatigue Crack Growth, Switzerland, Springer-Verlag, 2016.10.1007/978-3-319-32534-7Search in Google Scholar
[3] M. Boehnke, F. Kappe, B. Bobbert, and G. Meschut, “Influence of various procedures for the determination of flow curves on the predictive accuracy of numerical simulations for mechanical joining processes,” Mater. Test., vol. 63, pp. 493–500, 2021, https://doi.org/10.1515/mt-2020-0082.Search in Google Scholar
[4] C. Bielak, M. Boehnke, R. Beck, and M. Bobbert, “Numerical analysis of the robustness of clinching process considering the pre-forming of the parts,” J. Adv. Join. Proc., vol. 89, pp. 1–11, 2020. https://doi.org/10.1016/j.jajp.2020.100038.Search in Google Scholar
[5] D. Weiß, B. Schramm, and G. Kullmer, “Numerical and experimental fracture mechanical investigations of clinchable sheet metals made of HCT590X,” Key Eng. Mater., vol. 883, pp. 127–132, 2021. https://doi.org/10.4028/www.scientific.net/kem.883.127.Search in Google Scholar
[6] P. C. Paris, M. P. Gomez, and W. E. Anderson, “A rational analytic theory of fatigue,” Trend Eng., vol. 13, pp. 9–14, 1961.Search in Google Scholar
[7] F. Erdogan and M. Ratwani, “Fatigue and fracture of cylindrical shells containing a circumferential crack,” Int. J. Fracture Mech., vol. 6, pp. 379–392, 1970, https://doi.org/10.1007/BF00182626.Search in Google Scholar
[8] G. R. Forman and S. R. Mettu, “Behavior of surface and corner cracks subjected to tensile and bending loads in a Ti-6AL-4V alloy,” in Fracture Mechanics: Twenty-Second Symposium (Volume I), H. A. Ernst, A. Saxena, and D. L. McDowell, Eds., West Conshohocken Philadelphia, American Society for Testing Materials, 1992, pp. 519–546.Search in Google Scholar
[9] M. Fulland and H. A. Richard, “Application of the FE-method to the simulation of fatigue crack growth in real structures,” Steel Res., vol. 74, pp. 584–590, 2003, https://doi.org/10.1002/srin.200300236.Search in Google Scholar
[10] M. Schöllmann, M. Fulland, and H. A. Richard, “Development of a new software for adaptive crack growth simulations in 3D structures,” Eng. Fracture Mech., vol. 70, pp. 221–230, 2003, https://doi.org/10.1111/j.1460-2695.2004.00855.Search in Google Scholar
[11] G. R. Irwin, “Analysis of stresses and strains near the end of a crack traversing a plate,” J. Appl. Mech., vol. 24, pp. 361–365, 1957, https://doi.org/10.1115/1.4011547.Search in Google Scholar
[12] H. A. Richard, “Safety estimation for construction units with cracks under complex loading,” Int. J. Mater. Prod. Tech., vol. 3, pp. 326–339, 1988.Search in Google Scholar
[13] H. A. Richard, B. Schramm, and N.-H. Schirmeisen, “Cracks on mixed mode loading – theories, experiments, simulations,” Int. J. Fatigue, vol. 62, pp. 93–103, 2014, https://doi.org/10.1016/j.ijfatigue.2013.06.019.Search in Google Scholar
[14] F. Erdogan and G. C. Sih, “On the crack extension in plates under plane loading and transverse shear,” J. Basic Eng., vol. 85, pp. 529–535, 1063, https://doi.org/10.1115/1.3656899.Search in Google Scholar
[15] H. A. Richard, M. Fulland, and M. Sander, “Theoretical crack path prediction,” Fatigue Fract. Eng. Mater. Struct., vol. 28, pp. 3–12, 2005, https://doi.org/10.1111/j.1460-2695.2004.00855.x.Search in Google Scholar
[16] B. Schramm, H. A. Richard, and G. Kullmer, “Theoretical, experimental and numerical investigations on crack growth in fracture mechanical graded structures,” Eng. Fracture Mech., vol. 167, pp. 188–200, 2016, https://doi.org/10.1016/j.engfracmech.2016.05.003.Search in Google Scholar
[17] R. J. Nuismer, “An energy release rate criterion for mixed mode fracture,” Int. J. Fracture, vol. 11, pp. 245–250, 1975, https://doi.org/10.1007/BF00038891.Search in Google Scholar
[18] M. Amestoy, H. D. Bui, and K. Dang Van, “Analytical asymptotic solution of the kinked crack problem,” in Advances on Fracture Research, D. Francois, Ed., Oxford, UK, 1980, pp. 107–113.Search in Google Scholar
[19] C. F. Sih, “Strain-energy-density factor applied to mixed mode crack problems,” Int. J. Fracture, vol. 10, pp. 305–321, 1974, https://doi.org/10.1007/BF00035493.Search in Google Scholar
[20] ASTM, “Annual Book of ASTM Standards 2008, Section 3: Metals Test Methods and Analytical Procedures,” in Metals – Mechanical Testing, Elevated and Low-Temperature Tests, West Conshohocken, Pennsylvania, USA, Metallography, vol. 03. 01, E647–E6408, 2008.Search in Google Scholar
[21] M. Neuser, O. Grydin, A. Andreiev, M. Schaper, Effect of solidification rates at sand casting on the mechanical joinability of a cast aluminium alloy, Metals, vol. 11, 1304, 2021, https://doi.org/10.3390/met11081304.Search in Google Scholar
[22] A. Eberlein, “Einfluss von Mixed-Mode-Beanspruchung auf das Ermüdungsrisswachstum in Bauteilen und Strukturen,” in Fortschritt-Bericht VDI, Reihe 18: Mechanik/Bruchmechanik, vol. 344, Düsseldorf, VDI-Verlag, 2016.10.51202/9783186344182Search in Google Scholar
[23] H. A. Richard, B. Schramm, A. Eberlein, and G. Kullmer, “Cracks under Mixed Mode loading: questions and solutions for isotropic and graded materials,” in Proceedings of 13th International Conference on Fracture, Bejing, P. R. China, 2013.Search in Google Scholar
[24] D. Weiß, B. Schramm, and G. Kullmer, “Influence of plane mixed-mode loading on the kinking angle of clinchable metal sheet,” Procedia Struct Integr., vol. 39, pp. 139–147, 2022, https://doi.org/10.1016/j.prostr.2022.03.082.Search in Google Scholar
[25] K. Gunter, “Tragfähigkeitsvorhersage für Bauteile mit Kerben und Rissen,” in Fortschritt-Bericht VDI, Reihe 18: Mechanik/Bruchmechanik, vol. 152, Düsseldorf, VDI-Verlag, 1994.Search in Google Scholar
[26] H. A. Richard, M. Sander, B. Schramm, G. Kullmer, and M. Wirxel, “Fatigue crack growth in real structures,” Int.l J. Fatigue, vol. 50, pp. 83–88, 2013, https://doi.org/10.1016/j.ijfatigue.2012.02.013.Search in Google Scholar
© 2022 the author(s), published by De Gruyter, Berlin/Boston
This work is licensed under the Creative Commons Attribution 4.0 International License.
Articles in the same Issue
- Frontmatter
- In situ corrosion fatigue life of 2198-T8 Al–Li alloy based on tests and DIC technique
- Characterisation of a wire arc additive manufactured 308L stainless steel cylindrical component
- Mechanical properties of a 7075-T6 aluminum alloy at elevated temperatures
- Low-velocity single and repeated impact behavior of 3D printed honeycomb cellular panels
- Fracture mechanical evaluation of the material HCT590X
- Effects of forging on the mechanical properties of B4Cp/Al composite with flaked Al and Al2O3 particles
- Homogenization effect on precipitation kinetics and mechanical properties of an extruded AA7050 alloy
- Low velocity impact response of sandwich composites with hybrid glass/natural fiber face-sheet and PET foam core
- Earing prediction of 2090-T3 aluminum-cups using a complete homogenous fourth-order polynomial yield function
- Imitation of human muscle by using an electromechanical system
- Reptile search algorithm and kriging surrogate model for structural design optimization with natural frequency constraints
- Online magnetic flux leakage detection of inclusions and inhomogeneities in cold rolled steel plate
- Characterization of hydrogen assisted corrosion cracking of a high strength aluminum alloy
- Influence of illuminance on indication detectability during visual testing
- Quality optimization of FDM-printed (fused deposition modeling) components based on differential scanning calorimetry