Momentum and energy resolution
-
Christian Kramberger
 ,
Ryosuke Senga
,
Ryosuke Senga

Abstract
The energy and momentum transfered in an elastic scattering event from a fast electron to a plasmon are intimately linked. The in-plane (q 2D ) and out-of-plane transfered momenta (q z ) are however fundamentally distinct in a two dimensional sheet. Their different characters manifest in a sign flip of the power law scaling of momentum and energy resolved electron energy loss spectroscopy at the optical limit (q → 0). While the scattering cross section of a bulk systems diverges, the response of a dielectric sheet fades out. This makes freestanding 2D sheet materials like graphene a showcase to demonstrate momentum and energy resolution.
1 About resolution
We want to put forward that resolution in the context of electron energy loss spectroscopy (EELS) is always linked to the full width of half maximum (FWHM) of the unscattered beam. Naturally this entails on the one hand the monochromaticity and collimation of the incident beam and on the other hand the resolving power of dispersive electron optics. The final sampling density of the detection just needs to be sufficient to fully take advantage of the finesse of the beam preparation and that of the dispersive electron optics. Any further increase in sampling density by post magnification of a diffraction pattern or energy dispersed image can no longer improve the actual resolution further. The sampling density is commonly called pixel resolution, which is of course technically correct, yet arguably missleading. A noteworthy showcase of the confusion caused by interchanging angular resolution and pixel resolution can be found in ref. [1].
The most direct demonstration of energy resolution is the FWHM of the zero loss peak (ZLP) in EELS. The half width energy resolution is distinct to the Kimoto limit [2], that is concerned with discriminating EELS peaks from the tails of the ZLP. The most direct approach for demonstrating angular (viz. momentum) resolution is the FWHM of the Bragg spots (see Figure 1). We propose that the Kimoto limit of 10−3 is also applicable to diffraction or specifically in both directions in momentum resolved (ω/q) EELS maps.
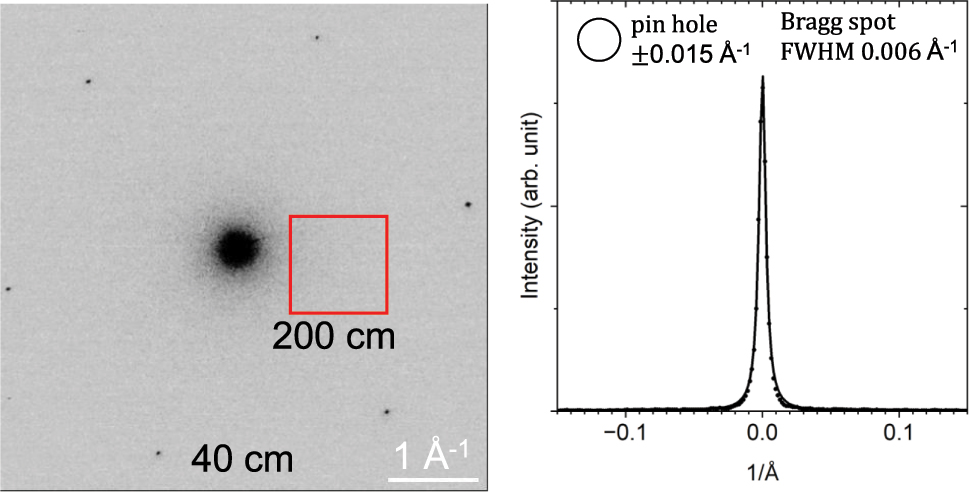
Left: overview diffraction pattern of graphene at 40 cm camera length. The inset marks the field of view at 200 cm camera length. The beam energy is 30 keV and the beam diameter is 500 nm. Right: profile of a Bragg spot with a FWHM of 0.006 Å−1. The 1 mm wide pin hole covers 65 out of 4096 pixels.
2 (ω/q) EELS maps of freestanding graphene
Angle resolved (ω/q) EELS of freestanding graphene has been pioneered in ref. [3]. There are two dispersive low energy peaks in the EELS spectrum of graphene. The response of all interband excitations or the π + σ plasmon ranges from 15 to 30 eV and has multiple features. The electronic π system features a single peak at 4.7 eV with the isotropic linear dispersion of an excitonic excitation in 2D [4], [5]. There is some debate whether or not the peaks in the loss spectra of graphene can truly be called plasmon peaks [6]. We want to point out that there is no actual distinction between a peak in the loss function (ɛ) and a single particle excitation in a 2D dielectric sheet. The absence of a zero in the real part of ɛ only means that there are no 3D bulk plasmon excitations in freestanding graphene.
We will use the name 2D plasmon, since it conveys that we refer to EELS and properly emphasizes that dimensionality plays an important role.
3 Signatures of q z
Momentum and energy depenent EELS on bulk materials is a well established method, and in particular its power law scaling towards the optical limit of zero (or neglibile) momentum transfer is q −2 [7]. While one should not take the singularity too serious, the peaks will always be weaker at larger q and the optical limit is anyways unreachable because the energy loss by itself mandates a minimum q z along the incident electron. The calculation of q z follows directly from energy and momentum conservation.

k i is the wavenumber of the incident electron. q z is the anti-paralell decelaration and q 2D the deflecting transverse momentum transfer. For energy losses of several eV and high voltages of 10s of kV and small q 2D < 1 Å−1 the relation is linear. The last line of eq. (1) is given in convenient units. At a high voltage (HV) of 30 kV and an energy loss (ℏω) of 10 eV q z amounts to 0.015 Å−1.
In bulk systems q
z
is a lower bound for the full q
3D
and prevents the
σ
□ is the sheet conductivity, which is unlike ɛ, a well defined property of freestanding graphene. The exponent of the power law switches the sign and instead of a divergence with
4 Plasmon suppression
Our highly energy (ΔE = 45 meV) and momentum (Δq 2D = 0.02 Å−1) resolved electron energy loss setup operating at 30 kV is instrumental in observing signatures of q z in freestanding graphene. [5], [10] Δq 2D is most crucial and requires full control over the diffraction limited collimation (α) over a 500 nm wide illumination. α does also account for sample specific intrinsic variations such as the ripples in freestanding graphene [11]. The collection cone (β) is defined by the camera length and diameter of the aperture. δϑ is the pixel resolution of the overview diffraction patterns that were used to assert the stability of the electron beam.
This expression with a single β is only applicable to a round pinhole type aperture, with a slit in x direction only q y would be selected, while q x is fully averaged over eq. (2).
The physical size of the camera requires a special methodology. In the first step we record the diffraction pattern with a 5 times shorter camera length and a conventional Δq 2D = 0.1 Å−1 as shown in the left panel of Figure 1. Then we zoom in to the full camera length of 2 m onto the targeted q 2D and record a loss function. The field of view corresponds to the red rectangle. In the third step we re-record the overview diffraction pattern and only if there is no detectable pixel shift (δϑ = 0.004 Å−1) in the Bragg spots we accept the measurement with Δq 2D = 0.02 Å−1.
With the Δq 2D in eq. (3) we can trace the reshaping of the loss spectrum of graphene below 0.06 Å−1. The complete surpression of the entire spectrum at the optical limit (q 2D → 0 Å−1) is clearly linked to Δq 2D = 0.02 Å−1, since the reshaping is cancelled when setting Δq 2D = 0.1 Å−1 [12]. At Δq 2D = 0.1 Å−1 the measured π plasmon is most prominent at nominal q 2D = 0 Å−1.
5 Conclusions
This focused communication puts emphasis on the role of q z in high resolution (ω/q) EELS maps and presents a technique to push the momentum resolution Δq 2D beyond the confines of field of fiew of the camera and the physical size of the entrance aperture. Just as energy and momentum are intimatedly tied together, so does high resolution EELS also require precise controll over momentum Δq and energy ΔE resolution. This combined resolution can unlock the signatures of a truly 2D dielectric sheet in freestanding graphene.
While ΔE can be directly controlled with a stable monochromator, Δq requires control over the initial diffraction limited collimation as well as the posterior selection of the solid angle and has to be confirmed by the actual FWHM of diffraction spots. The physical dimensions of the aperture and the available field of view necessiate at Δ q = 0.02 Å−1 a three step approach of overview, detailed measurement, and confirmative overview.
Funding source: ERC
Award Identifier / Grant number: MORE-TEM ERC-SYN project, grant agreement No 95121
Funding source: JST-CREST
Award Identifier / Grant number: JPMJCR1993
Award Identifier / Grant number: JPMJCR20B5
Award Identifier / Grant number: JPMJCR20B1
Acknowledgments
R.S., JC. L. and K.S. acknowledge the support for JST-CREST (JPMJCR20B1, JPMJCR20B5, JPMJCR1993). This project has received funding from the European Research Council (ERC) under the European Union\rq s Horizon 2020 research and innovation programe (MORE-TEM ERC-SYN project, grant agreement No 951215).
-
Research ethics: Not applicable.
-
Informed consent: Not applicable.
-
Author contributions: All authors have accepted responsibility for the entire content of this manuscript and approved its submission.
-
Use of Large Language Models, AI and Machine Learning Tools: None declared.
-
Conflict of interest: The authors state no conflict of interest.
-
Research funding: JST-CREST: JPMJCR20B1, JPMJCR20B5, JPMJCR1993ERC: MORE-TEM ERC-SYN project, grant agreement No 951215.
-
Data availability: Not applicable.
References
[1] P. A. Midgley, “A simple new method to obtain high angular resolution ω–q patterns,” Ultramicroscopy, vol. 76, no. 3, pp. 91–6, 1999.10.1016/S0304-3991(98)00088-6Suche in Google Scholar
[2] K. Kimoto, G. Kothleitner, G. Werner, Y. Matsui, and F. Hofer, “Advantages of a monochromator for bandgap measurements using electron energy-loss spectroscopy,” Micron, vol. 36, no. 2, pp. 185–9, 2005, https://doi.org/10.1016/j.micron.2004.11.001.Suche in Google Scholar PubMed
[3] M. K. Kinyanjui, et al.., “Direct probe of linearly dispersing 2d interband plasmons in a free-standing graphene monolayer,” Epl, vol. 97, no. 5, p. 57005, 2012, https://doi.org/10.1209/0295-5075/97/57005.Suche in Google Scholar
[4] D. Y. Qiu, G. Cohen, D. Novichkova, and S. Refaely-Abramson, “Signatures of dimensionality and symmetry in exciton band structure: Consequences for exciton dynamics and transport,” Nano Lett., vol. 21, no. 18, pp. 7644–50, 2021, https://doi.org/10.1021/acs.nanolett.1c02352.Suche in Google Scholar PubMed PubMed Central
[5] A. Guandalini, et al.., “Excitonic effects in energy-loss spectra of freestanding graphene,” Nano Lett., vol. 23, no. 24, pp. 11835–41, 2023, https://doi.org/10.1021/acs.nanolett.3c03863.Suche in Google Scholar PubMed
[6] F. J. Nelson, et al.., “Electronic excitations in graphene in the 1-50 eV range: The π and π + σ peaks are not plasmons,” Nano Lett., vol. 14, no. 7, pp. 3827–31, 2014, https://doi.org/10.1021/nl500969t.Suche in Google Scholar PubMed
[7] K. Sturm, “Dynamic structure factor: An introduction,” Zeitschrift für Naturforschung A, vol. 48, nos. 1–2, pp. 233–42, 1993, https://doi.org/10.1515/zna-1993-1-244.Suche in Google Scholar
[8] T. Sohier, M. Calandra, and F. Mauri, “Density-functional calculation of static screening in two-dimensional materials: The long-wavelength dielectric function of graphene,” Phys. Rev. B, vol. 91, no. 16, p. 165428, 2015, https://doi.org/10.1103/physrevb.91.165428.Suche in Google Scholar
[9] V. U. Nazarov, “Electronic excitations in quasi-2d crystals: what theoretical quantities are relevant to experiment?,” New J. Phys., vol. 17, no. 7, p. 073018, 2015, https://doi.org/10.1088/1367-2630/17/7/073018.Suche in Google Scholar
[10] R. Senga, K. Suenaga, P. Barone, S. Morishita, F. Mauri, and T. Pichler, “Position and momentum mapping of vibrations in graphene nanostructures,” Nature, vol. 573, pp. 247–50, 2019, https://doi.org/10.1038/s41586-019-1477-8.Suche in Google Scholar PubMed
[11] J. C. Meyer, A. K. Geim, M. I. Katsnelson, K. S. Novoselov, T. J. Booth, and S. Roth, “The structure of suspended graphene sheets,” Nature, vol. 446, no. 7131, pp. 60–3, 2007, https://doi.org/10.1038/nature05545.Suche in Google Scholar PubMed
[12] A. Guandalini, et al.., “Direct observation of the vanishing electron energy loss spectroscopy cross section in graphene,” Phys. Rev. B, vol. 111, no. 4, p. l041401, 2025, https://doi.org/10.1103/physrevb.111.l041401.Suche in Google Scholar
© 2025 the author(s), published by De Gruyter on behalf of Thoss Media
This work is licensed under the Creative Commons Attribution 4.0 International License.