Impact of drying on membrane electrode assembly morphology and performance in PEM electrolysis: insights from X-ray tomography and radiography
-
Christine Heume

 ,
Maik Plüm
,
Maik Plüm

Abstract
Proton exchange membrane electrolysis cells (PEMECs) are a crucial technology for generating “green hydrogen”, a sustainable energy carrier and versatile platform for synthesizing several chemicals. In the life cycle of a PEMEC, various process stages bare risks of accelerated aging, impacting long-term performance. In the stages of transport and storage of water-filled cell assemblies, a common practice in industry, cation contamination or frost can lead to the degradation of the membrane electrode assembly (MEA) even before its operation. Therefore, as an alternative to transporting and storing the MEA in a hydrated state, this work investigates the possibility of drying the MEA within the cell assembly under controlled conditions to prevent such degradation phenomena. Potential drying induced MEA functionality changes were analyzed using in operando methods, focusing on electrical and gas barrier properties. Butler-Volmer kinetics and electrochemical impedance spectroscopy allowed the allocation of potential performance losses to components. Furthermore, in situ and ex situ X-ray computed tomography (XCT) and optical microscopy investigations gave insights into drying-induced morphological changes within the MEA. In total, three distinct morphological changes were observed and consistently identified: membrane swelling, catalyst layer cracking, and reinforcement detachment, with each posing potential limiting factors for the scalability of the controlled drying process. Ultimately, no significant impact on electrical and gas barrier properties was observed, indicating that the drying process and morphological changes did not adversely affect the short-term operation of the PEMEC.
1 Introduction
Since the release of the hydrogen strategy for a climate-neutral Europe in 2020 by the European Commission, the framework for public and private actors has been clearly defined, emphasizing the critical role of hydrogen in the EU’s energy transition [1]. To meet the EU Commission’s ambitious vision of deploying 40 GW of renewable hydrogen electrolyzers by 2030 [1], a rapid optimization across the entire value chain of electrolyzers is necessary. Proton exchange membrane electrolysis cells (PEMEC), in particular, offer an efficient and scalable industrial solution for hydrogen production from renewably produced electricity, operating at industrial current densities exceeding 1.5 A cm−2, with a voltage efficiency of approximately 80 %, a Faraday efficiency of about 98 %, and hydrogen product gas purities as high as 99.999 % [2], [3], [4].
While scaling up production and optimizing the operational performance of PEMEC are critical, attention must also be given to intermediate process steps for a successful and rapid deployment. The life cycle of PEMEC includes various phases which all bare their own risks for inducing degradation phenomena and while most investigations focus on different conditions in long term operation [5], [6], [7], [8], [9], this work focuses on crucial intermediate processes for industrial applications, such as storage and transportation.
After cell assembly and the factory acceptance test (FAT), electrolyzers are commonly stored and transported in a ‘water-filled’ state – meaning they are fully immersed in deionized (DI) water without continuous cycling of water flow. This immersion keeps the membrane electrode assembly (MEA) and other components adequately hydrated. However, during prolonged storage, ions from minor impurities in the DI water, as well as from leaching or slow material dissolution within the cell components, can accumulate and gradually increase the water’s conductivity.
Therefore, to prevent the degradation of cell materials during storage, precautions must be taken. Impurity buildup, signaled by increased water conductivity, can lead to unwanted effects that compromise the integrity of the electrolyzer. First, impurities can trigger galvanic reactions, where slight electrical potentials between cell materials promote corrosion, or even form galvanic elements. Additionally, elevated conductivity can allow cations in the DI water to migrate into the MEA, leading to contamination [10]. These risks underscore the importance of maintaining ultra-pure water and consistently monitoring conductivity to protect the electrolyzer components. As a precaution, leaching tests could also be considered during initial material selection to identify components that are more chemically stable under storage conditions. Another critical factor during storage is that the membrane of the MEA, which separates gaseous reaction products and supports the anode and cathode catalyst layers, is particularly susceptible to frost. When water retained in the membrane freezes, it expands, introducing mechanical stress that can result in microcracks within the membrane itself, catalyst layer cracking and catalyst domain segregation. Repeated freeze-thaw cycles may exacerbate damage, leading to an overall performance degradation of the MEA [11]. An alternative to hydrated storage is dry storage, which could potentially mitigate such unintentional aging phenomena. However, it is important to note that repeated swelling and shrinking of the membrane can cause structural changes, which may degrade MEA performance and, in turn, reduce the overall efficiency and durability of the electrolyzer. Therefore, proper handling of the MEA during the drying process is crucial to minimize the risk of degradation.
During soaking and drying the proton-transport membrane absorbs and releases water molecules, leading to significant dimensional changes [12]. As the weakest component for long-term performance [13], [14], [15], this renders it particularly sensitive to such structural changes. Several studies have investigated the dimensional changes of perfluorosulfonic acid (PFSA) membranes, focusing on their anisotropic behavior – specifically, the differences between swelling in the thickness direction and in-plane swelling [16], [17], [18], [19], [20], [21], [22], [23], [24], [25], [26], [27], [28], [29], [30], [31], [32]. Their review reveals that, although PFSA membranes show distinct anisotropy, with swelling rates varying between thickness and in-plane directions, there is evidence suggesting that swelling in the thickness direction may be slightly higher than in the in-plane directions [21], [25], [26], [27], [29], [33]. However, membranes reinforced with expanded polytetrafluoroethylene (PTFE) show a significant reduction in in-plane swelling by a factor of roughly 10 [12], [25], [33]. Similarly, it was observed that adding support materials results in nearly the same water uptake in a PFSA/PTFE/PFSA sandwich structure as in a pure PFSA membrane. However, this reinforcement also led to anisotropic volume changes: the supported membrane expanded by 1 % in one in-plane direction and 5 % in the other, while it experienced a reversible 20 % change in the thickness direction [25]. This behavior arises from variations in deformation properties like the elasticity of the PFSA matrix and the reinforcement structure. In the study presented here, a web-reinforced PFSA membrane was investigated, so similar anisotropic behavior is expected [34].
The anisotropic swelling of the membrane generates mechanical stress across the entire MEA, which can result in crack formation in both the membrane and catalyst layers, and may even lead to delamination of the catalyst layers [35], introducing significant safety risks due to gas crossover, where reactant gases can mix and cause hazardous conditions. Moreover, this process can create a self-reinforcing mechanism: as gas crossover occurs, it promotes chemical degradation of the membrane, leading to increased gas crossover and further chemical degradation [35], [36], [37]. This cyclical degradation can substantially reduce the overall efficiency of the PEMEC system [38], [39], [40].
In this work, to examine the impact of dried storage, we investigate how the swelling and shrinking of the membrane, driven by flooding and drying, affect the MEA’s morphology and operational performance. To achieve this, we developed a comprehensive analysis protocol including the controlled drying and rehydration of the MEA within a PEMEC test setup with a cell size of 25 cm2 at ambient pressure. Combining this protocol with observations from ex situ and in situ X-ray computed tomography (XCT) allowed us to observe resulting morphological changes in detail. Our goal is to gain a deeper understanding of how membrane swelling and shrinking affect the MEA structure and performance. This knowledge will enable us to develop protocols to prevent or mitigate degradation, ultimately enhancing the longevity of PEMEC systems, which is essential for their scalability.
2 Methods
2.1 PEMEC materials
The applied MEA consists of a semi-crystalline PFSA copolymer composite with Poly(methyl methacrylate) (PMMA) web-reinforcement, enhancing its mechanical stability. The anode catalyst layer was iridium black-based, and the cathode catalyst layer was based on carbon supported platinum, with both catalysts applied via decal transfer process at an industry-standard loading in the milligram range. For the anodic electrolysis cell components, current collectors made from 3.7025 titanium and a titanium stretch-metal porous transport layer (PTL) was utilized. The cathodic half-cell featured a current collector from 1.4404 steel, along with multiple PTLs composed of 1.4404 steel and graphite.
2.2 In operando testing infrastructure
In this study, a single-cell setup developed by Siemens Energy, with an active area of 25 cm2, was integrated into a standardized, self-constructed automated test rig, enabling controlled conditions for process water (grade 2, ISO 3696:1987), including the measurement of its electrical conductivity, as well as flow rates, temperature, and pressure. To analyze the gas composition a gas chromatograph (Thermo Fisher Trace 1310) with a thermal conductivity detector was used. A schematic and more detailed description of the cell setup and implementation of gas crossover measurements can be found in the Supplementary Figure S1. All electrical characterization experiments in this work are performed using a BioLogic VMP-300 potentiostat with a 110 A booster.
2.3 In o perando testing protocol: electrical and gas barrier performance analysis
Electrolysis operation was conducted at 60 °C and 100 mbarg, with both anodic and cathodic process water flow rates set to 300 mL min−1. The experimental data was collected according to the process protocol shown in Figure 1. The protocol comprises of a short-run operation of the PEMEC, referred to as conditioning, which encompasses both pre-treatment and break-in [41]. A total of eight samples were analyzed, four of which were dried during the experiment, while the others remained hydrated throughout the protocol as reference.
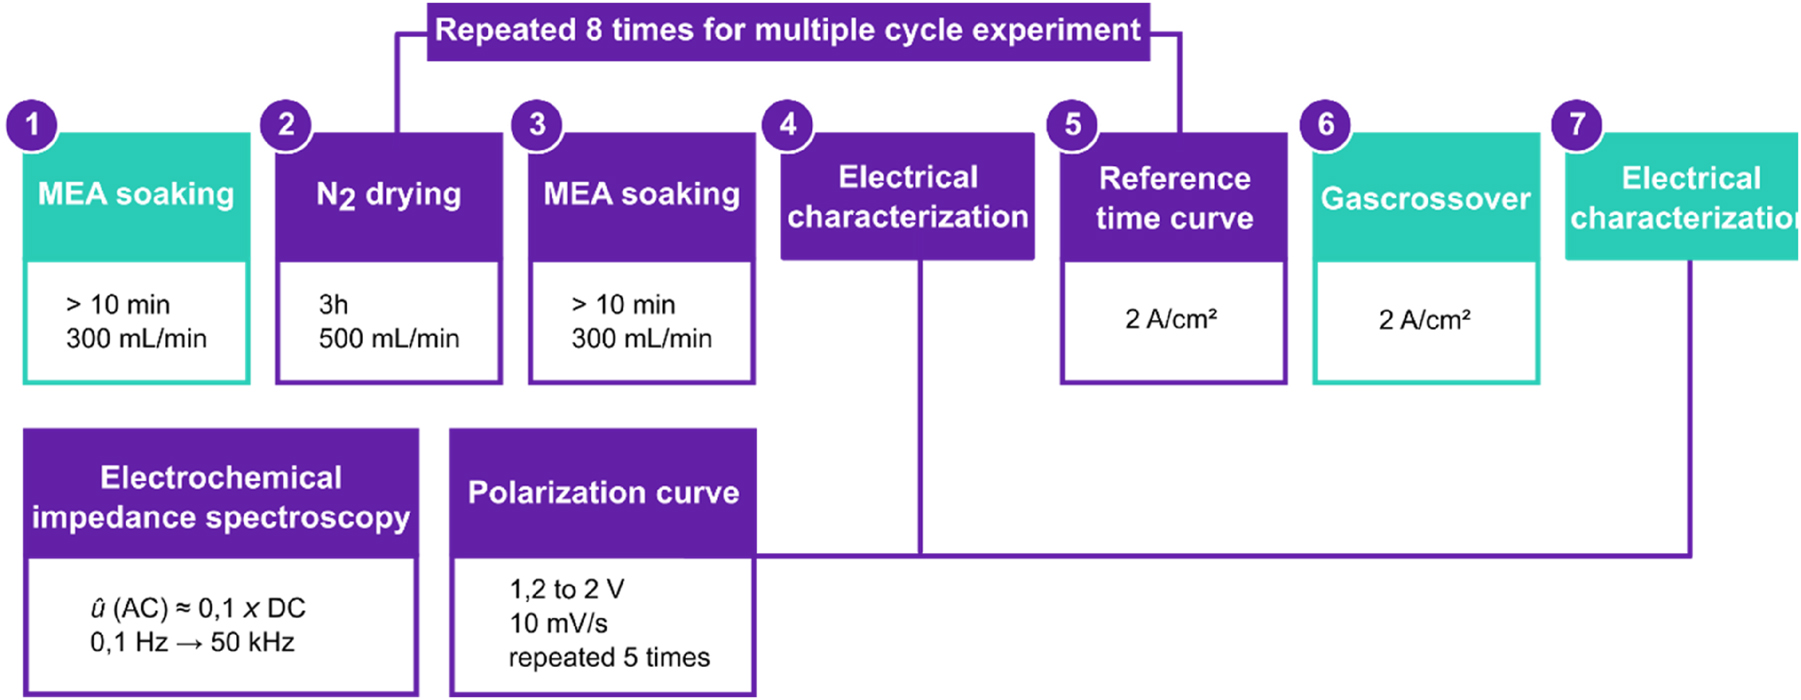
Process protocol of the electrolytic operation. All samples went through step 1–7 once. Step 2–5 was repeated 8 times for multiple cycled samples. Electrical characterization consists of polarization curves under potentiostatic mode and electrical impedance spectroscopy. For the reference samples that weren’t dried the drying in step 2 was omitted.
The process protocol follows 7 steps which were performed in all electrochemical operations to ensure and assess a comparable state of health of the electrolyzer. The MEA was built in the cell at ambient conditions in a dry state. In the first step, the PEMEC is flushed with water at a rate of 300 mL min−1 for at least 10 min to ensure a proper hydration of the MEA. Subsequently, in step 2, the cell was flushed with dry nitrogen at a controlled flow rate of 500 mL -min−1 for 3 h at 60 °C. For the reference MEAs that remained hydrated throughout the protocol, step 2 was omitted. During the nitrogen flush, a dew point sensor (MBW DP 3-D) was used to monitor the drying state of the MEAs by measuring the humidity in the gas stream at the cell outlet. The accuracy of these dew point readings was confirmed by preceding gravimetric measurements, which showed how much water was removed during the drying process. These tests confirmed that the system reached a relative humidity of 5 % after drying. Relative humidity is defined as 100 % when the MEA is fully hydrated and 0 % when the MEA is vacuum dried at 60 °C, close to the asymptotic minimum. For comparison, under typical ambient conditions (21.5 °C and 33 % relative humidity), the relative humidity in the system was around 10 % while drying.
In step 3, the PEMEC was rehydrated under the same conditions described in step 1. After sufficient rehydration, electrical characterization was carried out in step 4 using polarization curve under potentiostatic mode (IV-curve) and galvanostatic electrochemical impedance spectroscopy (GEIS). The IV-curve was performed by sweeping the potential from 1.2 V to 2 V at a scan rate of 10 mV s−1. This cycle was repeated five times for each sample. Following this, GEIS measurements were taken over a frequency range from 0.1 Hz to 50 kHz, with an AC amplitude of approximately 10 % of the applied DC. For break-in, a constant current of 2 A cm−2 was applied to the cell for 15 h in step 5. In step 6, gas crossover was recorded at a current density of 2 A cm−2. Finally, the electrical characterization outlined in step 4 was repeated in step 7.
All eight samples underwent the complete procedure from step 1 to step 7. However, for two of these samples, steps 2–5 were repeated eight times where one sample was repeatedly dried, while the other remained hydrated as a reference. The PEMECs operated according to the above-mentioned approach for a single cycle are designated as “0D+1B and 1D+1B”. In this regard, 0D denotes no drying, 1D indicates one-time drying, and 1B represents one-time break-in. For repeated cycles, the samples are assigned as “0D+8B and 8D+8B”. Additionally, the current in step 5 was applied for only 1 h, instead of 15 h for these two samples. This adjustment was made to investigate the gas composition in the product gases of the repeatedly cycled samples. A summary of the samples, including their applied process protocols, is provided in Table 1.
Summary of non-dried (blue) and dried (yellow) samples included in the in operando testing protocol.
 |
After completing the in operando testing protocol, all MEAs were carefully removed from the cell and stored in an airtight, padded container filled with DI water to preserve the samples for subsequent post-test analysis using X-ray computed tomography.
2.4 X-ray computed tomography imaging
To capture morphological changes in the MEAs both in situ and ex situ the ZEISS Xradia Versa 620 was used. Initially, an in situ experiment on a separate sample was conducted to monitor morphological changes during the drying of a MEA using radiography. Subsequently, after identifying effects of drying in situ, the samples, which were dried under controlled conditions within the cell setup, underwent an ex situ analysis to further examine the observed changes and their effect on their operational performance.
In situ XCT analysis: In the in situ analysis, morphological changes in the MEA were documented using both tomograms (3D) and radiograms (2D). The experiment began with the acquisition of a tomogram of the pristine and hydrated MEA, which was housed in a custom-built Kapton sample holder, submerged in DI water. This initial tomogram was captured using an X-ray tube voltage of 80 kV paired with a low-pass filter to exclude low-energy photons, which could potentially affect the integrity of the membrane [40]. By employing a combination of geometrical and optical (20×) magnification, a voxel size of 0.74 µm was achieved. The tomogram consisted of 1,600 projections, each with an exposure time of 10 s. Following the acquisition of the pristine-state tomogram, the water in the sample holder was carefully removed to initiate the drying process under ambient conditions. To improve the visibility of morphological changes and contrast within the MEA, the sample holder was centered between source and detector to enhance phase contrast in the XCT setup. Two-dimensional radiograms were taken to rapidly capture any morphological changes occurring within the MEA in situ. Every 6 s, a new frame with an exposure time of 1.5 s was captured, ensuring adequate temporal resolution. A total of 15,500 frames were recorded during the drying process, which was deemed concluded after 27 h when no further morphological changes were observed. The applied X-ray tube voltage during this stage remained at 80 kV, using the same low-pass filter as for the tomogram. However, unlike the tomogram, the optical magnification was adjusted to 4×, increasing the field-of-view and resulting in a pixel size of 1.1 µm for each radiogram. Overall, this setup enabled the quick acquisition of images, allowing to observe morphological changes, such as crack propagation within the catalyst layers, in real time.
After the completed drying of the MEA, a final tomogram was captured at the same position as the pristine-state tomogram using a reduced X-ray tube voltage of 60 kV, as the absence of water in the sample holder reduced X-ray absorption and scattering, allowing for effective imaging with lower energy. Combined with the low-pass filter and an optical magnification of 20×, the voxel size resulted again in 0.74 µm. This tomogram also consisted of 1,600 projections, each with an exposure time of 7.5 s, and was used for comparative 3D analysis to assess the morphological changes relative to the sample’s pristine state.
During the drying process captured by radiography, the ZEISS scanner’s accessible application programming interface (API) enabled fully automated acquisition of the radiograms. Parameters such as exposure, voltage and filter settings were programmed into a PYTHON script. The optimal parameters and positioning for the radiograms were manually determined beforehand using the ZEISS XCT’s Scan&Scout software. Note, that the tomograms depicting the pristine and dried state were triggered manually.
Ex situ XCT analysis: With a size of 5 cm × 5 cm, the MEAs for the ex situ analysis displayed a high aspect ratio. To reduce this and improve the quality of the XCT scans, central pieces measuring 2 cm × 2 cm were cut from the MEAs and placed inside an in-house 3D-printed tube with a diameter of 8 mm in a rolled-up state. This rolling significantly reduces the high aspect ratio, ensuring that the MEAs are evenly exposed to X-rays from all angles. To maintain the MEAs in a constant hydrated state and prevent drying during the measurements, the tube was filled with DI water (< 0.1 μS cm−1) and sealed.
Ex situ analysis was performed on all MEAs, including reference samples as well as those that had undergone either a single drying and rehydration process or multiple cycles. All tomograms, consisting of 1,600 projections, were acquired using an X-ray tube voltage of 70 kV and a low-pass filter. With an optical magnification of 20×, the tomograms had a voxel size ranging from 0.68 µm to 0.7 µm, and exposure times varied between 10 and 12 s.
2.5 Ex situ light microscopy analysis
In-plane (XY) and thickness (Z) variations of the membrane due to swelling and drying were measured using light microscopy with the Keyence VHX-7000. An optical magnification of up to 180× was used for the XYZ analysis. For thickness measurements, the membrane was placed between two microscope slides with light pressure applied to ensure accurate readings.
3 Results
3.1 In-plane and thickness swelling of web-reinforced membrane
The swelling behavior of the web-reinforced membrane was investigated using light microscopy. Samples were analyzed in both their pristine dry and hydrated state to assess dimensional changes. The results are shown in Figure 2. The fully hydrated membrane exhibits an average increase in relative in-plane (X, Y) length of 2 %, and an 18 % increase in thickness (Z) compared to the pristine membrane stored under ambient conditions. Upon drying the membrane under a vacuum at 60 °C, shrinkage occurs, reducing the in-plane and thickness dimensions to below those of the pristine state. However, it is clear that the five investigated samples show a high level of statistical variation, as the membrane morphology adopts a wavy shape when hydrated and dehydrated.

Anisotropic swelling behavior of the investigated web-reinforced PFSA membrane. The measurement of the pristine dry state was used as a base line for the relative length changes.
3.2 Morphological changes identified by in situ XCT
Given that the swelling and shrinking may cause mechanical damage within the MEA, the entire drying process under ambient conditions was monitored using in situ XCT. To capture morphological changes, rapid acquisition by radiography was employed, enabling the detailed observation of the 27-h drying process. This approach allowed for the identification of four distinct stages, which are outlined in the following. The corresponding video of the drying process showcasing these stages is provided in the Supplementary Materials S2.
In Stage 1 (0–9 h), which began with the removal of water from the sample holder to initiate the drying process, no morphological changes were observed during the first 9 h. However, during Stage 2 (9–12 h), a pronounced, non-linear deformation occurred within the MEA. Since Nafion membranes are well known to swell during water uptake [12], the reverse process occurs during drying, leading to shrinkage. It is therefore likely that the non-linear deformation can be attributed to substantial drying-induced shrinkage in the XYZ-planes of the membrane, especially in the thickness direction, as shown in Figure 2. Moreover, decreasing relative humidity has been shown to induce mechanical stresses in the membrane [17], with reports showing, that under relative humidity cycling, membrane deformation was directly associated with crack formation in the electrode layers [42]. However, during Stage 2, the non-linear movement of the MEA complicated the detection of crack formation. Yet, it is likely that electrode cracks nucleated during this stage. As the drying process progressed into Stage 3 (12–19 h), the shrinkage subsided. Without the non-linear deformation in this stage, it was possible to detect newly formed cracks and monitor their propagation. Finally, in Stage 4 (19–27 h), crack propagation slowed, and the overall deformation rate of the MEA decreased, facilitating more accurate tracking of crack development. Notably, a new morphological change emerged during this stage: the detachment of the web-reinforcement fibers embedded within the PFSA matrix. This detachment was identified by a weak phase contrast at the reinforcement boundaries, attributed to the formation of cavities within the membrane surrounding the fibers.
However, although rapid radiography allowed for the in situ observation of morphological changes, it only provides two-dimensional images, making it difficult to pinpoint the exact location of cracks in either the anode or the cathode for example. To overcome this limitation and accurately determine the location of newly formed cracks, three-dimensional tomography was performed both before and after the drying of the MEA. This approach offered clear insights into the precise locations of the cracks and allowed for a detailed investigation of morphological changes in comparison with the pristine state in 3D.
The results of the tomographic analysis are presented in Figure 3. Here the through-plane projections of the anode (Figure 3a and d), the membrane with fiber web-reinforcement (Figure 3b and e) and the cathode (Figure 3c and f) are shown before and after drying. Notably, no significant morphological changes are observable within the anode post the drying. When comparing the pristine state of the PFSA matrix to its dried state, the detachment of the reinforcement fibers from the PFSA matrix, that occurred in Stage 4 of the drying process, is visible (Figure 3e). This detachment is evidenced by darker contrast regions surrounding the fibers, indicating the formation of cavities within the membrane. In the cathode, large cracks that propagated during drying are visible. Initially, a pre-existing crack with a length of 90 µm, marked with blue arrows, can be observed in the cathode before drying (Figure 3c). Throughout the drying process, this crack propagated to a final length of 220 µm, as shown in the three-dimensional segmentation of the crack in Figure 3f. Furthermore, it is significant that the propagation of this crack, along with the formation of new cracks, highlighted in purple, occurs directly above the reinforcement fibers embedded in the PFSA matrix. This suggests that the reinforcement fibers introduce additional mechanical stress into the MEA during the drying process, ultimately contributing to catalyst layer cracking.
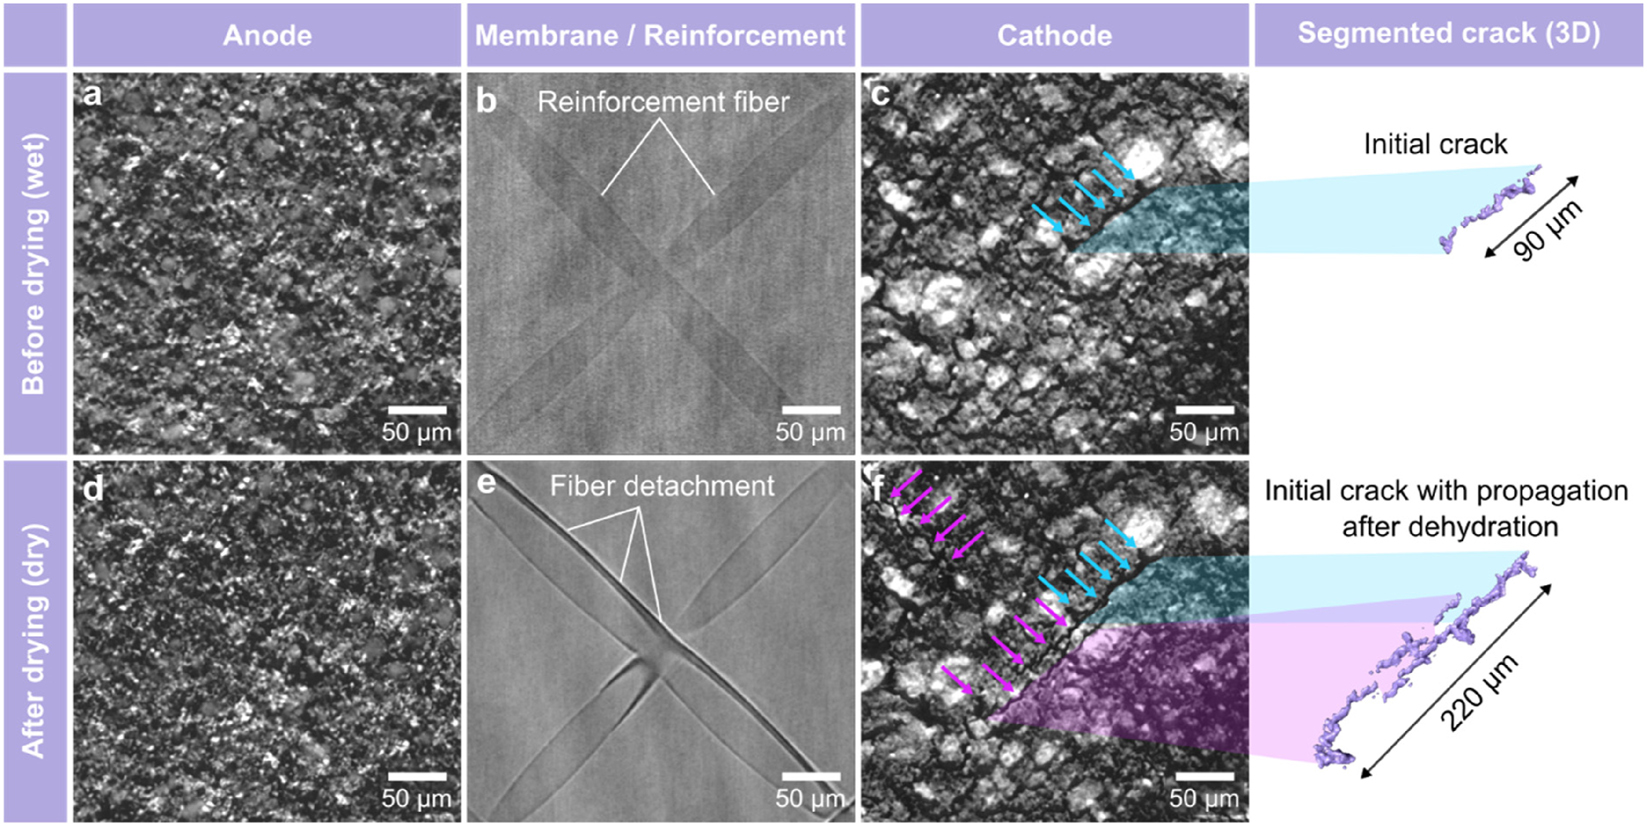
Through-plane projections of the XCT measurement showcasing the anode, web-reinforced membrane and cathode before (a, b, c) and after (d, e, f) the drying process. The detachment of reinforcement fibers (e) and crack propagation, highlighted in purple (f), are visible.
3.3 Morphological changes identified by ex situ XCT
Based on the detected morphological changes in the MEA during the in situ drying under ambient conditions, the in operando testing protocol within the cell setup was implemented to control the drying process of multiple MEAs. After analyzing the electrical and gas barrier performance within the cell setup, the MEAs were examined ex situ by XCT to determine whether the observed morphological changes are reversible or could be prevented by controlled drying inside the cell setup.
Unlike the in situ XCT analysis, where the cathode showed visible cracking, the controlled drying experiments in the cell setup did not result in significant morphological changes in the cathode. The anode, however, appeared to be more susceptible to surface cracking in the cell setup. Figure 4a–d shows through-plane projections of the anode comparing the reference samples to the ones that underwent the single drying and rehydration process and the multiple-cycle experiments. When directly comparing the anode of the MEAs that were not dried (Figure 4a and b), it is evident that multiple cycles lead to increased morphological changes within the anode, as the through-plane projection of the multiple-cycled anode displays larger areas of dark, low-intensity pixels, which are indicative of cracks or catalyst layer reorganization. When comparing the MEAs that were dried (Figure 4c and d), both single-process and multiple-cycled MEAs exhibit significantly increased anode cracking. To quantify this, the area fraction of low-intensity pixels for each projection of the anode was calculated, with the results displayed in Figure 4e. In the pristine hydrated state, the cracks within the anode have an area fraction of (2.2 ± 0.4) %. Following a single in operando test without drying, the area fraction of cracks remained stable at (2.2 ± 0.1) %. However, when dried once, the fraction increased significantly to (6.7 ± 0.2) %. After multiple operational cycles, the MEA that was kept hydrated showed about 8 % of anode cracking, which rose to 11.5 % within the MEA that was dried multiple times. As shown in the through-plane projection of the multiple dried MEA in Figure 4d, large cracks (highlighted by yellow arrows) mostly appear directly above the reinforcement fibers embedded in the PFSA matrix. Additionally, holes inside the anode catalyst layer (highlighted with blue circles) can be observed where the reinforcement fibers intersect within the membrane. These results support the previous assumption from in situ XCT observations that the reinforcement fibers contribute to mechanical stress on the catalyst layer during drying, ultimately leading to increased cracking.

Through-plane projections of the XCT measurement showcasing the anode before (a, b) and after (c, d) drying, comparing single step and multiple cycled MEAs. (e) Area fraction of cracks and voids within the anode in the pristine dry state, after a single step and multiple steps of drying and rehydration compared to the reference samples that were kept hydrated throughout the measurement protocol.
The catalyst layer cracking above the reinforcement fibers, observed in the in situ XCT experiment, was also prominent in the ex situ analysis after the rehydration of the MEAs. However, the reinforcement detachment (Figure 3e) seen during the in situ XCT measurement was not detected after in operando testing. It is therefore highly likely that the rehydration process, which causes the membrane composite to swell, leads to the closure of cavities formed during drying, indicating that the detachment may be a, surprisingly, reversible process.
3.4 Electrical performance and gas crossover
After analyzing the morphological changes caused by MEA drying utilizing XCT, this section presents a comparative evaluation of PEMEC operational performance with and without the implementation of a drying step in the pre-treatment step of the conditioning process. Three electrical performance indicators were assessed: the Tafel slope and differential resistance from the IV-curve, and the ohmic resistance from electrochemical impedance spectroscopy measurements. Additionally, two non-electrical indicators – hydrogen and oxygen crossover – were recorded. Figure 5 presents the electrochemical characterization of a PEMEC that underwent a break-in process without a drying step during the pre-treatment (hereafter referred to as 0D+1B, where D represents drying and B denotes break-in). Figure 5a illustrates a distinct difference in the IV-curve before and after the break-in step of conditioning. At a cell voltage of 1.6 V, the initial current density was 0.39 A cm−2, which increased to 0.53 A cm−2 following the break-in process. This increase is even more pronounced at 1.8 V, possibly due to the continuous formation of water channels through hydration and osmotic drag, which subsequently enhances proton conductivity [41], [43]. This improvement is primarily attributed to a decrease in differential and ohmic resistance, indicating a reduction in overall cell resistance.
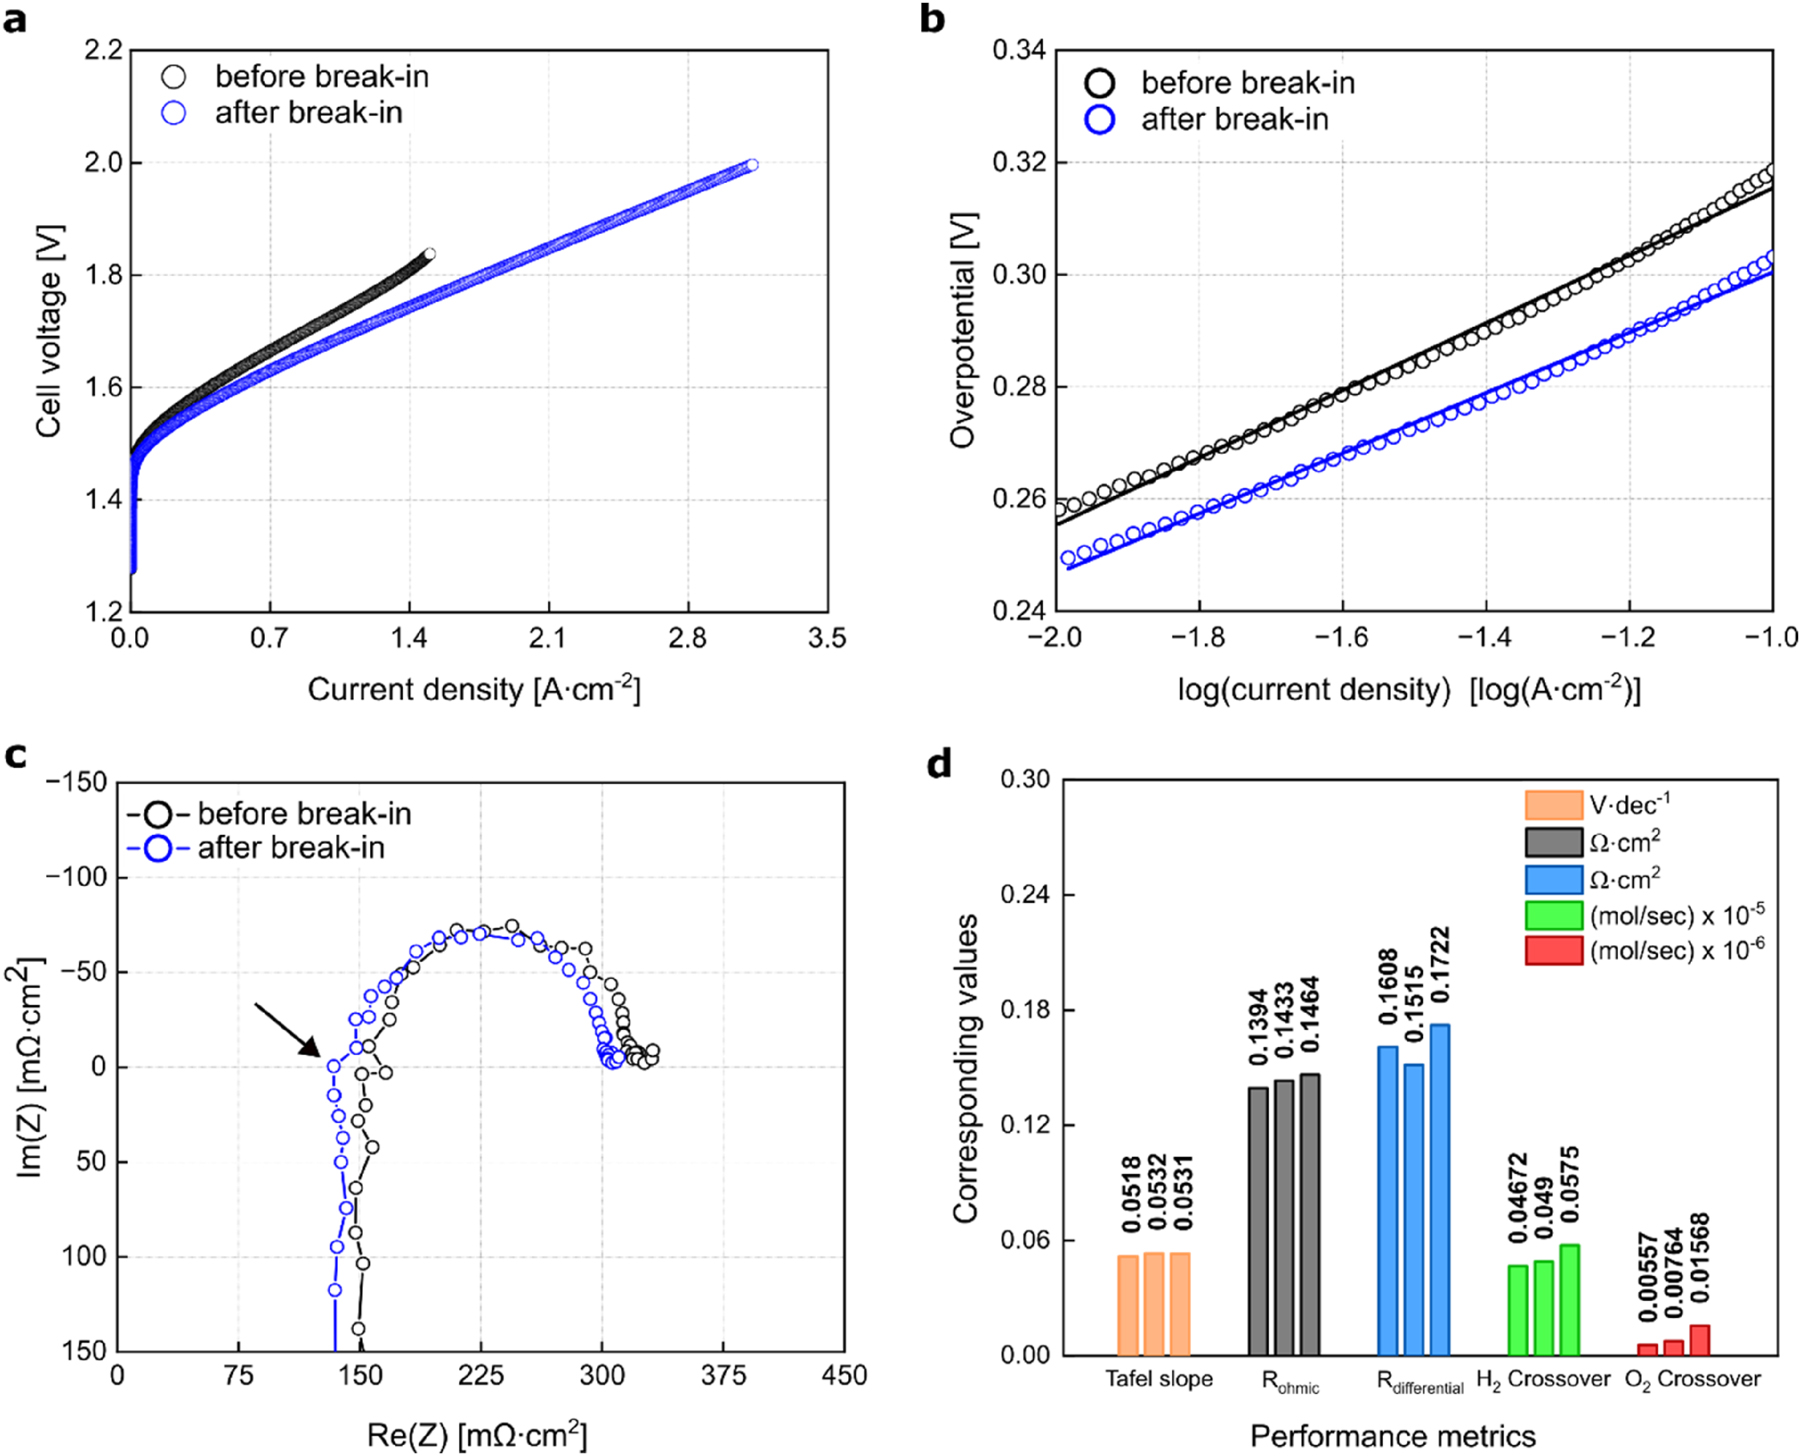
Impact of the break-in step on the PEMEC, conditioned via procedure, involves no drying in the pre-treatment step (0D+1B). (a) IV-curve, (b) Tafel slope, (c) impedance measured at 100 mA cm−2, and (d) electrical and non-electrical performance indicators of three nominally identical PEMECs. The black arrow in (c) marks the intersection with the real axis.
To evaluate the impact of conditioning on reaction kinetics, the Tafel slope was selected to assess changes in the intrinsic properties of the catalyst. Figure 5b presents a Tafel plot within the range of 10 mA cm−2 to 100 mA cm−2. The Tafel slope, calculated before and after the break-in process, decreased from 60 mV dec−1 to 53 mV dec−1, accompanied by a notable reduction in overpotential. This decrease is primarily attributed to the partial oxidation of the OER catalyst [44], [45], [46]. The post-conditioning slope indicates improved catalyst performance, aligning with findings in existing literature [47].
To further examine the performance increase resulting from the break-in process, electrochemical impedance spectroscopy (EIS) was conducted at 0.1 A cm−2.
Figure 5c shows the Nyquist plot, illustrating impedance spectra (real vs imaginary parts) in the range of low to high frequencies. The capacitive component (negative imaginary) displays a depressed semicircle, with its intersection on the real axis enabling the calculation of the ohmic resistance (shown in the graph by a black arrow). An equivalent circuit model was used to determine the ohmic resistance, as previously published [41]. A slight decrease in ohmic resistance was observed after the PEMEC underwent the break-in step, indicating improved conductivity. Increasing the frequency causes the capacitive response to shift to an inductive response, which is an unwanted effect resulting from a time-varying magnetic field induced by an alternating current. This response might arise from external setup components or parasitic effects [48].
To validate these findings, three PEMECs were operated using the same protocol (0D+1B), showing an interplay in Tafel slope, differential losses, and ohmic losses. Figure 5d summarizes the performance indicators of these three PEMECs after conditioning. The higher hydrogen crossover compared to oxygen is typical for such systems due to hydrogen’s smaller size and lower molecular weight [49], [50]. All three MEAs from the same batch exhibited this trend. Notably, the sample with the highest hydrogen crossover also demonstrated the highest oxygen crossover, indicating a correlation between the two. Even though the three MEAs were fabricated from the same batch and conditioned identically, slight variations in membrane hydration and prehistory can lead to minor observable differences in nanostructure and gas permeability [51]. The calculated electrical performance indicators (Tafel slope and ohmic resistance) reveal a clear correlation: the cell with the lowest ohmic resistance also exhibits the lowest Tafel slope. This indicates that, during the conditioning process, minute differences in the swelling behavior of the MEA and reorganization of ionomer network can potentially influence the contact resistance and, consequently, kinetics. However, these differences in both electrical and non-electrical performance indicators are marginal and inevitable. Therefore, the arithmetic mean and standard deviation were calculated, with the margin of error visualized in Figure 6.
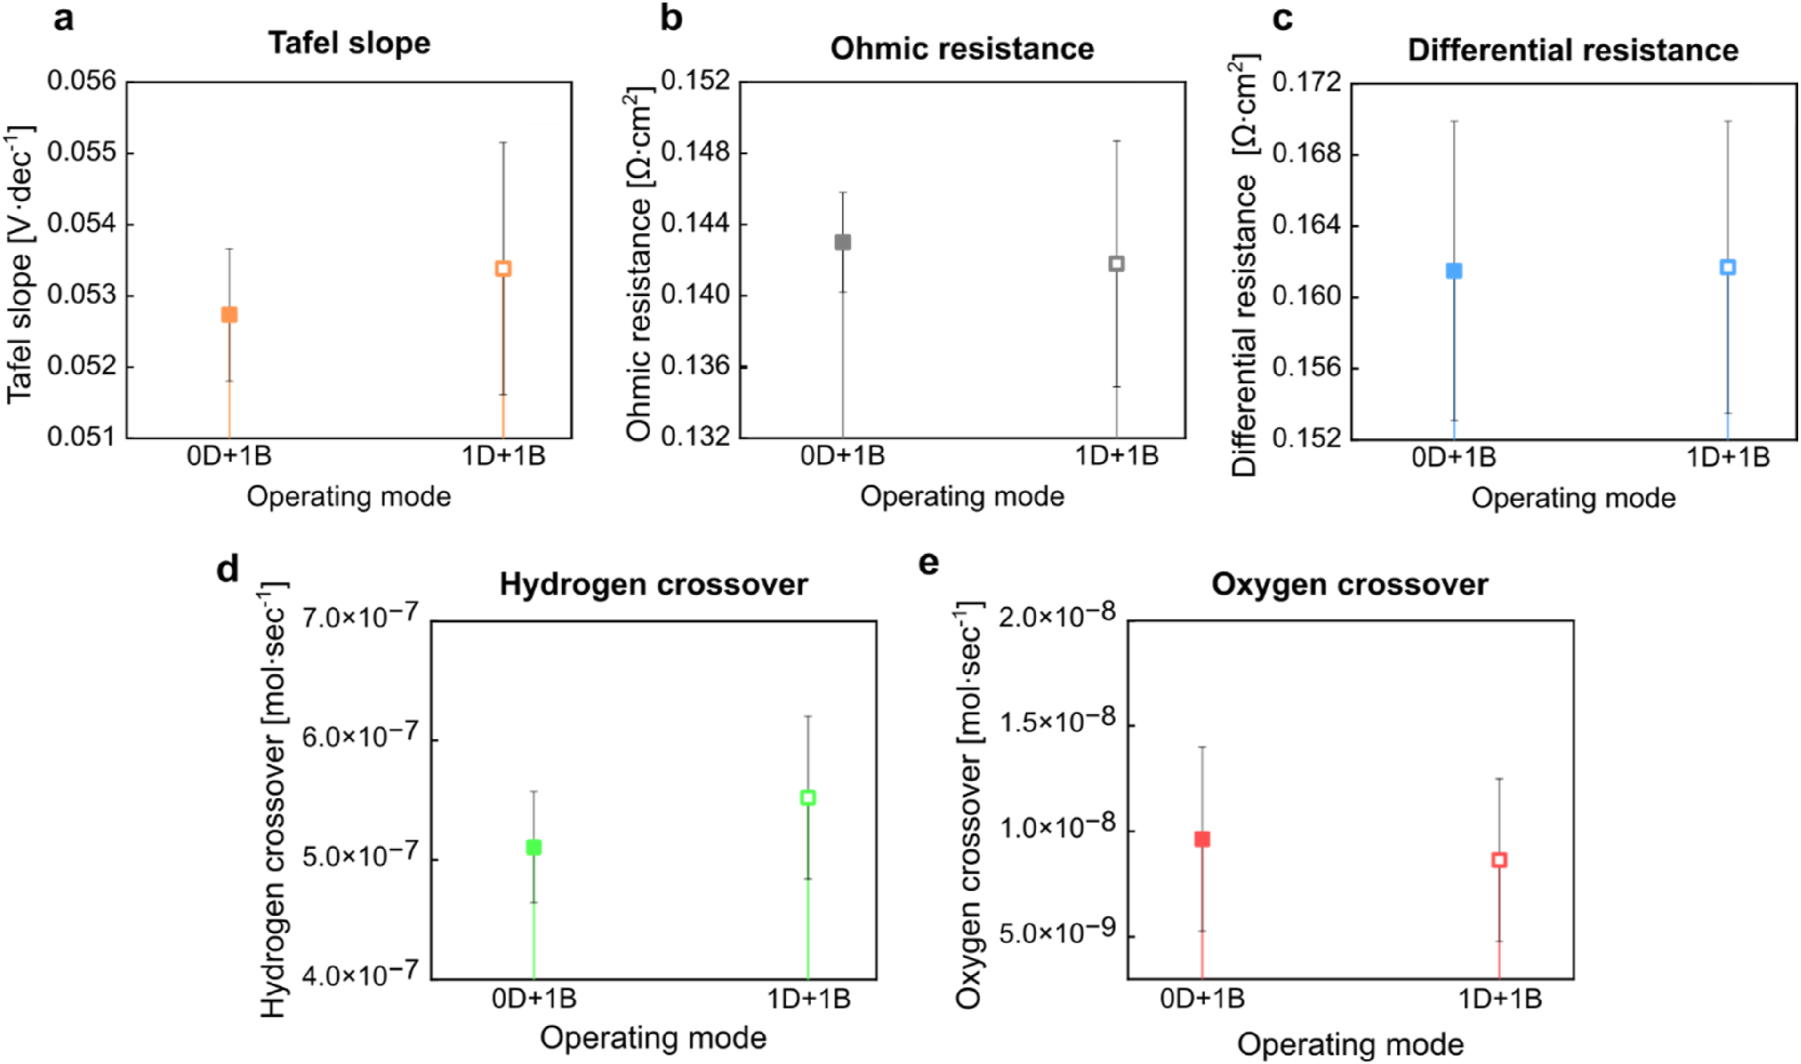
Impact of two different conditioning procedures (0D+1B and 1D+1B) on the performance indicators of PEMECs in operation. Solid symbols correspond to conditioning without drying, while the hollow symbols refer to conditioning with drying in the pre-treatment step. Despite the average values of performance indicators indicating a shift in PEMEC performance, the variations remain within the error margins.
To investigate the impact of drying on performance, three PEMECs with pristine MEAs underwent pre-treatment with an additional drying step before operation, following the 1D+1B protocol. Figure 6 compares the average performance indicators between the 0D+1B and 1D+1B procedures. The increase in Tafel slope after 1D+1B suggests a decline in reaction kinetics, possibly due to changes in contact resistance caused by catalyst layer rearrangement and crack formation. These fractures may also modify the ionomer network, creating new proton pathways that reduce ohmic resistance. Additionally, crack formation is expected to increase both hydrogen and oxygen crossover (Figure 6). A potential side reaction, where permeating oxygen reacts with produced hydrogen on the platinum surface, could explain the observed reduction in detected oxygen crossover (Figure 6) [52].
To determine whether drying exacerbates crack formation and impacts electrical performance, two PEMECs with pristine MEAs underwent eight cycles of conditioning – one without drying (0D+8B) and one with drying (8D+8B). Figure 7 illustrates the variation in performance indicators as the number of cycles increases. Without drying, the Tafel slope increased notably over the repeated cycles, showing an offset in kinetics. This trend may result from substantial morphological changes arising from the continuous hydration during pre-treatment and break-in. As shown in Figure 4, the area fraction of dark, low-intensity pixels increased from 2.2 % to 8 % when comparing single-cycle to multiple-cycle conditioning, highlighting the extent of these structural changes.

Comparison of performance indicators of two PEMECs repeatedly cycled without (0D+8B) and with (8D+8B) a drying step within the pre-treatment phase of conditioning. Bars with blue borders refer to (0D+8B). (a) Tafel slopes, (b) ohmic resistances from impedance at 10 mA cm−2, (c) differential resistances from IV-curve, (d) hydrogen crossover, and (e) oxygen crossover.
Such decline in performance may be attributed to changes in the distribution of the ionomer network, potentially affecting proton conductivity and overall cell efficiency. Both ohmic and differential resistances increased, which may be ascribed to the repeated swelling of the membrane, which in turn enhanced hydrogen crossover. Meanwhile, oxygen crossover decreased significantly, likely due to a parasitic reaction between hydrogen and oxygen occurring on the platinum surface. Despite substantial performance loss, no cracks in the catalyst surface were captured (Figure 4b).
In contrast, the overall decline in performance for the PEMEC subjected to multiple drying cycles (8D+8B) is unexpectedly smaller, despite the observed cracks (Figure 4d and e). The interaction among the performance indicators is complex. The repeated drying cycles likely induced mechanical stress in the form of shrinkage (as shown in Figure 3), but rehydration caused reswelling, possibly to a lesser extent than in the cells without drying. Reduced swelling, in turn, may result in lower hydrogen crossover. Besides, the propagation of cracks potentially exposed additional active surfaces of the catalyst. Resulting morphological changes may impede access to some of the active sites, which may explain the continuous decline in performance with extended operation cycles. No noticeable changes in oxygen crossover are evident in Figure 7e.
Figure S3 shows that oxygen crossover continues to decrease in a similar manner compared to the PEMEC without drying. Initially, oxygen crossover was minimal but increased significantly during the second cycle, suggesting that the cracks likely intensified at this drying stage. The comparison of oxygen crossover at the start and end of the cyclic operation reveals no significant variation. Comprehensive investigations are required to fully differentiate the effects of drying from no drying, necessitating the complete conditioning of PEMECs for a valid comparison. In the repeated cycle tests, the break-in step was conducted for 1 h, while in the single-cycle test, the break-in duration was 15 h. Although the formation of cracks has not significantly impacted performance in this study, their long-term effects might still lead to performance degradation and increases in gas crossover.
4 Conclusion
In this study we utilized in situ and ex situ X-ray computed tomography (XCT) to investigate the morphological changes occurring in membrane electrode assemblies (MEAs) upon drying and subsequent rehydration. Two different drying protocols were applied: in the in situ XCT setup, the MEA was dried under ambient conditions for 27 h until no further morphological changes were observed (10 % relative humidity), while in the cell setup, it was dried over 3 h under constant nitrogen flow, with humidity monitored to ensure proper drying (5 % relative humidity). Although these protocols differ, it is expected that the MEA undergoes similar morphological changes in both methods, as evidenced by electrode cracking being a key finding in both studies. Our results also highlight the detachment of reinforcement fibers leaving cavities within the membrane, which at first glance could potentially lead to gas crossover and pose safety risks in green hydrogen production. However, upon rehydration the detachment of reinforcement fibers appears to be reversible, most likely due to the swelling behavior of the membrane itself, and no increase in gas crossover was detected. Additionally, no pinholes or cracks in the membrane were detected by the XCT study. Despite the observed catalyst cracking and reinforcement detachment, the electrical and gas barrier properties of the PEMEC showed only minor changes after a single drying cycle, which did not become significant even after eight cycles of drying and rehydration, especially when compared to a reference sample not exposed to repeated drying cycles.
The phenomena identified in this study should be relevant to both smaller and larger electrolyzer scales. The extent of these effects may vary with scale, particularly as larger active areas could amplify the impact of in-plane and thickness swelling. Therefore, careful consideration must be given to the hydration state of the MEA during its installation in stacks or cells, as it plays a critical role ensuring proper sealing and contact within the system. Installing the MEA in a dry state appears to not negatively impact performance if initial hydration within the stack does not lead to contact or sealing issues as it was demonstrated here on 25 cm2 scale.
Overall, this work provides valuable insights into the mechanical stress on MEAs caused by drying and rehydration cycles, highlighting the importance of considering morphological changes during scaling, installation and hydrated storage to ensure optimal performance and longevity of electrolyzer systems. Further investigation into these phenomena at larger scales will be essential for the development of robust and durable PEMEC designs.
Funding source: Bundesministerium für Bildung und Forschung
Award Identifier / Grant number: 03HY122
Acknowledgments
The authors gratefully acknowledge the financial support by the German Federal Ministry of Education and Research (BMBF) within the H2Giga project DERIEL (grant number 03HY122).
-
Research ethics: Not applicable.
-
Informed consent: Not applicable.
-
Author contributions: All authors have accepted responsibility for the entire content of this manuscript and approved its submission. Conceptualization: CH, MP, KD. Methodology: CH, MP, KD. Investigation: CH, MP, AJ, KD. Visualization: CH, MP, AJ. Funding acquisition: GS, RE. Project administration: EJ, AK, GS, RE. Supervision: KD, AJ, EJ, AK, GS, RE. Writing – original draft: CH, MP, AJ. Writing – review & editing: CH, MP, AJ, KD, AK, GS, RE.
-
Use of Large Language Models, AI and Machine Learning Tools: None declared.
-
Conflict of interest: The authors state no conflict of interest.
-
Research funding: This research was funded by the German Federal Ministry of Education and Research (BMBF) within the H2Giga project DERIEL (grant number 03HY122).
-
Data availability: The data that support the findings of this study are available from the corresponding author, CH, upon reasonable request.
References
[1] E. Commission, A Hydrogen Strategy for a Climate-Neutral Europe, Melbourne, VIC, Australia, Global CCS Institute, 2020.Suche in Google Scholar
[2] M. Carmo, D. L. Fritz, J. Mergel, and D. Stolten, “A comprehensive review on PEM water electrolysis,” Int. J. Hydrogen Energy, vol. 38, no. 12, pp. 4901–4934, 2013. https://doi.org/10.1016/j.ijhydene.2013.01.151.Suche in Google Scholar
[3] Y. Wang, Y. Pang, H. Xu, A. Martinez, and K. S. Chen, “PEM fuel cell and electrolysis cell technologies and hydrogen infrastructure development–a review,” Energy Environ. Sci., vol. 15, no. 6, pp. 2288–2328, 2022. https://doi.org/10.1039/d2ee00790h.Suche in Google Scholar
[4] K. E. Ayers, et al.., “Research advances towards low cost, high efficiency PEM electrolysis,” ECS Trans., vol. 33, no. 1, p. 3, 2010. https://doi.org/10.1149/1.3484496.Suche in Google Scholar
[5] S. Z. Oener, M. J. Foster, and S. W. Boettcher, “Accelerating water dissociation in bipolar membranes and for electrocatalysis,” Science, vol. 369, no. 6507, pp. 1099–1103, 2020. https://doi.org/10.1126/science.aaz1487.Suche in Google Scholar PubMed
[6] J. Xu, et al.., “IrOx ⋅ nH2O with lattice water-assisted oxygen exchange for high-performance proton exchange membrane water electrolyzers,” Sci. Adv., vol. 9, no. 25, p. eadh1718, 2023. https://doi.org/10.1126/sciadv.adh1718.Suche in Google Scholar PubMed PubMed Central
[7] M. Chandesris, V. Médeau, N. Guillet, S. Chelghoum, D. Thoby, and F. Fouda-Onana, “Membrane degradation in PEM water electrolyzer: numerical modeling and experimental evidence of the influence of temperature and current density,” Int. J. Hydrogen Energy, vol. 40, no. 3, pp. 1353–1366, 2015. https://doi.org/10.1016/j.ijhydene.2014.11.111.Suche in Google Scholar
[8] S. A. Grigoriev, K. A. Dzhus, D. G. Bessarabov, and P. Millet, “Failure of PEM water electrolysis cells: case study involving anode dissolution and membrane thinning,” Int. J. Hydrogen Energy, vol. 39, no. 35, pp. 20440–20446, 2014. https://doi.org/10.1016/j.ijhydene.2014.05.043.Suche in Google Scholar
[9] A. Javed, et al.., “Exploring the state-of-operation of proton exchange membrane electrolyzers,” Int. J. Hydrogen Energy, vol. 98, pp. 280–294, 2025, https://doi.org/10.1016/j.ijhydene.2024.12.055.Suche in Google Scholar
[10] M. Schalenbach, et al.., “The effect of ion exchange poisoning on the ion transport and conduction in polymer electrolyte membranes (PEMs) for water electrolysis,” J. Electrochem. Soc., vol. 169, no. 9, p. 094510, 2022. https://doi.org/10.1149/1945-7111/ac9087.Suche in Google Scholar
[11] Q. Guo and Z. Qi, “Effect of freeze-thaw cycles on the properties and performance of membrane-electrode assemblies,” J. Power Sources, vol. 160, no. 2, pp. 1269–1274, 2006. https://doi.org/10.1016/j.jpowsour.2006.02.093.Suche in Google Scholar
[12] A. Kusoglu and A. Z. Weber, “New insights into perfluorinated sulfonic-acid ionomers,” Chem. Rev., vol. 117, no. 3, pp. 987–1104, 2017. https://doi.org/10.1021/acs.chemrev.6b00159.Suche in Google Scholar PubMed
[13] Q. Feng, G. Liu, B. Wei, Z. Zhang, H. Li, and H. Wang, “A review of proton exchange membrane water electrolysis on degradation mechanisms and mitigation strategies,” J. Power Sources, vol. 366, pp. 33–55, 2017, https://doi.org/10.1016/j.jpowsour.2017.09.006.Suche in Google Scholar
[14] P. Millet, A. Ranjbari, F. De Guglielmo, S. A. Grigoriev, and F. Auprêtre, “Cell failure mechanisms in PEM water electrolyzers,” Int. J. Hydrogen Energy, vol. 37, no. 22, pp. 17478–17487, 2012. https://doi.org/10.1016/j.ijhydene.2012.06.017.Suche in Google Scholar
[15] S. Stucki, G. G. Scherer, S. Schlagowski, and E. Fischer, “PEM water electrolysers: evidence for membrane failure in 100 kW demonstration plants,” J. Appl. Electrochem., vol. 28, no. 10, pp. 1041–1049, 1998. Available at: https://doi.org/10.1023/a:1003477305336.10.1023/A:1003477305336Suche in Google Scholar
[16] Q. Zhao and J. Benziger, “Mechanical properties of perfluoro sulfonated acids: the role of temperature and solute activity,” J. Polym. Sci. B Polym. Phys., vol. 51, no. 11, pp. 915–925, 2013. https://doi.org/10.1002/polb.23284.Suche in Google Scholar
[17] Z. Lu, M. Lugo, M. H. Santare, A. M. Karlsson, F. C. Busby, and P. Walsh, “An experimental investigation of strain rate, temperature and humidity effects on the mechanical behavior of a perfluorosulfonic acid membrane,” J. Power Sources, vol. 214, pp. 130–136, 2012, https://doi.org/10.1016/j.jpowsour.2012.04.094.Suche in Google Scholar
[18] Q. Zhao, N. Carro, H. Y. Ryu, and J. Benziger, “Sorption and transport of methanol and ethanol in H+-nafion,” Polymer, vol. 53, no. 6, pp. 1267–1276, 2012. https://doi.org/10.1016/j.polymer.2012.01.050.Suche in Google Scholar
[19] D. R. Morris and X. Sun, “Water-sorption and transport properties of nafion 117 H,” J. Appl. Polym. Sci., vol. 50, no. 8, pp. 1445–1452, 1993. https://doi.org/10.1002/app.1993.070500816.Suche in Google Scholar
[20] Y. Li, et al.., “Experimental measurement of stress and strain in nafion membrane during hydration cycles,” J. Electrochem. Soc., vol. 159, no. 2, p. B173, 2011. https://doi.org/10.1149/2.065202jes.Suche in Google Scholar
[21] Y. Tang, A. Kusoglu, A. M. Karlsson, M. H. Santare, S. Cleghorn, and W. B. Johnson, “Mechanical properties of a reinforced composite polymer electrolyte membrane and its simulated performance in PEM fuel cells,” J. Power Sources, vol. 175, no. 2, pp. 817–825, 2008. https://doi.org/10.1016/j.jpowsour.2007.09.093.Suche in Google Scholar
[22] F. Bauer, S. Denneler, and M. Willert-Porada, “Influence of temperature and humidity on the mechanical properties of Nafion® 117 polymer electrolyte membrane,” J. Polym. Sci. B Polym. Phys., vol. 43, no. 7, pp. 786–795, 2005. https://doi.org/10.1002/polb.20367.Suche in Google Scholar
[23] E. H. Sanders, et al.., “Characterization of electrosprayed nafion films,” J. Power Sources, vol. 129, no. 1, pp. 55–61, 2004. https://doi.org/10.1016/j.jpowsour.2003.11.020.Suche in Google Scholar
[24] G. Blumenthal, M. Cappadonia, and M. Lehmann, “Investigation of the proton transport in Nafion® membranes as a function of direction, temperature and relative humidity,” Ionics, vol. 2, no. 2, pp. 102–106, 1996. https://doi.org/10.1007/bf02375802.Suche in Google Scholar
[25] S. Shi, A. Z. Weber, and A. Kusoglu, “Structure/property relationship of nafion XL composite membranes,” J. Membr. Sci., vol. 516, pp. 123–134, 2016, https://doi.org/10.1016/j.memsci.2016.06.004.Suche in Google Scholar
[26] A. Kusoglu, et al.., “Constitutive response and mechanical properties of PFSA membranes in liquid water,” J. Power Sources, vol. 195, no. 2, pp. 483–492, 2010. https://doi.org/10.1016/j.jpowsour.2009.08.010.Suche in Google Scholar
[27] G. Gebel, P. Aldebert, and M. Pineri, “Swelling study of perfluorosulphonated ionomer membranes,” Polymer, vol. 34, no. 2, pp. 333–339, 1993. https://doi.org/10.1016/0032-3861(93)90086-p.Suche in Google Scholar
[28] J. Peron, et al.., “Properties of Nafion® NR-211 membranes for PEMFCs,” J. Membr. Sci., vol. 356, no. 1–2, pp. 44–51, 2010. https://doi.org/10.1016/j.memsci.2010.03.025.Suche in Google Scholar
[29] T. Uchiyama, M. Kato, Y. Ikogi, and T. Yoshida, “Mechanical degradation mechanism of membrane electrode assemblies in buckling test under humidity cycles,” J. Fuel Cell Sci. Technol., vol. 9, no. 6, p. 061005, 2012. https://doi.org/10.1115/1.4007814.Suche in Google Scholar
[30] T. Uchiyama, M. Kato, and T. Yoshida, “Buckling deformation of polymer electrolyte membrane and membrane electrode assembly under humidity cycles,” J. Power Sources, vol. 206, no. 5, pp. 37–46, 2012. https://doi.org/10.1016/j.jpowsour.2012.01.073.Suche in Google Scholar
[31] M. P. Rodgers, J. Berring, S. Holdcroft, and Z. Shi, “The effect of spatial confinement of Nafion® in porous membranes on macroscopic properties of the membrane,” J. Membr. Sci., vol. 321, no. 1, pp. 100–113, 2008. https://doi.org/10.1016/j.memsci.2008.01.007.Suche in Google Scholar
[32] S. Hink, D. Henkensmeier, J. H. Jang, H.-J. Kim, J. Han, and S.-W. Nam, “Reduced in-plane swelling of nafion by a biaxial modification process,” Macromol. Chem. Phys., vol. 216, no. 11, pp. 1235–1243, 2015. https://doi.org/10.1002/macp.201500063.Suche in Google Scholar
[33] Y. Tang, A. M. Karlsson, M. H. Santare, M. Gilbert, S. Cleghorn, and W. B. Johnson, “An experimental investigation of humidity and temperature effects on the mechanical properties of perfluorosulfonic acid membrane,” Mater. Sci. Eng. A, vol. 425, no. 1–2, pp. 297–304, 2006. https://doi.org/10.1016/j.msea.2006.03.055.Suche in Google Scholar
[34] J. Kink, M. Ise, B. Bensmann, P. Junker, and R. Hanke-Rauschenbach, “Structural mechanics analysis of woven web reinforced membranes in proton exchange membrane water electrolysis,” J. Electrochem. Soc., vol. 170, no. 11, p. 114513, 2023. https://doi.org/10.1149/1945-7111/ad0663.Suche in Google Scholar
[35] E. Wallnöfer-Ogris, et al.., “A review on understanding and identifying degradation mechanisms in PEM water electrolysis cells: insights for stack application, development, and research,” Int. J. Hydrogen Energy, vol. 65, pp. 381–397, 2024, https://doi.org/10.1016/j.ijhydene.2024.04.017.Suche in Google Scholar
[36] A. Sadeghi Alavijeh, et al.., “Decay in mechanical properties of catalyst coated membranes subjected to combined chemical and mechanical membrane degradation,” Fuel cells, vol. 15, no. 1, pp. 204–213, 2015. https://doi.org/10.1002/fuce.201400040.Suche in Google Scholar
[37] Y. P. Patil, W. L. Jarrett, and K. A. Mauritz, “Deterioration of mechanical properties: a cause for fuel cell membrane failure,” J. Membr. Sci., vol. 356, no. 1–2, pp. 7–13, 2010. https://doi.org/10.1016/j.memsci.2010.02.060.Suche in Google Scholar
[38] C. Liu, J. Wrubel, E. Padgett, and G. Bender, “The impacts of membrane pinholes on PEM water electrolysis,” J. Power Sources, vol. 581, p. 233507, 2023, https://doi.org/10.1016/j.jpowsour.2023.233507.Suche in Google Scholar
[39] A. Martin, et al.., “The effect of cell compression and cathode pressure on hydrogen crossover in PEM water electrolysis,” J. Electrochem. Soc., vol. 169, no. 1, p. 014502, 2022. https://doi.org/10.1149/1945-7111/ac4459.Suche in Google Scholar
[40] J. A. Wrubel, C. Milleville, E. Klein, J. Zack, A. M. Park, and G. Bender, “Estimating the energy requirement for hydrogen production in proton exchange membrane electrolysis cells using rapid operando hydrogen crossover analysis,” Int. J. Hydrogen Energy, vol. 47, no. 66, pp. 28244–28253, 2022. https://doi.org/10.1016/j.ijhydene.2022.06.155.Suche in Google Scholar
[41] N. Wolf, et al.., “Tuning proton exchange membrane electrolytic cell performance by conditioning nafion N115-based membrane electrode assemblies,” Electrochem. Sci. Adv., vol. 5, no. 3, p. e202400038, 2025. https://doi.org/10.1002/elsa.202400038.Suche in Google Scholar
[42] Y. Singh, et al.., “Mitigation of mechanical membrane degradation in fuel cells by controlling electrode morphology: a 4D in situ structural characterization,” J. Electrochem. Soc., vol. 168, no. 3, p. 034521, 2021. https://doi.org/10.1149/1945-7111/abef87.Suche in Google Scholar
[43] M. Maier, K. Smith, J. Dodwell, G. Hinds, P. R. Shearing, and D. J. L. Brett, “Mass transport in PEM water electrolysers: a review,” Int. J. Hydrogen Energy, vol. 47, no. 1, pp. 30–56, 2022. https://doi.org/10.1016/j.ijhydene.2021.10.013.Suche in Google Scholar
[44] R. Kötz, H. Neff, and S. Stucki, “Anodic iridium oxide films: XPS-studies of oxidation state changes and,” J. Electrochem. Soc., vol. 131, no. 1, p. 72, 1984. https://doi.org/10.1149/1.2115548.Suche in Google Scholar
[45] P. Lettenmeier, et al.., “Nanosized IrOx–Ir catalyst with relevant activity for anodes of proton exchange membrane electrolysis produced by a cost-effective procedure,” Angew. Chem., Int. Ed., vol. 55, no. 2, pp. 742–746, 2016. https://doi.org/10.1002/anie.201507626.Suche in Google Scholar PubMed
[46] J. Ahn and R. Holze, “Bifunctional electrodes for an integrated water-electrolysis and hydrogen-oxygen fuel cell with a solid polymer electrolyte,” J. Appl. Electrochem., vol. 22, no. 12, pp. 1167–1174, 1992. https://doi.org/10.1007/bf01297419.Suche in Google Scholar
[47] W. Wang, et al.., “Exploring the impacts of conditioning on proton exchange membrane electrolyzers by in situ visualization and electrochemistry characterization,” ACS Appl. Mater. Interfaces, vol. 14, no. 7, pp. 9002–9012, 2022. https://doi.org/10.1021/acsami.1c21849.Suche in Google Scholar PubMed
[48] I. Franzetti, A. Pushkarev, A.-L. Chan, and T. Smolinka, “Parasitic effects in impedance spectrum of PEM water electrolysis cells: case study of high-frequency inductive effects,” Energy Technol., vol. 11, no. 12, p. 2300375, 2023. https://doi.org/10.1002/ente.202300375.Suche in Google Scholar
[49] M. Schalenbach, T. Hoefner, P. Paciok, M. Carmo, W. Lueke, and D. Stolten, “Gas permeation through nafion. Part 1: measurements,” J. Phys. Chem. C, vol. 119, no. 45, pp. 25145–25155, 2015. https://doi.org/10.1021/acs.jpcc.5b04155.Suche in Google Scholar
[50] T. Sakai, H. Takenaka, N. Wakabayashi, Y. Kawami, and E. Torikai, “Gas permeation properties of solid polymer electrolyte (SPE) membranes,” J. Electrochem. Soc., vol. 132, no. 6, p. 1328, 1985. https://doi.org/10.1149/1.2114111.Suche in Google Scholar
[51] K. A. Mauritz and R. B. Moore, “State of understanding of nafion,” Chem. Rev., vol. 104, no. 10, pp. 4535–4586, 2004. https://doi.org/10.1021/cr0207123.Suche in Google Scholar PubMed
[52] S. A. Grigoriev, et al.., “Hydrogen safety aspects related to high-pressure polymer electrolyte membrane water electrolysis,” Int. J. Hydrogen Energy, vol. 34, no. 14, pp. 5986–5991, 2009. https://doi.org/10.1016/j.ijhydene.2009.01.047.Suche in Google Scholar
Supplementary Material
This article contains supplementary material (https://doi.org/10.1515/mim-2025-0011).
© 2025 the author(s), published by De Gruyter on behalf of Thoss Media
This work is licensed under the Creative Commons Attribution 4.0 International License.