Geographic structure of Chinese dialects: a computational dialectometric approach
-
He Huang
 ,
Jack Grieve
,
Jack Grieve

Abstract
Dialect classification is a long-standing issue in Chinese dialectology. Although various theories of Chinese dialect regions have been proposed, most have been limited by similar methodological issues, especially due to their reliance on the subjective analysis of dialect maps both individually and in the aggregate, as well as their focus on phonology over syntax and vocabulary. Consequently, we know relatively little about the geolinguistic underpinnings of Chinese dialect variation. Following a review of previous research in this area, this article presents a theory of Chinese dialect regions based on the first large-scale quantitative analysis of the data from the Linguistic Atlas of Chinese Dialects, which was collected between 2000 and 2008, providing the most up-to-date picture of the full Chinese dialect landscape. We identify and map a hierarchy of 10 major Chinese dialect regions, challenging traditional accounts. In addition, we propose a new theory of Chinese dialect formation to account for our findings.
1 Introduction
Chinese is a group of language varieties that forms the Sinitic branch of the Sino-Tibetan family. It is the mother tongue of 1.2 billion people, approximately 16 % of the World’s population. Understanding the geographic structure of Chinese dialects and the relationships between these dialects is important because it allows us to better understand the history of Sinitic languages, which is crucial for resolving questions about the formation of the linguistic landscape in eastern Eurasia, as well as processes of language variation and change more generally.
Linguistic studies of Chinese dialects have flourished for over a century in China, with a focus on extensive fieldwork, historical phonology, and the classification of dialect areas. Modern Chinese dialectologists have primarily carried out their work following the paradigm introduced by Karlgren (1915), who applied European-style historical linguistics principles to Chinese dialects, concentrating on historical phonology. Karlgren (1915) proposed a hypothesis, generally accepted by Chinese dialectologists today, that most Chinese dialects developed from Middle Chinese. The exception is Min, which shows independent developments from Old Chinese and preserves many ancient characteristics. Min is generally considered the most conservative Chinese dialect.
The analysis of historical phonology is complicated, however, by the fact that the Chinese writing system is ideographic, precluding the direct analysis of pronunciation based on historical documents. Fortunately, the phonology of Middle Chinese was recorded by the Qieyun, a rhyme dictionary first published in 601 CE, followed by several revised and expanded editions, presenting a compromise between northern and southern pronunciations from the late Northern and Southern Dynasties period (420–589 CE) (Norman 1988). Specifically, the Qieyun provides information about which words share the same phonological categories,[1] allowing for the phonetic values of Middle Chinese’s phonological categories to be reconstructed through the comparative analysis of cognates in Chinese dialects. Moreover, Middle Chinese phonology is used as a framework for the study and description of various modern Chinese dialects. This framework is a useful and concise way to describe the phonological correspondences between Chinese dialects and provides a basis for reconstructing the historical development of Middle Chinese into modern Chinese dialects. For example, as illustrated in Table 1, three rhymes (represented by α, β, γ) in Middle Chinese are fully merged in dialect A, and partially merged in dialect B, while rhyme α is split into two classes conditioned by the initial categories in dialect C (ε, δ).
Middle Chinese phonology as a description framework of Chinese dialects.
| Dialects | Rhymes in Middle Chinese | |||
|---|---|---|---|---|
| *α | *β | *γ | ||
| A | α | |||
| B | α | γ | ||
| C | ε | δ | β | γ |
For a long time, Chinese dialectologists have been enthusiastic about discussing the relationship between dialects by observing which dialects share sound changes based on this paradigm. However, this paradigm places too much emphasis on phonology, neglects vocabulary and syntax, and emphasizes a diachronic rather than a synchronic perspective. As a result, our understanding of Chinese dialects is limited, although, in recent years, growing variationist and syntactic research on Chinese dialects have begun to complement work in traditional dialectology (Huang 2018; Liu 2020; Sheng 2014; Shi 2016).
In addition to research on historical phonology, dialect classification is a long-standing issue in Chinese dialect research, of considerable interest to contemporary Chinese dialectologists. This tradition dates back to Yang Xiong (53 BCE–18 CE), a famous literary scholar during the Han dynasty (206 BCE–220 CE), who spent 27 years surveying the dialects of China, collecting about 9,000 dialect characters before editing the first Chinese dialect dictionary Fangyan (Ding 1991; Li 2003). This dictionary did not record the precise location of informants or divide China into dialect regions, but it listed a series of linguistic alternations and the cultural regions where the variants of these alternations were used, much like modern dialect atlases. We can only infer the dialect areas at that time based on these records. Even after the introduction of modern methods for linguistic analysis in China, this traditional challenge has continued to attract the attention of Chinese dialectologists. Dozens of articles have been published, and various schemes have been proposed. Tang (2018) provides a brief introduction to the academic history of this subject. The number of major dialect areas varies from 3 to 10. The most influential three schemes are shown in Figure 1, while the relationship between these dialect areas is summarized in Table 2. The colored areas in Figure 1 correspond to regions where Chinese dialects predominate, whereas the blank areas correspond to regions where non-Sinitic languages predominate. The colors and the capitalized names indicate dialect groups in these maps, while the main cities in each region are labeled in lowercase.

The most influential three schemes of the identification of Chinese dialect areas.
Correspondence among three schemes.
| Scholar | 1 | 2 | 3 | 4 | 5 | 6 | 7 | 8 | 9 | 10 |
|---|---|---|---|---|---|---|---|---|---|---|
| Yuan (2001: 22) | Mandarin | Wu | Xiang | Gan | Min | Hakka | Yue | |||
| Li (1987) | Jin | Mandarin | Hui | Wu | Xiang | Gan | Min | Hakka | Yue | Ping |
| Norman (1988: 181–183) | Northern Group | Central Group | Southern Group | |||||||
Yuan (2001: 22)[2] proposed a scheme dividing Chinese dialects into seven groups. This scheme summarizes the views of previous scholars. Although the criteria are quite vague (“taking the history of dialect formation and development into consideration, including geography”), this system forms the basis of many other schemes. Alternatively, Li (1987) divided Chinese dialects into ten groups, which might be the most authoritative and widely accepted scheme in the past 30 years.[3] In this system, the Jin dialect, mainly located in Shanxi province, is separated from Mandarin, while the Hui dialect in the south of Anhui and the Pinghua dialect, mainly spoken in Guangxi, are regarded as independent groups. Although Li (1987) lists the phonological characteristics of each dialect area he identified, the criteria for defining these dialect areas have never been specified. Finally, Norman (1988) proposed a three-way division. His proposal is different from the other schemes in various ways. First, his goal was not to demarcate the traditional dialect regions individually, but rather to propose ten diagnostic features as a framework for classification along a dialect continuum: the dialects that satisfy all the conditions are in the northern group, the dialects that satisfy some of the conditions are in the central group, and the dialects that satisfy none of the conditions are in the southern group. Second, he considered phonological, lexical, and syntactic variation, unlike other studies, which focused solely on phonological variation. Finally, the criteria he used to define the three groups are clear and consistent, rather than being justified in an ad hoc manner. Still, Norman’s method does not eliminate selection bias: the process of feature selection already implies what the results will be, and ten diagnostic features are far too few to capture the full complexity of Chinese dialects.
In addition to disagreements between these schemes, four fundamental issues related to the distribution of Chinese dialect regions remain unresolved. To discuss these issues, it is necessary to refer to various place names, major river systems, and mountain ranges. Figure 2 therefore presents a map of China with the relevant features marked for the convenience of the reader. On the map of China, which includes provincial capitals and boundaries, we have marked the main rivers and mountains that play a vital role in forming Chinese dialects. The dark blue line indicates the main natural rivers, and the arrows indicate the Yellow River, the Huaihe River, the Yangtze River, and the Pearl River. The light blue line indicates the Beijing-Hangzhou Canal, which was dug in the Sui Dynasty (581–619 CE) to connect Beijing and Hangzhou, as well as other cities along the line. It is a crucial waterway transport channel in East China. The red triangle indicates major mountain ranges, which appear to be closely related to the formation of Chinese dialects: Taihang Mountain, Lüliang Mountain, Qinling Mountain, and the mountain ranges we call “longitudinal barriers”. To the east of Taihang Mountain is the vast North China Plain. There are also mountainous lands that run north and south between Taihang and Lüliang Mountains. The Qinling Mountains and the Huaihe River mentioned above form the climate and cultural boundary between the south and the north of China. The “longitudinal barrier” in the southeast constitutes a north-south geographical barrier from the Huangshan and Tianmu Mountains to the Yushan and Wuyi Mountains. This physical barrier also appears to play a significant role in the formation of Chinese dialects. In addition, we mark the place names that will be mentioned in our analysis, which are mainly distributed in East and North China.

Toponymy and place names in China.
The first issue concerns the degree of dialect differences. Generally speaking, the differences among Chinese dialects are considerable, similar to the Romance language family in Europe (Norman 1988). Most scholars believe that Mandarin’s internal differences are minimal, while the non-Mandarin dialects of Chinese exhibit large internal differences (Li and Xiang 2009: 114; Wang and Wang 2004; Xu 1991; Yuan 1960). However, recent linguistic analysis has shown that internal differences in Mandarin are not as small as initially thought (Szeto and Yurayong 2021; Zavyalova and Astrakhan 1998). For example, Szeto et al. (2018) explore the diversity of 21 typological features of 42 varieties of Mandarin using the phylogenetic program NeighborNet. The network diagrams show that a north-south divide in Mandarin and the southern group of Mandarin has a higher degree of diversity than the northern group. The results suggest that the typological profiles of Mandarin dialects are prone to contact-induced change and are far from homogeneous. In fact, the amount of internal differences in Mandarin may well be considerable. Without an objective analysis based on a standardized approach to measurement, we cannot know for certain.
The second issue is the identification of Jin, Hui, Pinghua, and some other dialects that have been subject to disputes over their status, including the Xianghua, Tuhua, Shehua, and Danzhou dialects. The Jin dialects were traditionally included within Mandarin Chinese; however, Li (1985) considered Jin as a separate top-level dialect group, based on the criterion that Jin preserved the entering tone as a separate category as opposed to most Mandarin dialects, although other scholars disagree because the entering tone is seen as an insufficient diagnostic feature, preserved by some other Mandarin dialects as well, especially the Jianghuai dialects (Ding 1998; Wang 1998). Whether the Hui dialect constitutes an independent dialect area is also a point of disagreement. Li (1987) supported its separation, whereas other scholars have pointed out that Hui shares many features with Wu and that it is characterized by relatively high heterogeneity (Zhao 2008). In addition, Pinghua was initially classified as a variety of Yue until it was separated by Li (1987). Furthermore, Pinghua is divided into a northern part around Guilin and a southern part around Nanning. Some scholars have argued that southern Pinghua should belong to Yue (Liu 1995; Zhan 2002), and northern Pinghua to Tuhua (southern Hunan) (Xie 2001). Alternatively, Wei (1999) proposed that northern Pinghua should be merged with Xiang, while Liu (1995) proposed that it should be treated separately as a top-level dialect group. Research on Xianghua and Tuhua (Northern Guangdong) is scarce: Li (1987) identified them in his atlas, but their attribution is unclear. Wang (1982) first discovered the Xianghua dialect and believed that it had some phonological characteristics similar to Min and Hakka, while Chang (1992) noted that Xianghua shares some phonological features with Min and the southern Wu dialect, as well as other sources. The attribution of Shehua is also unclear. There are opposing theories about Shehua that some experts believe is the inherent minority language of She people in Jingning (Zhejiang) and Ningde (Fujian) (Lei and Lei 2007; You 2002; You et al. 2005), whereas other scholars believe it is a Sinitic language, but not a dialect of Hakka (Fu 2001; Wu 2004; Zhao 2004). Alternatively, Nakanishi (2010) claimed that Shehua belongs to Hakka by the criterion of shared innovation in phonology established through systematic basic vocabulary comparison. Finally, the nature of the Danzhou dialect is controversial because of its mixed characteristics. Ding (1986) argued that word pronunciations originated from two different sources, with literary readings coming from Yue and colloquial readings coming from Hakka and Gan.[4]
The third issue involves the relationships between these dialect groups. Initially, there was a tendency to view dialect groups as more or less independent of each other, each group being related to an approximately similar degree. The relationships between adjacent dialect groups first attracted the attention of Luo (1950) and Sagart (1988), who proposed that Gan and Hakka were closely related. However, Liu (2002) found that Gan, Hakka, and Yue shared common phonological changes and argued that they should thus be regarded as a single dialect area, further speculating that this dialect area branched off due to immigration from the north during the Song dynasty (960–1279 CE). Nevertheless, Norman (1989) proposed that Min and Hakka share common phonological and lexical characteristics, reflecting a deep relationship. Furthermore, Deng and Wang (2003) demonstrated that Min and Hakka have the same non-Sinitic substratum by comparing basic words. In addition, dialectologists have discovered that the geographically non-adjacent Wu and Xiang dialects have common features, both preserving the voiced stops, fricatives, and affricates of Middle Chinese (Chen 2006; Yuan 2001). These researchers further inferred that the entire Yangtze River Basin was one dialect region historically, later blocked by immigrants from the north (Hashimoto 1978: 18; Zhang 1999). Quantitative research on this issue was carried out quite early (Cheng 1982, 1998; Deng and Wang 2009; List et al. 2014, 2015; Lu 1992; Wang and Shen 1992). These pioneering studies are highly significant, as they adopted a relatively objective method to analyze the relationship between dialects; however, their datasets were comparatively small, with a small number of variables and locations, limiting their conclusions, and precluding dialect mapping and the fine-grained analysis of geographic patterns and processes.
Finally, the fourth issue concerns the historical formation of Chinese dialects: what model can explain the historical processes that produced the geographical variation in Chinese dialects that we observe today? Research in this area is still lacking, mainly drawing on external historical evidence to infer historical linguistic processes. There are two opposing models of the historical process of Chinese dialect formation, which we refer to as the Horizontal and Vertical Transmission Models. The Horizontal Transmission Model assumes that all Chinese dialects are historically derived directly from Mandarin – either from the migration of Mandarin speakers or contact with Mandarin speakers (Shen 2016). The direction of immigration over history is mainly from the north to the southeast (Ge 1997), not only because of the military threat from northern nomads but also because the south was more livable and prosperous after the Middle Ages. The capital’s dialect developed as the lingua franca, while the literary form of the language, which has always been highly prestigious, has evolved over time. Moreover, China has a long-established civil-service examination system that selects officials based on their ability to write in this literary language, resulting in people from across China studying this variety, which naturally affected their mother tongues (i.e., the local dialects). Furthermore, the ancient political centers are mostly in the Mandarin area. To model the geographic structure of Chinese dialects, Chen (2013) proposed a scenario that was compatible with the wave theory. Mandarin is seen as a continuous source of innovation, and its features spread out to the southeast. This theory explains why the dialects along the southeast coast of the mainland preserved many ancient features, while the central group (Wu, Xiang, Gan, and Hui) exhibit more transitional patterns.
This is currently the theory accepted by most Chinese scholars (Chen 2013; Wang 2014). Alternatively, the Vertical Transmission Model assumes that the history of Chinese dialects involves increasing internal diversification over time, with the Chinese language splitting up repeatedly into smaller and smaller dialects, producing a family-tree-like structure, with minimal contact between branches. Scholars who endorse this view advocate discarding Karlgren (1915)’s paradigm and reconstructing the linguistic history from the bottom up (Akitani and Handel 2012). In general, the testing grounds for these theories are Min, South Wu, and Yue. Overall, both models try to explain the development of Chinese dialect via a unitary mechanism. However, although both models align to a degree with our intuitions, they have not been assessed directly based on empirical research.
Previous studies have provided many constructive opinions on these four issues, but there are also substantial disagreements in the literature. Furthermore, this research has been limited because it has been based on limited empirical data – usually a relatively small number of features carefully selected by hand, often driven by theoretical considerations as opposed to the systematic observation of linguistic variation. Some viewpoints that have been widely accepted have not yet been subjected to systematic evaluation free from subjective presuppositions.
To address these challenges and expand our understanding of Chinese dialects, in this article we quantitatively examine aggregated dialect variation in Chinese for the first time. This article aims to identify the basic geographic structure of Chinese dialects based on a computational dialectometric approach to data analysis (Wieling and Nerbonne 2015), drawing on original atlas data and explaining the result from the perspective of dialect formation. Specifically, we draw upon unsupervised approaches to machine learning, including multidimensional scaling and fuzzy C-means clustering, to identify Chinese dialect regions based on a very large and diverse feature set without any pre-selection. Specifically, in the rest of this article, we pursue seven research questions:
Does linguistic variation in Chinese exhibit a geographic signal?
If there is a geographic signal, what are the underlying regional patterns?
To what extent are these regional patterns consistent with a dialect continuum scenario, and to what extent are they consistent with a dialect area scenario?
What dialect areas are attested? What dialect areas identified in traditional schemes correspond to the dialect areas we identify?
What are the hierarchical relationships among dialect areas?
What are the main factors that explain regional variation in Chinese? What is the linguistic significance of these factors?
What can we learn about the historical processes underlying Chinese dialect regions based on their synchronic geographic structure? How can we model these historical processes?
The rest of this article is organized as follows. In Section 2, we present our methods, including introducing the data from the LACD. In Section 3, we present our results, focusing on mapping regional dialect variation from aggregated perspective. Based on these maps, we propose a new theory of Chinese dialect regions. We then compare our theory to existing theories of Chinese dialect regions and consider how our results can inform debates involving the status of specific regional dialects. Finally, in Section 4, we discuss the significance of our methods and results.
2 Methods
In this study, we analyze Chinese dialect variation by applying state-of-the-art methods from dialectometry. Dialectometry is the quantitative branch of dialectology, analyzing regional/spatial variation within languages using statistical analysis and data visualization techniques, including a wide range of methods for mapping (Nerbonne and Kretzschmar 2013). The field arose in the 1970s, dating back to Séguy (1973), and has continued to develop (Goebl 1982; Grieve 2016; Heeringa et al. 2009; Nerbonne and Kretzschmar 2003; Wieling and Nerbonne 2015). Dialectometry places special emphasis on the use of multivariate methods for exploratory data analysis to uncover hidden geographic structures in datasets consisting of large numbers of linguistic variables measured over large numbers of geographic locations (i.e., collections of dialect maps), based both on dialect atlas data and natural language corpora (Wieling and Nerbonne 2015).
2.1 Data source
Our data source is the Linguistic Atlas of Chinese Dialects (LACD; Cao 2008). Data was collected for LACD between 2000 and 2008, focusing on NORMs (nonmobile, older, rural males) as informants. It is the most authoritative atlas of Chinese dialects, covering 930 localities on a national scale, containing maps for 510 linguistic alternations across three volumes that focus on three levels of linguistic analysis: phonology (205 maps), lexicon (203 maps), and grammar (102 maps).
In each of these maps, variants of one alternation were classified into different types and subtypes by the cartographer according to specific linguistic criteria. Different colors of symbols on the map mark differences in type, while the shape of symbols marks differences in the subtype. For example, Figure 3 presents the first map in the grammar volume of LACD, showing variation in the use of the first-person singular pronoun (Wǒ ‘I’). The first type in Figure 3, which is marked in black, is the variant where the morpheme is the same as the standard variant, although pronunciation may differ. In this case, no subtypes are recognized. The second type marked in yellow and the third type marked in red represent forms with different suffixes, while the fourth type marked in blue represents forms with a prefix. Finally, the fifth type marked in green represents forms with other roots. In addition, various subtypes are distinguished based on the symbols. The classification of word forms used by LACD is usually based on the word’s root (morpheme) rather than its phonetic form. Marking morphemes using Chinese characters is more convenient and economical than using complex phonetic word forms because Chinese characters are logographic. Notably, some localities use more than one variant to express the same concept or achieve the same function. In these cases, the first form is generally the variant that shows a more restricted regional distribution, whereas the second form is generally the more common variant. In this case, the second form is placed after the first form and separated by a tilde. It is worth noting that several maps such as No. 36 and No. 37 of grammar volume reflect an unreasonable taxonomy due to this binary taxonomic system, where complex variants are divided into types and subtypes, resulting in variants classified as the same subtype having different attributes, which should be further divided.

No. 1 map “First-person Singular Pronoun Wǒ ‘I’” in the grammar volume of LACD.
It is also important to note that the locations in LACD in the Mandarin area are much sparser than those in the non-Mandarin area, as can be seen in Figure 3. In the non-Mandarin area, we have at least one sampling point per county, whereas, in the Mandarin area, one sampling point per prefecture-level city cannot even be guaranteed. This variation in sampling reflects preconceived notions about the nature of Chinese dialect variation: variation within Mandarin is thought to be much less substantial than variation within non-Mandarin dialects, and so it was assumed that there was no need to survey the Mandarin area as densely. We take this variation in sampling density into account when interpreting our results.
The appendix of LACD provides informant and fieldworker information for 930 localities. More importantly, it supplies the status of every locality based on Li’s (1987) taxonomic system. However, the appendix merely presents two levels, group and subgroup, and the Shehua, Tuhua, Xianghua, and Danzhou dialects, whose status is not clear, are treated as a single group, without subgroups. The similarities and differences between the traditional schemes and this article’s results are described and discussed based on the traditional taxonomy and labels are supplied in the appendix.
2.2 Data extraction
Our dataset was extracted from LACD and consists of a data matrix with 930 locations in rows and 510 linguistic variables in columns. Codes label the taxonomic relationship of variants for each linguistic variable in terms of types and subtypes, as reflected in the legend of each LACD map. Specifically, the types, which are represented by colors in LACD, were converted to the capital Latin alphabet (A–Z), and the subtypes, which were marked by different symbols in the same color in LACD, were converted to numbers (1, 2, 3 … the). For example, the variants marked as A1 and A2 belong to the same type but different subtypes, while both belong to a different type altogether than B1. Additional variants were divided by # mark. For example, a code “A1#B2” shows two variants of different types. Due to the unreasonable taxonomy of maps 36 and 37 in the grammar volume, we reclassified these variants into three levels: type, subtype, and mini-type according to the consistent taxonomic principle of the map, and the mini-types were converted into lowercase Latin letters (a–z). The distance calculation was based on these codes.
2.3 Distance calculation
Because LACD’s taxonomic system is categorical, it is not accessible for calculating edit distance based on phonetic forms. Edit distance, also called Levenshtein distance, calculates the minimum number of single-character edits (insertions, deletions, or substitutions) required to change one word into another (Levenshtein 1965). Instead, we have developed a method that we call “Weighted Jaccard Distance” (WJD) to measure distances based on the LACD dataset. Jaccard distance is a measure of dissimilarity between two sample sets. It ranges from 0 to 1: the closer to 1, the more dissimilar the two data, and vice versa (Levandowsky and Winter 1971). Jaccard distance is commonly applied to authorship analysis (e.g., Grant 2012). Here, we calculated Weighted Jaccard Distance based on the taxonomic system of each map, so that types are assigned more weight than subtypes, and first forms are allocated more weight than second forms. Our process for calculatin the distance between locations based on a set of dialect maps consists of three steps: we first calculate the distance between variants, then between locations for individual linguistic variables, and finally between locations for many linguistic variables.
Specifically, we use Formula 1 to calculate the distance between any two variants (DV f ). We assign weights to the type (W t = 1), subtype (W s = 0.5), and mini-type (W m = 0.25) to reflect the amount of differences between variants, as identified by the LACD, where types reflect more important differences than subtypes, and where subtypes reflect more important differences than mini-types (We discuss how We set these weights in more detail in Section 2.4).
Specifically, for any two variants, COD t is the co-difference function for types, COD s is the co-difference function for subtypes, and COD m is for mini-types, where COD t returns 1 when the two variants have different taxonomic codes for type and 0 when they have the same codes. The value of COD s is conditional on COD t : If COD t = 1, then COD s = 0, regardless of whether the taxonomic codes for subtypes are the same or not; if COD t = 0, then COD s = 1 when the taxonomic codes for the subtypes are different, otherwise COD s = 0. Similarly, the value of COD m is conditional on COD t and COD s : if COD t = 1 and COD s = 0, then COD m = 0, regardless of whether the taxonomic codes for mini-types are the same or not; if COD t = 0 and COD s = 1, then COD m = 0, regardless of whether the taxonomic codes for mini-types are the same or not; if COD t = 0 and COD s = 0, then COD m = 1, when the taxonomic codes for the mini-types are different, otherwise COD m = 0. In other words, if the type of two variants is different, there is no need to compare their subtypes and mini-types, as the two variants must be completely distinct, but if the type of the two variants is the same, it is necessary to check if there are differences in the subtype and mini-type. In a similar way, if the type of two variants is the same and the subtype is different, there is no need to compare their min-types, as the two variants must be distinct at a subtype level; if both the type and the subtype are same, it is necessary to check if there are differences in the mini-type.
Next, Formula 2 calculates the distance between the value of a variable v between locations j and k (
Our approach to assigning weights to multiple responses is consistent with Goebl’s Weighted Identity Value (Goebl 1984). His basic idea is that the similarity in rare lexemes contributes more strongly to the overall similarity between two local dialects than similarity in common lexemes. The first form in LACD is usually the regional rare form, and the second form is a more common variant. In other words, LACD arranges the word forms in ascending order in multiple responses according to the degree of commonness. We assign the weight values of multiple responses decreasingly, which means that variants whose regional distributions are more constrained contribute more strongly to the overall similarity than common ones.
Finally, Formula 3 calculates the aggregated distance between location j and k (DV jk ) for a set of linguistic variables. Specifically, this aggregated measure of distance (DV jk ) is the mean value for the distances of p variables (in this study, p = 510) and it ranges from 0 to 1.
The results of this distance calculation are stored as a square distance matrix with 930 × 930 localities, consisting of two symmetrical halves, and shows the totality of the pairwise distances between the 930 localities. The diagonal and the upper-half values in the distance matrix are irrelevant. The number of the unique distance values is 930*(930–1)/2 = 431,985. Further analysis is based on this distance matrix: the similarity value (SV jk ) can easily be calculated by subtracting DV jk from 1 (see Formula 4).
2.4 Weight selection
Notably, the weights in this study (see equations 1 and 2) were selected to be as simple as possible and to reflect the underlying coding presented in the LACD. However, we also carried out a series of calculations to deepen our understanding of the effect of varying these weights. Specifically, we calculated weighted Jaccard distances with extreme weight combinations in four situations:
Situation A: the weight of type is 1, and the weight of subtype and mini-type is 0, which means we only take the different types into account and ignore the difference in subtype and mini-type; the weight of the first response is 1, and the weight of other responses is 0, which means we only take the first response into account and neglect the others;
Situation B: the weight of type, subtype, and mini-type are all equal to 1, which means that we consider them to be equally important; the weight of the first response is 1, and the weight of other responses is 0
Situation C: the weight of type is 1, and the weight of subtype and mini-type are 0; the weight of all the responses is 1
Situation D: the weight of type, subtype, and mini-type are all equal to 1; and the weight of all the responses is 1
We then conducted a correlation analysis (Pearson’s r) between the weighted Jaccard distances in four solutions to test the effect of the different weighting schemes. If the weighted Jaccard distances in most extreme situations above are highly correlated, we can conclude that the weighted Jaccard distances are not sensitive to the weight values we assign.
Table 3 shows the Pearson correlation coefficient among Jaccard distances with extreme weight assignment. We can see that they are all strongly positively correlated. The differences among the four solutions are negligible: weighted Jaccard distance is not sensitive to the weight assignment. Relatively speaking, the weight of taxonomic levels has a more impact on distance measurement than that of multiple responses. This result is not surprising. For example, Jeszenszky et al. (2019) plotted a histogram of variant occurrences in a variant category in Japanese dialects, which has a long tail, similar to a Zipf-curve (Kretzschmar 2012). This revealed that, in this dataset, the majority of responses in location j and k that fall into a certain variant category are actually the same variant. Therefore, we can see why the weighted Jaccard distance is not sensitive to the weight assignment. Given the results of weight test we carried out above, even the extreme weight combinations made little impact on the results, let alone the moderate weight assignment we adopted in Section 2.3.
The Pearson correlation coefficient among Jaccard distances with extreme weight assignment.a
| Situation | A | B | C | D |
|---|---|---|---|---|
| A | 1.00 | |||
| B | 0.98 | 1.00 | ||
| C | 0.99 | 0.98 | 1.00 | |
| D | 0.98 | 0.99 | 0.98 | 1.00 |
-
aOnly 2 decimals are included.
2.5 Statistical analysis
The resulting distance matrix was then subjected to two state-of-the-art dialectometric analysis techniques: Multidimensional Scaling (MDS) and Fuzzy C-means Clustering (FCM).
MDS is a data reduction method that generates a preselected number of dimensions that aims to preserve the information in the distance matrix as accurately as possible (Cox and Cox 2001). MDS is often used in dialectometry to identify underlying dialect patterns in the aggregate, based on large numbers of linguistic variables (Grieve 2014; Heeringa and Nerbonne 2001; Nerbonne and Kleiweg 2003). Each dimension extracted by the MDS represents an underlying pattern. In this study, three dimensions are extracted by metric MDS to meet the needs of RGB mapping.
Alternatively, Cluster Analysis is a family of related methods that are used for grouping observations into clusters based on a distance matrix. Although clustering is commonly used in dialectometry to group locations so as to identify dialect regions, Nerbonne et al. (2011) argued that there are stability problems when applying standard clustering algorithms such as hierarchical clustering using Ward’s method (Ward 1963) to identify dialect areas, demonstrating that both bootstrapping clustering and fuzzy clustering could generate stable clusters. The basic advantage of fuzzy clustering in dialectometry is that it does not force locations into hard clusters, but rather allows locations to belong to two or more clusters, specifying the strength of the association between each location and each cluster. The locations contained within the core area of a dialect region are assigned high cluster membership values, which then decrease gradually through any transition areas. In addition, dialect areas can overlap because fuzzy clustering can identify locations that are strongly associated with multiple clusters. Furthermore, by running a series of fuzzy cluster analyses that extract an increasingly large number of clusters, we can assess whether Chinese dialect regions exhibit hierarchical structure, i.e., by considering cluster stability across analyses, rather than assuming hierarchical structure, as would be the case if we directly applied hierarchical cluster analysis, as is often the case in dialectometry. This is especially important given debates over the hierarchical nature of Chinese dialect regions, as discussed in the introduction to this article. In this study, we therefore use a form of fuzzy clustering called FCM to identify dialect areas. FCM was developed by Dunn (1973) and improved by Bezdek (1981), and has previously been applied in dialectometry to identify dialect regions with fuzzy boundaries (e.g., Grieve 2016). To conduct an FCM, it is necessary to specify the number of clusters (C value). However, rather than select a specific number of clusters, we consider the results of FCMs for different numbers of clusters within reasonable limits, specifically between two and ten clusters, and then present an overall interpretation informed by the full set of results, including to establish hierarchical relationships between dialect areas.
2.6 Visualization
Both MDS and FCM return values for each location, which we visualize as choropleth maps. The three dimensions of MDS are visualized individually and then merged into a single RGB map (Nerbonne et al. 1999), which assigns each location a color defined by the three RGB color parameters based on the three dimension scores for that location. RGB mapping is a useful tool for displaying the full results of MDS on a single map, which crucially facilitates cluster detection. RGB mapping is achieved by scaling the scores for each dimension before mapping based on formula (5), where SD k (k = 1, 2, … … 930) is the scaled value for location k on the Dimension, D k is the score of the Dimension for each location, and max (Dk) and min (D k ) are the Max and Min values of the scores for the Dimensions across all 930 locations.
The scaled scores for the first dimension are then linked to the red RGB parameter, the second to green, and the third to blue, and the resulting RGB value is mapped at that location. Locations strongly associated with one dimension will be colored in one of these three colors, whereas locations strongly associated with multiple dimensions will be colored based on a mixture of these three colors.
Similarly, the FCM clusters are mapped by associating each fuzzy cluster with a color. We use two different visualization methods. First, we generate FCM maps with sharp boundaries (which we call Type I FCM maps), which assign each location to the highest scoring cluster. This approach does not take full advantage of the technique, but it produces clear cluster maps that can be compared to previous theories of Chinese dialect regions in a straightforward manner. Second, we generate FCM maps with transitions (which we call Type II FCM maps), which color each location based on the strength of its cluster membership, allowing for core, marginal, and weak regions of dialect areas to be mapped. Our Type II FCM maps are similar to heatmaps: intense colors are associated with core regions, moderate colors with marginal regions, and white with weak regions. The cluster that a location belongs to and the strength of that association depends on its cluster membership values, given specific cutoff values, which we have set. Specifically, we first filter locations with low cluster values less than or equal to 0.2. If only one cluster value is left, we treat that location as belonging to that cluster’s core region; if multiple cluster values are left, and one of them is higher than the others by more than 0.3, we treat that location as belonging to the marginal regions of this cluster; if none of the cluster values are higher than the others by more than 0.3, we treat these locations are being only weakly associated with all dialect region, i.e., characterized by a mixture of characteristics from multiple dialects.
Finally, to visualize the attribution of point data as a colored polygon, we generate a Voronoi diagram (Aurenhammer 1991) based on each location’s latitude and longitude. A Voronoi diagram partitions a plane with a certain amount of points into convex polygons such that each polygon contains exactly one generating point, and every point in a given polygon is closer to its generating point than any other. In geography, the Voronoi diagram is often used for fast interpolation and analysis of the affected area of a geographic entity. Voronoi diagrams are also often used in dialectometry. However, it is worth noting that the Voronoi diagram is just used as a convenient visualization process in this study. Lakes depopulated land, and some non-Sinitic-speaking areas will be automatically allocated to nearby Chinese dialect measurement points. This does not mean that the entire region speaks Chinese dialects.
3 Results
3.1 MDS maps
Based on the complete dataset, consisting of 510 linguistic variables measured across 930 locations, MDS was used to extract the three main dimensions of regional variation following the procedure described in Section 2. The Goodness of Fit (GOF) of the MDS is 0.40. This is a moderate and acceptable value. It is not surprising that this value is not substantially higher, as we would not expect that all dialects in the Chinese language would be represented fully by three aggregated general dimensions of regional variation. Nevertheless, this level of fit is in line with previous research in dialectometry on other languages (e.g., see Grieve 2014), and represents a very substantial amount of regional variation, especially as we are analyzing such a complex and diverse dataset that consists of a large number of linguistics variables representing three levels of linguistic analysis measured across a large number of locations, sampled for across a large geographical region.
Figure 4 maps the MDS scores for the three dimensions individually. The first dimension shows a broad northwest-to-southeast pattern, creating a tripartite division, with the red area coinciding roughly with the Mandarin area, and the blue area encompassing the Southern Group in the southeast. This map is, to a certain extent, compatible with the scheme proposed by Norman (1988) (compare with Figure 1). However, Norman (1988) regarded the Central Group as a region itself – a vast transitional area between the Northern and Southern groups. Alternatively, our first dimension identifies distinct northern (Mandarin) and southern (non-Mandarin) regions separated by a transition zone, marked in white on the map, forming a continuum between these two regions, as opposed to a distinct region itself. The first dimension corresponds to multiple large-scale migratory events in the history of China. In the history of Chinese migration, there are roughly two kinds of migrations: voluntary movement caused by wars, famine, and population expansion, and systematic migration triggered by political, military, and economic programs. All migration has primarily been north to south, with migration in other directions being rare (Zhou and Lo 1991; Zhou and You 2006: 39–41). It therefore appears that the first dimension reflects historical migration patterns. Early immigrants’ ancient language features were preserved to a greater degree in the south, whereas in the north, which is the source of immigration, innovation is more common. Based on the analysis of many linguistic features, Norman (1997) pointed out that the northern Chinese dialect underwent tremendous changes between the 10th and 13th centuries. A new Mandarin dialect formed around today’s Beijing and then spread west and south, pushing the original old Mandarin dialect into the Central Plains to the south. Moreover, this old form of Mandarin remained in the mountains of Shanxi, the so-called Jin dialect. We can see this effect in our map. For example, Mandarin located east of the Taihang Mountains (we call it Northeast Mandarin in the FCM map below) is redder than northwestern Mandarin and southern Mandarin. The red and blue poles of this first Dimension of Chinese dialect variation, therefore, represent the effect of innovation and conservation on Chinese dialects.

MDS maps in three Dimension.
The second dimension highlights the vital role of important river systems in forming regional dialects. The dialects south of the Yangtze River are divided by the second dimension into two major types: dialects in the Yangtze River Basin are marked in blue and the other dialects outside the basin are marked in red. The former is centered on the Wu dialects in southern Jiangsu and northern Zhejiang, while the latter is centered on the Min dialect of Fujian Province. Most of the northern dialects and the southern dialects outside Fujian are not highlighted by this dimension. This dimension therefore clearly reflects regional variation created by the waterways of the south.
The third dimension reflects the effect of substantial mountain ranges on shaping the eastern and western branches of the southern group, with Yue and Min at cores of these two branches. It is clear that the white longitudinal barrier (in southern Anhui, western Zhejiang, and western Fujian) corresponds to a series of mountains (Tianmu, Huangshan, Yushan, and Wuyi), which separate the red and blue areas. In addition, the variation observed in Taiwan’s Chinese dialect reflects the settlement patterns of mainland immigrants. The Min dialect across most of the island is red, reflecting the language brought to Taiwan by Fujian immigrants, while the blue in the northwest reflects the language of Hakka immigrants.
Overall, the variation we observe in Chinese dialects therefore appears to be due to the complex interaction of multiple factors, including sustained southbound migration over time and the effects of both waterways and mountain barriers, which encourage and discourage the spread of linguistic innovation and the divergence of Chinese dialects over time. Together these factors have shaped geographic variation in the Chinese language, leading to the complex picture of contemporary Chinese dialect regions that we observe today.
3.2 RGB map
In addition to mapping each dimension individually, in Figure 5 we present a single RGB map, which combines all three dimensions. This map clearly shows that the Chinese dialect landscape is highly complex, consisting neither of a single dialect continuum nor a collection of distinct dialect areas separated by sharp borders. Instead, it includes clear dialect areas of relative homogeneity and varying sizes separated by both relatively sharp borders and areas of more gradual transition.

RGB map.
Broadly speaking, six regions are apparent in the RGB map, all of which can be discussed in terms of traditional dialect classifications: North Mandarin (dark blue), South Mandarin (light blue), Wu (yellow-green), the eastern branch of the Southern Group (red) (i.e., Min), the western branch of the Southern Group (pink) (including Yue, Hakka, and Pinghua), and a mixed region we call the Central region around Hunan, Hubei, and Jiangxi, whose status is unclear. The Central region appears to be a vast transition zone located at the junction of the four main dialect regions in south-central China, characterized by mixed attributes drawn from different dialects, corresponding roughly to the Xiang, Gan, and Hui-speaking regions. There appears to be considerable dialect contact and mixing in this region. Overall, this map clearly reflects the effects of migration, Yangtze waterways, and mountain barriers on the development of Chinese dialects, as identified by the three individual dimensions upon which this aggregated map is based. This map, as well as the maps for the individual dimensions, also suggest that Chinese dialect regions exhibit a hierarchical relationship. We explore this possibility further in the next section through cluster analysis.
3.2.1 FCM maps
In addition to mapping dimensions of regional variation based on the MDS analysis, we also conducted an FCM analysis and mapped these results to directly identify Chinese dialect areas. FCM maps showing hard clusters (Type I FCM maps) and corresponding FCM maps showing fuzzy clusters (Type II FCM maps) are presented in Figure 6 for between 2 and 10 clusters. The two types of maps have different advantages and we, therefore, interpret them together. The Type I FCM maps facilitate the comparison of our results with standard theories of Chinese dialect regions, which map dialect regions with hard borders. Alternatively, the Type II FCM maps allow for a more precise picture of regional variation to be observed, identifying core, marginal and weak areas for each cluster, as well as regions of heterogeneity, where clusters mix, indicating areas of transition and overlap. Our discussion of these results considers the FCM maps from three perspectives: (i) contrasting our overall analysis with existing theories of Chinese dialect regions, (ii) summarizing the hierarchy of regions to describe the relationship between clusters, and (iii) discussing these results in light of debates about specific regions and dialects.


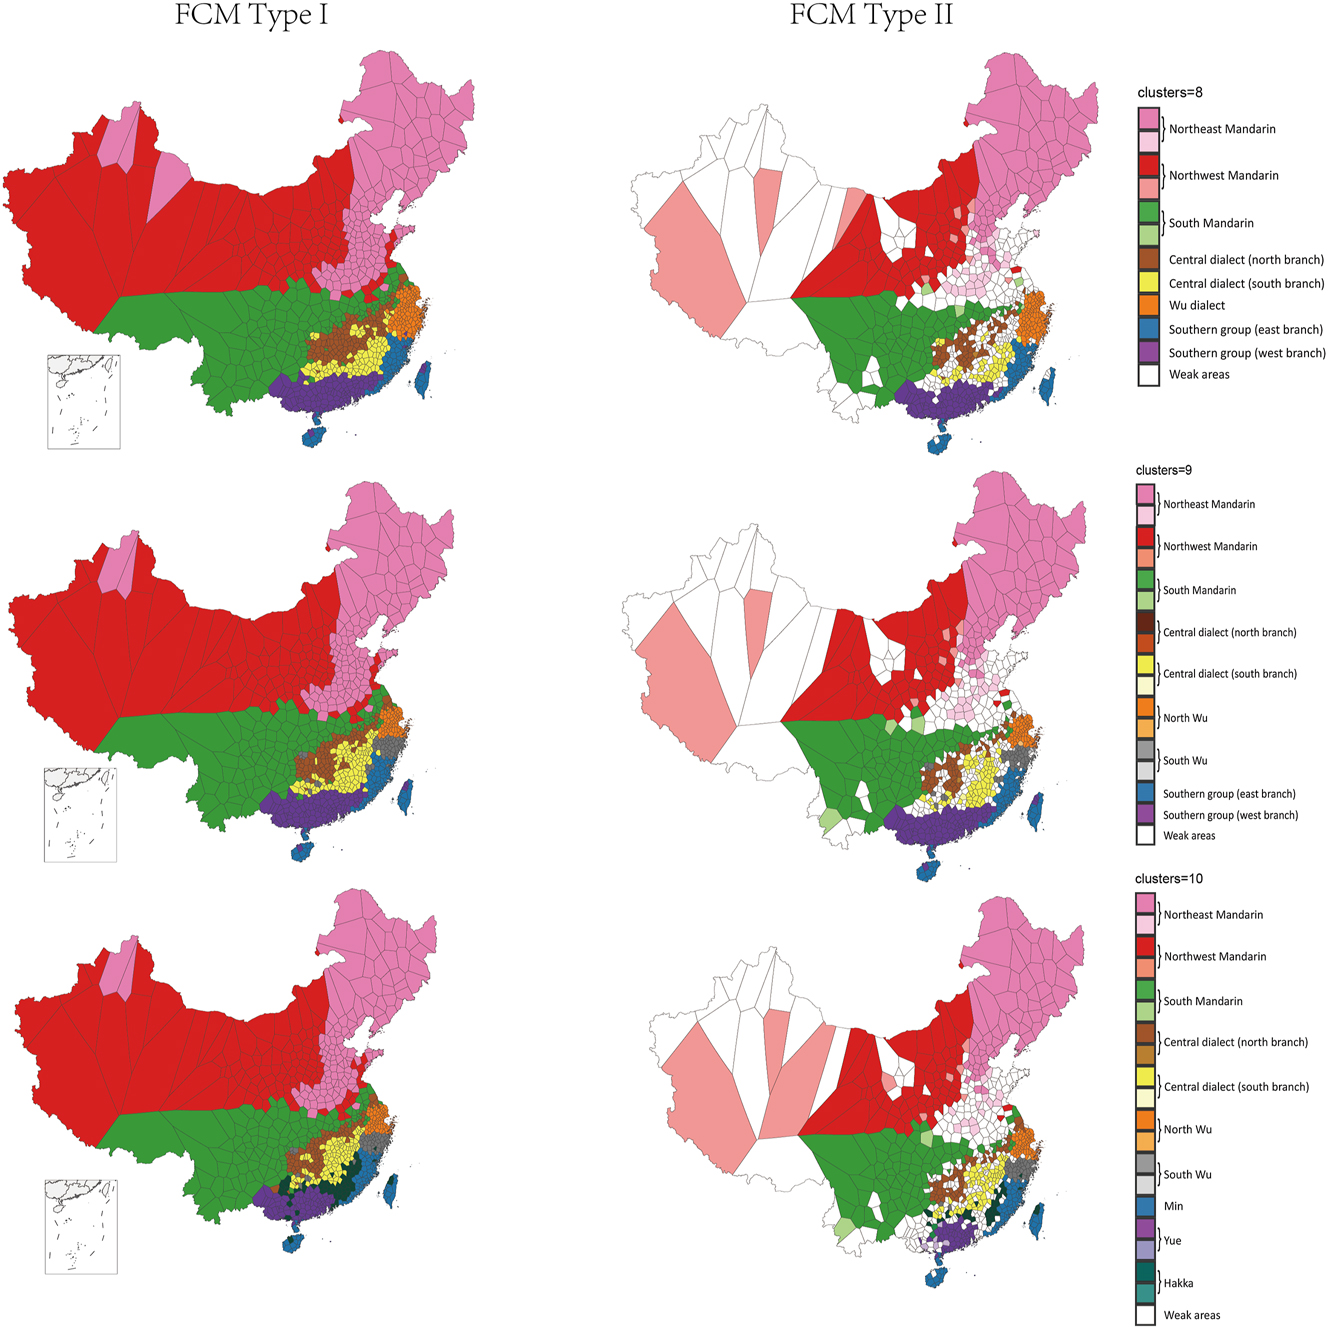
FCM maps.
3.2.2 Comparison with existing theories
Given previous research, we focus first on our 3, 7, and 10 cluster maps, comparing these analyses to Norman’s (1988), Yuan’s (2001), and Li’s (1987) theories of Chinese dialect regions, respectively (see Figure 1).
When we divide Chinese dialects into 3 clusters, the overall dialect landscape we identify largely agrees with Norman’s (1988) scheme. The red (Mandarin), orange (Central Group), and blue (Southern Group) regions of our Type I 3-cluster map correspond broadly to his North, Central, and South Groups. Notably, Norman describes the Central Group as a transition area between his North Group and South Group. We find some evidence in support of this claim, but overall we find the Central Group is more closely related to the South Group. Our Type II 3-cluster map identifies a relatively strong border between the Central Group and the Mandarin region to the north, whereas it identifies more of a transition area between the Central Group and the South Group. This difference in transitions can also be seen in the map for the first dimension of the MDS analysis (see Figure 4). Furthermore, our 2-cluster maps group most of this central region with the Southern Dialects, although the strength of cluster membership is relatively weak, and a limited number of locations on the northern edge of the Central Group are clustered with the Mandarin region to the north, offering evidence of a relatively small transition area.
Alternatively, the FCM maps for 7 clusters diverge considerably from Yuan’s (2001) scheme, except that our Wu and Min dialect regions roughly align with his scheme. Most notably, as opposed to Yuan, who identifies a monolithic Mandarin dialect area, we divide Mandarin into north and south regions following the Qinling-Huaihe line, a significant division in climate, agriculture, and culture between China’s north and south. This is especially notable, because the density of locations in LACD is much sparser in the Mandarin region compared to the southeast; if sampling in the Mandarin region were denser, we would expect to identify even more diversity, which is indeed what we find when we extract additional clusters. This general result is important as it challenges all standard theories of Chinese dialect regions, which assume the Mandarin region is largely homogeneous. In addition, we do not identify Xiang and Gan dialect regions, but rather divide the Central Group into northern and southern branches. The Type II FCM map shows that these branches of the Central Dialect, which are characterized by weak and variable cluster membership, appear to reflect the weakening of the Central Dialect through contact with Mandarin, as opposed to stable sub-regions. In particular, our North Branch appears to identify the part of the Central Dialect region that is being most severely eroded by Mandarin – a buffering zone between these two major branches of Chinese dialects.[5] This interpretation is also consistent with our RGB map (see Figure 5), which identifies considerable heterogeneity in this region. In addition, we split Yuan’s Hakka region into three parts, which we group with adjacent clusters: Hakka in Guangdong and Guangxi are subsumed by Yue, Hakka in southern Jiangxi is subsumed by the southern branch of the Central Dialect, and Hakka in the west of Fujian constitutes a transition area between these three surrounding regions.
Similarly, the FCM maps for 10 clusters present a very different picture from the analysis presented in Li (1987), aside from his treatment of the Min dialect, which aligns with our results. Most notably, in our analysis, North Mandarin is split into eastern and western branches by the Taihang Mountains, while Jin is not identified as a separate region and is instead grouped with Northwest Mandarin. Our analysis also identifies a “diffusion ring” pattern for North Mandarin: the pink area in the North China Plain is the diffusion center, and the vast red area in the northwest of China and the red areas at the south and east edge of the North China Plain together constitute the periphery, reflecting the spread of innovations from the core, which have not yet been adopted on the edges of this region. This interpretation is supported by considerable evidence. Norman (1997) found that Northwest Mandarin, as spoken in the area west of the Taihang Mountains, today retains many early Mandarin characteristics, while the more innovative form of New Mandarin, as spoken around Beijing, spread southward. In addition, our own Type II FCM map for 10 clusters shows that the areas along the Beijing-Hangzhou Grand Canal, which has been a bustling North-South waterway for the past 1,500 years, are core or marginal regions of Northeast Mandarin, whereas the areas far away from this important waterway are weak areas. This result suggests that the innovations around Beijing spread along the Grand Canal and firstly leveled the riparian areas, while the areas further away from the canal were relatively less affected by these innovations. It is also notable that we identify the Heilongjiang, Jilin, and Liaoning provinces, as well as northern Xinjiang, as part of this core area. This result can be directly explained by migration patterns: New Mandarin speakers moved to the northeast provinces during the Qing Dynasty and the Republican period (1860–1931), while skilled workers from across China, who spoke a wide range of dialects, moved to northern Xinjiang after 1949, their collective dialect eventually settling on a form of New Mandarin.
In addition to these differences in the north, our analysis in the south also differs considerably from the scheme proposed by Li. Specifically, we do not identify distinct Xiang and Gan dialect regions, in line with our 7-cluster analysis. Furthermore, although we do identify a single Wu dialect area in our analyses for fewer clusters, at this stage, we identify more internal structure than Li, as we find a sharp boundary between North and South Wu, even in our Type II FCM map.[6] It is also notable that we do not identify Hui and Pinghua dialect regions. Rather, we classify half of Li’s Hui dialect region with the South Branch of our Central Dialect, while the rest of this region is of unclear status. Similarly, we divide Li’s Pinghua dialect region, grouping it with Yue in the south, and primarily with Hakka in the north, although this area is very heterogeneous, with localities also classified as being part of the South Branch of our Central Dialect. Finally, we identify Hakka as a distinct region with western Fujian at its core.
3.2.3 Hierarchy of regions
Based on these FCM dialect maps, which identify dialect regions at different resolutions, we next produced a single hierarchy of Chinese dialect regions, as shown in Figure 7 as a tree diagram.[7] For example, because our 2-cluster analysis draws a basic distinction between Mandarin and the Southeast Dialects, this division is represented by the first branching in Figure 7. Next, because our 3-cluster analysis splits the Southeast dialects into the Central Group and the Southern Group, this is the second branching in Figure 7. Notably, there was no guarantee our analyses for different numbers of clusters would be consistent: a region that forms a single cluster in a more parsimonious analysis may be split apart and grouped with other regions when additional clusters are extracted, undermining a tree-based representation. There are, in fact, some instances of such inconsistencies in our maps. For example, although the Central Group we identify in our 3-cluster analysis primarily contains locations classified in our 2-cluster analysis as part of the Southeastern Dialects, it also contains a small number of locations that were classified as part of the Mandarin region to the north. Overall, however, our cluster maps are largely consistent with each other: in general, as we identify additional clusters, we divide existing clusters into sub-regions, although a few localities may switch clusters, as in this example. The vast majority of locations are clustered consistently across analyses. We take the consistency of our results as evidence of the robustness of our analyses and of the appropriateness of broadly representing the relationship between Chinese dialect regions hierarchically, although, as we discuss in more detail below, we also acknowledge that there is also contact between dialects in different branches of this hierarchy.
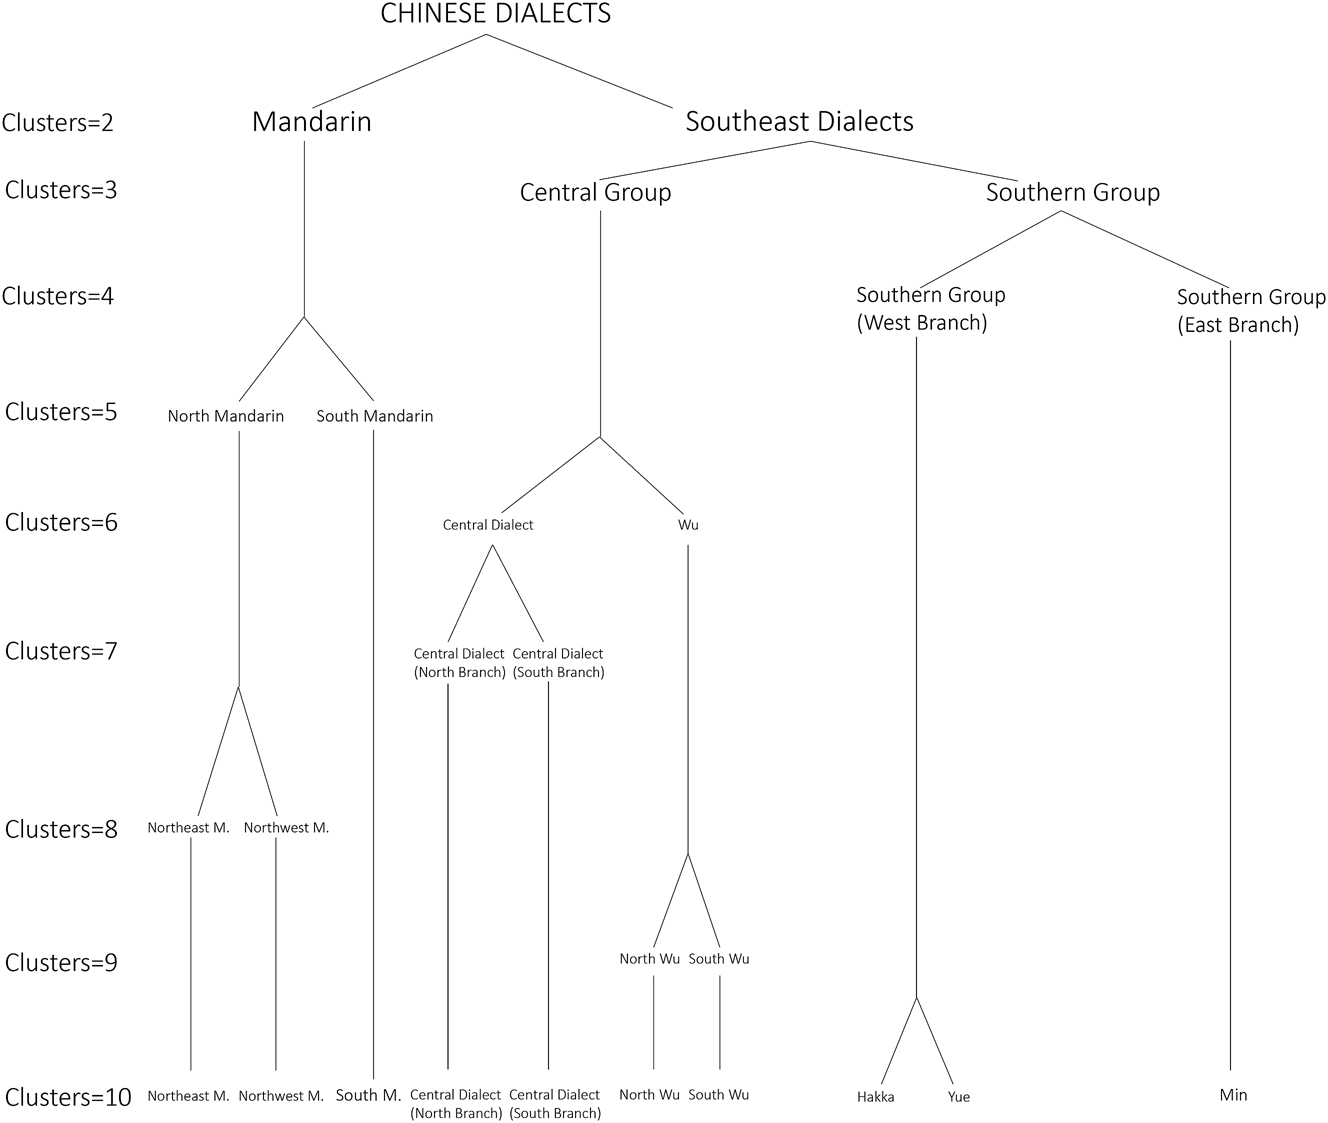
The hierarchical relationship among dialect regions.
Overall, our theory of Chinese dialect regions first separates Mandarin from the Southeastern Dialects, before then splitting up the Southeastern Dialects, distinguishing between the Central Group and the Southern Group, and then dividing the Southern Group into eastern and western branches, creating 4 main dialect regions. Next, we divide Mandarin into northern and southern sub-regions, a distinction we believe has been substantially underestimated in previous research. We then divide the Central Group into Wu and the Central Dialects, giving six main dialect regions, which align closely with our RGB map (Figure 5), offering additional evidence of the robustness of our results and our model of Chinese dialects. Overall, we believe this 6 dialect system represents a good snapshot of the major Chinese dialect regions, especially because distinctions lower in this hierarchy become more complex. For example, the RGB map identifies considerable variability within the Central Dialects, which is partitioned by the next division in our tree, splitting the Central Dialects into northern and southern branches, giving the system of seven dialect regions discussed in detail in the previous section. Next, we divide Northern Mandarin into northwestern and northeastern sub-regions and we divide Wu into northern and southern sub-regions. Notably, at this stage, Yue and Hakka have not yet been identified as distinct dialects, even though we have already divided Mandarin into 3 sub-regions, offering further evidence that the degree of internal differences within Mandarin is considerably greater than has previously been assumed. Similarly, the division between South Wu and North Wu is notable, as this takes place in our model before we split the West Branch of the Southern Group into Yue and Hakka, which is the final division in our analysis, giving 10 total dialect regions, as discussed in the last section.
We believe this hierarchy presents a clear, accurate, contemporary, and interpretable theory of Chinese dialect regions. Ultimately, Figure 7, therefore, represents the primary general descriptive finding of this study, a synthesis of our full quantitative analysis of the data from LACD. These 10 regions could be further divided through additional clustering, but we believe this level of resolution provides an insightful overview of the hierarchical relationship between modern Chinese dialect regions based on the data we analyzed. Furthermore, the consistency of clusterings would begin to degrade if we identified further dialect regions; even the identification of the Hakka dialect region in the final tier of this dialect tree is somewhat problematic, as it combines localities classified higher in the tree as being members of the Central Dialects (South Branch), the Southern Group (East Branch), and the Southern Group (West Branch). Presumably, this degradation reflects the importance of contact as we zoom in, complicating hierarchical theories of dialect regions at higher resolutions.
Figure 8 presents a final full-sized map of modern Chinese dialect regions that summarizes our overall results. This map is mainly based on the results of the cluster analyses for 6 and 10 clusters. We chose to focus on these two analyses, because the 6-cluster analysis is most in line with our MDS analysis and in our opinion provides an especially meaningful overall summary of the primary dialect regions and the most robust geographical patterns identified in this study, while the 10-cluster analysis provides the maximum level of detail that we have uncovered. In this map, different colors are used to highlight 5 primary dialect regions: Mandarin (which is divided into North and South sub-regions by the 6-cluster analysis) in blue, Wu in purple, Yue in pink, the Central Dialect in yellow, and Min in Green, with the more ambiguous areas (mainly Hakka), presumably created primarily by dialect contact marked in grey. Variation in shading is used to represent sub-regions within these primary dialect regions.

The geographic structure of Chinese dialects.
First, it should be noted that the full-sized map is only a conceptual map based on the results of the full dialectometric study on 930 measuring points. Our goal here is to produce a single overall map that reflects the basic geographic structure of Chinese dialects that we have identified in this study. However, it is not entirely accurate in terms of specific geographic details due to the limited number of sampling points in the linguistic atlas, especially in the northwestern region where the sampling points are sparse. Second, the map is only intended to represent regional patterns in Chinese dialects and may therefore be inaccurate in terms of representing boundaries between Chinese dialects and non-Sinitic languages, which is outside the scope of this article.
3.2.4 Debates around specific regions and dialects
Finally, we consider four important debates about the status of specific regions and dialects in Chinese dialectology, as described in the introduction, which we have not yet had an opportunity to discuss in light of our results.
First, there has been debate over the relationship between Tuhua, Shehua and Hakka. In our analysis, Tuhua is found to be highly heterogeneous, divided into two groups: Tuhua as spoken in northern Guangdong is part of the Hakka dialect region, while Tuhua as spoken in southern Hunan is part of the Central Dialect (South Group), which are two altogether different branches of the Southeastern Dialects. Alternatively, Shehua as spoken both in Jingning (Zhejiang) and Ningde (Fujian) are grouped with Hakka. These results strongly support Coblin’s (2019) theory about the relationship between Hakka, Shehua, and Tuhua. In his theory, all three diverged from a proto-language named “Early South Central Highland Chinese”, although modern Hakka and Shehua developed from a common ancestor called Common She-Hakka, whereas Tuhua in northern Guangdong is considered to be a form of paleo-Hakka. However, our results further reveal that modern Tuhua as spoken in southern Hunan shares many characteristics with other nearby dialects in the South Branch of the Central Dialect, presumably due to contact over time.
Second, the Hakka dialect, which is the last region identified in our analysis, is diffuse, stretching across a relatively wide region with no clear core and including several discontinuous localities. Notably, this dialect is found across five distinct regions, including western Fujian, southwestern Jiangxi, northeastern Guangdong, scattered areas of Hunan, and northwestern Taiwan. Furthermore, as noted above, although we identify a distinct Hakka dialect region at 10 clusters, the localities it encompasses belong to different regions higher in our tree, as summarized in Table 4. For example, Hakka, as spoken in both Fujian, Jiangxi, and Hunan, belongs to the south branch of the Central Dialects. Alternatively, Hakka as spoken in Guangdong and Taiwan is grouped with Yue in the Southern Group (West Branch) until Hakka splits off as an independent cluster. Overall, Hakka can therefore be divided roughly in two, one variety more closely related to the South Branch of the Central Dialect and one more closely related to Yue, as presented in Table 4 and as can be seen in Figure 6. Overall, Hakka appears to be a transition area between these dialects.
The attribution of Hakka in five regions.
| Clusters | 7 | 8 | 9 | 10 |
|---|---|---|---|---|
| Western Fujian | Central Dialect (South Branch) | Central Dialect (South Branch) | Central Dialect (South Branch) | Hakka |
| Southwestern Jiangxi | Central Dialect (South Branch) | Central Dialect (South Branch) | Central Dialect (South Branch) | Central Dialect (South Branch) |
| Scattered areas in Hunan | Weak area between Central Dialect South and North Branch | Weak area between Central Dialect South and North Branch | Central Dialect (South Branch) | Central Dialect (South Branch) |
| Northeastern Guangdong | West Branch of Southern Group | West Branch of Southern Group | West Branch of Southern Group | Yue, weak area between Central Dialect (South Branch) and Yue |
| Northwestern Taiwan | West Branch of Southern Group | Weak area between Central Dialect (South Branch) and West Branch of Southern Group | West Branch of Southern Group | Yue |
Third, another interesting phenomenon that deserves our attention involves Xianghua, which is scattered in the isolated mountain areas in western Hunan. All Xianghua is classified as part of south Wu in this study. Based on this evidence, we propose that an ancient dialect area existed in the Yangtze River Basin. Later, waves of immigrants from Jiangxi, Hunan, and other regions to the north, leveled the original ancient dialect and formed the buffering belts we now call the Central Dialects. However, Xianghua as spoken in the isolated mountainous area in western Hunan was spared from the impact of immigration, which is why Xianghua is classified with south Wu.
Finally, the status of the Danzhou dialect in Hainan is unclear. In our study, the Danzhou dialect is classified into Hakka in the Type I FCM map, but is revealed to be a weak area in the Type II FCM map, where it has only a 32 % association with Hakka, 12 % with Min, 9.9 % with Yue, and 7.3 % with the South Branch of the Central Dialect. This result roughly supports Ding’s (1986) judgment. However, Ding did not mention that the Danzhou dialect has such a high Min dialect component, presumably because his judgments were mainly based on phonology and did not fully consider the source of vocabulary borrowed from surrounding Min dialects.
4 Discussion
In this study, we have presented the first large-scale quantitative analysis of Chinese dialect regions at a national level, as well as the first analysis of the complete dataset from the Linguistic Atlas of Chinese Dialects. This is the most recent and authoritative dialect survey of Chinese, including 510 phonological, lexical, and grammatical alternation variables measured across 930 locations. By drawing on state-of-the-art methods from dialectometry, we have identified broad and interpretable patterns of regional dialect variation in this dataset, both supporting and challenging previous theories of Chinese dialect regions, while providing an empirical basis for further research in the field. In particular, we have identified three main dimensions of Chinese dialect variation – which reflect the importance of migration, waterways, and mountain ranges on the formation of Chinese dialects. In addition, we have identified ten main Chinese dialect regions, and we have presented a theory of the hierarchical relationships between these regions. We have also discussed how our results elucidate various debates about the status of specific Chinese dialect regions. In this section, we conclude this article by synthesizing these results and considering how they inform our understanding of broad theoretical issues in Chinese dialectology and the evolution of the Chinese language.
Our most basic contribution is to have shown that Chinese dialect variation is far more pervasive and intricate than has generally been assumed. For example, up until now, our understanding of internal differences in Mandarin has been based mainly on the subjective analysis of phonological variation, but our aggregated statistical analysis of a wide range of variables from across levels of linguistic analysis provides a more comprehensive and objective picture of the distances between dialects, showing that Mandarin is in fact characterized by considerable internal variation. Given long-standing assumptions about the homogeneity of Mandarin, it is clear that fieldwork in this region has been insufficient. Fortunately, this situation is currently improving with the survey of Northwest Mandarin currently underway as well as other regional atlas projects (Li 2021; Xing 2020). Similarly, early researchers used the regional cultural labels “Wu” and “Hakka” to identify what they saw as homogeneous dialect regions. The internal consistency of these regions has rarely been questioned, as both areas have relatively robust and unified cultural identities, but such perceptions depend in part on comprehensive knowledge of these areas, which is affected considerably by covert linguistic attitudes and other extra-linguistic factors such as cultural identity (Schüppert and Gooskens 2010). Our data-driven analysis, however, shows that there is a clear and sharp boundary between Wu dialects in the north and south, while Hakka as spoken in Fujian, Guangdong, and Jiangxi is highly variable, presumably due to substantial contact with various adjacent dialect regions.
Relatedly, we have found clear evidence of hierarchical structure in Chinese dialects. Often Chinese dialects have been assumed to be equally distinct from each other, with dialectologists identifying a set number of regions, without describing the relationships between these regions. We, however, have proposed a full hierarchical theory of Chinese dialect regions, splitting the Chinese language into dialect regions at various levels of resolution based on linguistic distances. Furthermore, we have argued that these distinctions reflect the pressures of a range of physical and cultural factors overtime on the Chinese language, highlighting the effects of human and physical geography, in particular, giving us the hierarchy of dialect regions we observe today. However, in addition to these hierarchical relationships, Chinese dialects also appear to interact laterally through contact, as dialect regions push up against each other, often from different branches of this hierarchy. For example, we can observe the effect of contact with Mandarin in the North Branch of the Central Dialect. Overall, we, therefore, find that Chinese dialect regions are highly complex, reflecting the influence of a wide range of different factors.
Alternatively, we have shown that some traditional dialects, which have long captured the attention of Chinese dialectologists, are less distinctive than have been assumed. Most notably, we do not find strong evidence for the traditional Jin, Hui, and Pinghua dialect regions. If we divided our data more finely, tweaked the parameters of our statistical analysis, or focused on subsets of our linguistic feature set, we might well uncover some evidence to support their existence. Geolinguistic variation is highly complex, allowing for a wide range of different regions to be identified in the same dataset based on different criteria. Our goal, however, has been to map the primary patterns of Chinese dialect variation based on a robust aggregated analysis of the complete LACD, the most extensive available dataset for Chinese dialects. We believe theories of dialect regions should be based on data-driven research that considers comparable data collected from across the region of interest, not assumptions about the nature of language use in one location, even if those assumptions are based on careful fieldwork. We are therefore confident that the overall picture of Chinese dialect regions we have presented is accurate and insightful, reflecting the broad patterns of regional variation instantiated in LACD, and consequently highlighting the most important regional distinctions in the Chinese language. Crucially, we feel this is the best approach for providing a basis for understanding the underlying geographical and historical processes that generated these patterns.
In particular, as discussed in the introduction, there are two main theories concerning the historical formation of Chinese dialect regions, each highlighting a different type of relationship. The first and more widely accepted theory is associated with the horizontal transmission, where Chinese dialect regions are primarily explained as being the result of Mandarin speakers and their linguistic innovations spreading from the north to the southeast. This process is used to explain not only the original spread of the Chinese language across China, brought by the Han people as they migrated from the north into the southeast where non-Sinitic languages were originally spoken, but also further division of these southeastern dialects, through new waves of Mandarin-speaking migrants and sustained cultural influence from the north. The second theory is associated with vertical transmission, where Chinese dialect regions are primarily explained as being the result of internal diversification over time. Our analysis, however, shows that the historical formation of Chinese dialect regions likely arises from the interaction of both these sources of language change. Most notably, we have identified clear hierarchical patterns in the Southeast, consisting of sub-regions within sub-regions, as shown especially through the series of cluster analyses we performed. On the whole, this structure cannot be easily explained through contact with Mandarin; rather, it appears to be due primarily to internal innovation and diversification. Similarly, we also observe a hierarchical structure within Mandarin, which has long been underestimated. These results clearly challenge standard theories of Chinese dialect region formation. However, we also find clear evidence of horizontal transfer, especially from Mandarin to the Central Dialect, which is characterized by considerable internal variability and less stable borders than most other Southeastern dialects. Similarly, we can see that Northeastern Mandarin is a center of linguistic innovation, especially within the Mandarin region itself. Ultimately, we therefore propose that the historical formation of Chinese dialect regions is more complex than has previously been assumed, a product of both vertical and horizontal transmission, constrained and promoted by both the physical and cultural geography of China.
5 Conclusions
To conclude, in this article we have presented the first large-scale dialectometric analysis of Chinese dialect survey data, uncovering hidden structure in regional variation in Chinese, including proposing new theories of modern Chinese dialect regions and of the historical formation of Chinese dialect regions. Our results both support and challenge standard views in Chinese dialectology, providing a quantitative basis for future research in Chinese dialectology, as well as for cross-linguistic typological analysis. This study also highlights the importance of adopting a quantitative and data-driven approach to dialectology. Geolinguistic data is voluminous, high-dimensional, and spatially related, and it is therefore challenging to effectively and efficiently detect and understand relationships and patterns in dialect data. Crucially, extending our scientific understanding of geolinguistic phenomenon must generally rely on the discovery, interpretation, and presentation of multivariate spatial patterns. Dialectometry is a powerful tool that integrates computational, visual, and cartographic methods together to detect and visualize multivariate spatial patterns. It bridges our linguistic knowledges with data-driven, quantitative research and provides us a new way to evaluate previous theories and explore new issues objectively, as we have demonstrated for the Chinese language in this study, leading to new and important insights about regional variation in one of the most important languages in the world.
-
Data availability: The data underlying this study can be downloaded at https://zenodo.org/records/10697975.
References
Akitani, Hiroyuki & Zev Handel. 2012. Lishi Bijiaofa he Cengci Fengxifa [Historical-comparative and stratum analysis]. Yuyanxue Luncong [Essays on Lingusitics] 45. 277–335.Search in Google Scholar
Aurenhammer, Franz. 1991. Voronoi diagrams: A survey of a fundamental geometric data structure. ACM Computing Surveys 23(3). 345–405. https://doi.org/10.1145/116873.116880.Search in Google Scholar
Bezdek, James C. 1981. Pattern recognition with fuzzy objective function algorithms. New York: Plenum Press.10.1007/978-1-4757-0450-1Search in Google Scholar
Cao, Zhiyun. 2008. Linguistics atlas of Chinese dialects, vol. 1–3. Beijing: The Commercial Press.Search in Google Scholar
Chang, Kun. 1992. Hanyu fangyan zhong de jizhong yinyun xianxiang [Some phonological phenomena in Chinese dialects]. Zhongguo Yuwen [Studies of the Chinese Language] 4. 253–259.Search in Google Scholar
Chen, Lizhong. 2006. Xiangyu yu Wuyu Guanxi Shuoyuan [Exploring the relationship between Xiang and Wu dialects]. Paper presented at the 4th International Wu Dialect Symposium on Text and Talk at Work, University of Ningbo, 17–18 March, Shanghai Language and Literature Association.Search in Google Scholar
Chen, Zhongmin. 2013. Hanyu Fangyan Yuyinshi Yanjiu yu Lishi Cengci Fenxifa [A study of historical phonology of Chinese dialects and the method of stratification analysis]. Beijing: Zhonghua Shuju [Zhonghua Book Company].Search in Google Scholar
Cheng, Chin-Chuan. 1982. A quantification of Chinese dialect affinity. Studies in the Linguistic Sciences 12. 29–47.Search in Google Scholar
Cheng, Chin-Chuan. 1998. Hanyu Fangyan Qinshu de Jiliang Yanjiu [A quantitative study of the relationship between Chinese dialects]. Zhongguo Yuwen [Studies of the Chinese Language] 2. 87–102.Search in Google Scholar
Coblin, South. 2019. Common Neo-Hakka: A comparative reconstruction (Language and Linguistics Monograph Series 63). Taipei: Academia Sinica.Search in Google Scholar
Cox, Michael A. A. Cox & Trevor F. Cox. 2001. Multidimensional scaling. In Chun-Houh Chen, Wolfgang Härdl & Antony Unwin (eds.), Handbook of data visualization (Springer Handbooks of Computational Statistics), 315–347. Berlin & Heidelberg: Springer.10.1007/978-3-540-33037-0_14Search in Google Scholar
Deng, Xiaohua & William S.-Y. Wang. 2003. Gu Minkefangyan de Laiyuan yiji Lishi Cengci Wenti [The origin and stratification of Proto-Min-Hakka]. Guhanyu Yanjiu [Research in Ancient Chinese Language] 2. 8–12.Search in Google Scholar
Deng, Xiaohua & William S.-Y. Wang. 2009. Zhongguo de Yuyan ji Fangyan de Fenlei [The languages in China and the classification of Chinese dialects]. Beijing: Zhonghua Shuju [Zhonghua Book Company].Search in Google Scholar
Ding, Bangxin. 1986. Danzhou Cunhua [The Danzhou dialect]. Bulletin of the Institute of History and Language of Academia Sinica 84. Taipei: Academia Sinica.Search in Google Scholar
Ding, Bangxin. 1998. Ding Bangxin Yuyanxue Lunwenji [Collected linguistic papers of Ding Bangxin]. Beijing: Shangwu Yinshuguan [The Commercial Press].Search in Google Scholar
Ding, Qizhen. 1991. Qinhan Fangyan [The dialect of Qin and Han dynasty]. Beijing: Dongfang Press.Search in Google Scholar
Dunn, J. C. 1973. A fuzzy relative of the ISODATA process and its use in detecting compact well-separated clusters. Journal of Cybernetics 3. 32–57. https://doi.org/10.1080/01969727308546046.Search in Google Scholar
Fu, Genqing. 2001. Cong Jingning Shehua Guquanzhuo Shengmu de Jindu Kan Shehua de Xingzhi [Exploring the attribution of Shehua in Jingning from the criterion of voiced consonants in Middle Chinese]. Zhongguo Yuwen [Studies of the Chinese Language] 3. 230–235.Search in Google Scholar
Ge, Jianxiong. 1997. Zhongguo Yinminshi [The history of Chinese immigration] Vols. 1–6. Xiamen: Fujian People Press.Search in Google Scholar
Goebl, Hans. 1982. Dialektometrie: Prinzipien und Methoden des Einsatzes der numerischen Taxonomie im Bereich der Dialektgeographie. Wien: Österreichische Akademie der Wissenschaften. (Denkschriften, Bd. 157).Search in Google Scholar
Goebl, Hans. 1984. Dialektometrische Studien anhand italoromanischer, rätoromanischer und galloromanischer Sprachmaterialien aus AIS und ALF. Bd.1 (Bd.2 und 3 enthalten Karten und Tabellen). Tübingen: Max Niemeyer.Search in Google Scholar
Grant, Tim. 2012. TXT 4N6: Method, consistency, and distinctiveness in the analysis of SMS text messages. Journal of Law and Policy 21. 467–494.Search in Google Scholar
Grieve, Jack. 2014. A comparison of statistical methods for the aggregation of regional linguistic variation. In Benedikt Szmrecsanyi & Bernhard Wälchli (eds.), Aggregating dialectology, typology, and register analysis: Linguistic variation in text and speech, (Linguae & Litterae 28), 53–88. Berlin & Boston: De Gruyter.10.1515/9783110317558.53Search in Google Scholar
Grieve, Jack. 2016. Regional variation in written American English. Cambridge University Press.10.1017/CBO9781139506137Search in Google Scholar
Hashimoto, Mantaro. 1978. Gengo Ruikei Tiriron [The geography of language types]. Tokyo: Kobundo Press.Search in Google Scholar
Heeringa, Wilbert & John Nerbonne. 2001. Dialect areas and dialect continua. Language Variation and Chang 13(3). 375–400. https://doi.org/10.1017/s0954394501133041.Search in Google Scholar
Heeringa, Wilbert, Keith Johnson & Charlotte Gooskens. 2009. Measuring Norwegian dialect distances using acoustic features. Speech Communication 51(2). 167–183. https://doi.org/10.1016/j.specom.2008.07.006.Search in Google Scholar
Huang, He. 2018. Multidimensional contact and language diffusion models: A glottogram analysis of the direct address of “grandfather” in the Yixing dialect. Zhongguo Yuwen [Studies of the Chinese Language] 3. 313–322.Search in Google Scholar
Jeszenszky, Peter, Yoshinobu Hikosaka, Satoshi Imamura & Keiji Yano. 2019. Japanese lexical variation explained by spatial contact patterns. International Journal of Geo-Information 8(9). 400–430. https://doi.org/10.3390/ijgi8090400.Search in Google Scholar
Karlgren, Bernhard. 1915. Études sur la phonologie chinoise. Uppsala: University of Uppsala dissertation.Search in Google Scholar
Kretzschmar, William A. 2012. Variation in the traditional vowels of the eastern states. American Speech 87. 378–390. https://doi.org/10.1215/00031283-2077579.Search in Google Scholar
Lei, Faquan & Yanping Lei. 2007. Shezu Shiyong de Zhuyao Yuyan: Sheminhua [Shehua: the language of She]. In Institute of She Culture of Lishui University, Zhejiang She Culture Research Association (eds.), Shezu Wenhua Yanjiu Luncong [Essays on the studies of She culture], 318–324. Beijing: Central University for Nationalities Press.Search in Google Scholar
Levandowsky, Michael & David Winter. 1971. Distance between sets. Nature 234(5). 34–35. https://doi.org/10.1038/234034a0.Search in Google Scholar
Levenshtein, Vladimir I. 1965. Binary codes capable of correcting deletions, insertions and reversals. Soviet Physics Doklady SSSR 163. 845–848.Search in Google Scholar
Li, Jianxiao. 2021. Linguistic atlas of Jin dialects in Shanxi Province. Beijing: Social Sciences Academic Press.Search in Google Scholar
Li, Rong. 1985. Guanhua Fangyan de Fenqu [The classification of Mandarin]. Fangyan [Dialects] (1). 2–5.Search in Google Scholar
Li, Rong. 1987. Languages in China. In Stephen A. Wurm, Benjamin T’sou, David Bradley, Rong Li, Zhenghui Xiong, Zhenxing Zhang, Maoji Fu, Jun Wang & Dao Bu (eds.), Language atlas of China, Map A-1. Hong Kong: Longman.Search in Google Scholar
Li, Shuhao. 2003. Yangxiong Fangyan yu Fangyan Dilixue Yanjiu [Yangxiong’s Dialect and dialect geography]. Chengdu: Bashu Shushe [Bashu Press].Search in Google Scholar
Li, Xiaofan & Mengbing Xiang. 2009. Hanyu fangyanxue jichu jiaocheng [An introductory course on Chinese dialectology]. Beijing: Peking University Press.Search in Google Scholar
List, Johann-Mattis, Shijulal Nelson-Sathi, William Martin & Hans Geisler. 2014. Using phylogenetic networks to model Chinese dialect history. Language Dynamics and Change 4. 222–252. https://doi.org/10.1163/22105832-00402008.Search in Google Scholar
List, Johann-Mattis. 2015. Network perspectives on Chinese dialect history. Bulletin of Chinese Linguistics 8. 42–67.Search in Google Scholar
Liu, Cunhan. 1995. Guinan Pinghua: Yuefangyan de Yige Fenzhi [The Pinghua in southern of Guangxi: a branch of Yue]. Paper presented at the 5th International Symposium on Yue Dialects, Jinan University, 21–23 December.Search in Google Scholar
Liu, Zhenfa. 2002. Hanyu Fangyan de Fenlei Biaozhun yu Kejiahua zai Hanyu Fenlei Shang de Wenti [The classification criteria of Chinese dialects and the issues about “Hakka Dialects”]. Journal of Chinese Linguistics 30(1). 82–96.Search in Google Scholar
Liu, Danqing. 2020. Generic expressions in northern Zhejiang Wu dialects: A rare type of genericity-mighty dialects. Zhongguo Yuwen [Studies of the Chinese Language] 4. 395–412.Search in Google Scholar
Lu, Zhiji. 1992. Hanyu Fangyan Shuliang Yanjiu Tansuo [A quantitative exploration of Chinese dialects]. Beijing: Yuwen Chunbanshe [Language & Culture Press].Search in Google Scholar
Luo, Changpei. 1950. Yuyan yu Wenhua [Languages and culture]. Beijing: Peking University Press.Search in Google Scholar
Nakanishi, Hiroki. 2010. On the genetic affiliation of Shehua. In William S.-Y. Wang (ed.), Diachronic change and language contact (Journal of Chinese Linguistics Monograph Series 24), 247–267. Hong Kong: The Chinese University Press.Search in Google Scholar
Nerbonne, John, Wilbert Heeringa & Peter Kleiweg. 1999. Comparison and classification of dialects. In Henry S. Thompson & Alex Lascarides (eds.), Proceedings of 9th Meeting of the European Chapter of the Association for Computational Linguistics, 281–282. Bergen: Association for Computational Linguistics.10.3115/977035.977086Search in Google Scholar
Nerbonne, John & William Kretzschmar. 2003. Introducing computational techniques in dialectometry. Computers and the Humanities 37. 245–255. https://doi.org/10.1023/a:1025064105053.10.1023/A:1025064105053Search in Google Scholar
Nerbonne, John & Peter Kleiweg. 2003. Lexical distance in LAMSAS. Language Resources and Evaluation 37(3). 339–357. https://doi.org/10.1023/a:1025042402655.10.1023/A:1025042402655Search in Google Scholar
Nerbonne, John, Rinke Colen, Charlotte Gooskens, Peter Kleiweg & Therese Leinonen. 2011. Gabmap – a web application for dialectology. Dialectologia Special Issue (2). 65–89.Search in Google Scholar
Nerbonne, John & William A. Kretzschmar. 2013. Dialectometry++. Literary and Linguistic Computing 28(1). 2–12. https://doi.org/10.1093/llc/fqs062.Search in Google Scholar
Norman, Jerry. 1988. Chinese. Cambridge: Cambridge University Press.Search in Google Scholar
Norman, Jerry. 1989. What is a Kejia dialect? In the Proceedings of the 2nd Academia Sinica International Conference on Sinology: Section on Language and Script, vol. 1, 323–344. Taipei: Academia Sinica.Search in Google Scholar
Norman, Jerry. 1997. Some thoughts on the early development of Mandarin. In Anne O. Yue & Mitsuaki Endo (eds.), In memory of Mantaro Hashimoto, 21–28. Tokyo: Utitashoten Press.Search in Google Scholar
Sagart, Laurent. 1988. On Gan-Hakka. Tsing Hua Journal of Chinese Studies 18. 141–160.Search in Google Scholar
Séguy, Jean. 1973. La dialectométrie dans l’Atlas linguistique de la Gascogne. Revue de Linguistique Romane 37. 1–24.Search in Google Scholar
Schüppert, Anja & Charlotte Gooskens. 2010. The influence of extra-linguistic factors on mutual intelligibility: Some preliminary results from Danish and Swedish pre-schoolers. In Barry Heselwood & Clive Upton (eds.), Papers from the Thirteenth International Conference on Methods in Dialectology, 194–203. Frankfurt/M: Peter Lang.Search in Google Scholar
Shen, Zhongwei. 2016. Horizontal transmission and dialect formation. In Ik-sang Eom & Zhang Weijia (eds.), Language evolution and changes in Chinese. (Journal of Chinese Linguistics Monograph Series 26), 21–54. Hong Kong: Chinese University of Hong Kong.Search in Google Scholar
Sheng, Yimin. 2014. A reference grammar of Shaoxing Wu dialect. Tianjin: Nankai University dissertation.Search in Google Scholar
Shi, Menghui. 2016. The distribution of (ø) in the Shanghai urban dialect: A case study of the prestigious form shift. Zhongguo Yuwen [Studies of the Chinese Language] 4. 460–467.Search in Google Scholar
Szeto, Puiyui, Umberto Ansaldo & Stephen Matthews. 2018. Typological variation across Mandarin dialects: An areal perspective with a quantitative approach. Linguistic Typology 22(2). 233–275. https://doi.org/10.1515/lingty-2018-0009.Search in Google Scholar
Szeto, Puiyui & Chingduang Yurayong. 2021. Sinitic as a typological sandwich: Revisiting the notions of Altaicization and Taicization. Linguistic Typology 25(3). 551–599. https://doi.org/10.1515/lingty-2021-2074.Search in Google Scholar
Tang, Chaoju. 2018. Dialects of Chinese. In Charles Boberg, John Nerbonne & Dominic Watt (eds.), The handbook of dialectology, 547–558. Oxford: Wiley Blackwell.10.1002/9781118827628.ch34Search in Google Scholar
Wang, Feng & William S.-Y. Wang. 2004. Basic words and language evolution. Language and Linguistics 5(3). 643–662.Search in Google Scholar
Wang, Fushi. 1982. Hunan Luxi Waxianghua Yuyin [The phonology of the Xianghua in Luxi, Huanan Province]. Yuyan Yanjiu [Studies in Language and Linguistics] 1. 139–151.Search in Google Scholar
Wang, Futang. 1998. Hanyu Fangyan Yuyin de Yanbian he Cengci [The phonological evolution and stratification of Chinese dialects]. Beijing: Yuwen Chubanshe [Language and Culture Press].Search in Google Scholar
Wang, Hongjun. 2014. Lishi Yuyanxue Fangfalun yu Hanyu Fangyan Yinyunshi Gean Yanjiu [The methodology of historical linguistics and the case studies of phonological history of Chinese dialects]. Beijing: Shangwu Yinshuguan [The Commercial Press].Search in Google Scholar
Wang, William S-Y & Zhongwei Shen. 1992. Hanyu Fangyan Guanxi de Jiliang Biaoshu [A quantitative description of relationship between Chinese dialects]. Zhongguo Yuwen [Studies of the Chinese Language] 2. 81–92.Search in Google Scholar
Ward, Joe H.Jr. 1963. Hierarchical grouping to optimize an objective function. Journal of the American Statistical Association 58. 236–244. https://doi.org/10.1080/01621459.1963.10500845.Search in Google Scholar
Wei, Shuguan. 1999. Guibei Pinghua Zhiyi [Questions on Pinghua in northern Guangxi]. Guangxi Mingzu Xueyuan Xuebao [Journal of Guangxi University for nationalities (Philosophy and Social Sciences.)] 21(4). 117–122.Search in Google Scholar
Wieling, Martijn & John Nerbonne. 2015. Advances in dialectometry. Annual Review in Linguistics 1(1). 243–264. https://doi.org/10.1146/annurev-linguist-030514-124930.Search in Google Scholar
Wu, Zhongjie. 2004. Shezu Yuyan Yanjiu [A study of the language of She]. Taiwan: Tsinghua University dissertation.Search in Google Scholar
Xie, Jianyou. 2001. Guangxi Pinghua Yanjiu [A study of Pinghua in Guangxi]. Beijing: Chinese Academy of Social Sciences dissertation.Search in Google Scholar
Xing, Xiangdong. 2020. Xibei Diqu Hanyu Fangyan Dilixue de Yanjiu [Geolinguistic studies of the Chinese dialects in northwest]. Beijing: The Commercial Press.Search in Google Scholar
Xu, Tongqiang. 1991. Lishi yuyanxue [Historical linguistics]. Beijing: The Commercial Press.Search in Google Scholar
You, Wenliang. 2002. Shezu Yuyan [The language of She]. Fuzhou: Fujian People Press.Search in Google Scholar
You, Wenliang, Lei Nan & Ruitang Lan. 2005. Fenghuanshan Sheyu [The She language in Fenghuangshan]. Changchun: Jinlin People Press.Search in Google Scholar
Yuan, Jiahua. 1960. Hanyu fangyan gaiyao [An outline of Chinese dialects]. Beijing: Wenzi Gaige Chubanshe [Language Reform Press].Search in Google Scholar
Yuan, Jiahua. 2001. Hanyu Fangyan Gaiyao [An outline of Chinese dialects], 2nd edn. Beijing: Yuwen Chubanshe [Language Publishing House].Search in Google Scholar
Zavyalova, Olga & Elena Astrakhan. 1988. The linguistic geography of China, Progress Report, Vol. 1, Grant-in-Aid for Scientific Research (A), 1997–1999, directed by Mitsuaki Endo, Linguistic Geography & Cultural-Natural Geography in China. Tokyo: Aoyama Gakuin University.Search in Google Scholar
Zhan, Bohui. 2002. Lvelun Guangxi Pinghua [Discussion on the Pinghua in Guangxi]. In Jinian Wangli Xiansheng Bainian Danchen Xueshu Lunwenji [Collection of academic papers commemorating the 100th birthday of Wang Li], 355–363. Beijing: The Commercial Press.Search in Google Scholar
Zhang, Guangyu. 1999. Dongnan Fangyan Guanxi Zonglun [A comprehensive discussion of southeast dialects]. Fangyan [Dialect] 1. 33–44.Search in Google Scholar
Zhao, Zelin. 2004. Shilun Shehua de Guishu [A discussion on the attribution of Shehua]. Yuyan Kexue [Linguistic sciences] 3. 87–94.Search in Google Scholar
Zhao, Rixin. 2008. Anhuisheng de Hanyu Fangyan [The Chinese dialects in Anhui Province]. Fangyan [Dialect] 4. 361–368.Search in Google Scholar
Zhou, Zhenhe & Kathy Lo. 1991. Migrations in Chinese history and their legacy on Chinese dialects. In William S.-Y. Wang (ed.), Languages and dialects of China (Journal of Chinese Linguistics Monograph Series) 3, 29–49. Hongkong: The Chinese University of Hong Kong Press.Search in Google Scholar
Zhou, Zhenhe & Rujie You. 2006. Fangyan yu Zhongguo Wenhua [Dialects and Chinese culture], 2nd edn. Shanghai: Shanghai Renmin Chubanshe [Shanghai People Press].Search in Google Scholar
© 2024 the author(s), published by De Gruyter, Berlin/Boston
This work is licensed under the Creative Commons Attribution 4.0 International License.
Articles in the same Issue
- Frontmatter
- Metaphor forces argument overtness
- Binomials in English and French: ablaut, rhyme and syllable structure
- The interpretation of animate nouns in child and adult Mandarin: from the Universal Grinder to syntactic structure
- Geographic structure of Chinese dialects: a computational dialectometric approach
- Spanish lower and upper bounded change of state verbs: focusing on transitive experiencer object verbs
- Constructional sources of durational shortening in discourse markers
- An alternative view of the English alternative embedded passive