Time in range and serum Cystatin C as predictors of diabetic kidney disease in patients with type 2 diabetes
-
LiangJun He

 ,
Jing Chen
,
WeiHong Chen
und
XinRu Shen
,
Jing Chen
,
WeiHong Chen
und
XinRu Shen

Abstract
Objectives
Time in range (TIR) has become a new research focus in blood glucose management and is expected to be a new indicator to evaluate the effect of blood glucose control and predict the complications of diabetes. However, data evaluating its association with microvascular complications, especially diabetic kidney disease (DKD), are lacking. Therefore, this study aimed to investigate the relationship between TIR and serum Cystatin C (Cys C) and DKD.
Methods
Two hundred patients with type 2 diabetes mellitus (T2DM) were included. Demographic and anthropometric data as well as blood and urine samples were collected. Serum Cys C concentration was determined. TIR (glucose 70–180 mg/dL) was monitored. Independent variables of DKD were evaluated by multiple logistic regression analysis, the diagnostic value of TIR and serum Cys C in DKD was assessed by ROC curve analysis, and the correlation between TIR and serum Cys C and other biochemical indicators was analyzed by Spearman correlation method.
Results
TIR decreased and Cys C increased with DKD progression in patients with T2DM. TIR and Cys C were independent predictors of DKD. The combined detection of TIR and Cys C had better diagnostic performance of DKD. A positive correlation existed between serum Cys C and course of disease, while a negative correlation was observed between estimated glomerular filtration rate (eGFR) and serum Cys C.
Conclusions
TIR and serum Cys C are associated with DKD and are expected to be potential markers for DKD diagnosis.
Introduction
Type 2 diabetes mellitus (T2DM) is a prevalent endocrine disorder and remains a public health burden with increased incidence and mortality risks [1], [2], [3], [4]. Patients with T2DM are more likely to be overweight or obese, which indicates insulin resistance and dyslipidemia along with hyperglycemia [5]. For patients with T2DM, glycemic or lipid values and their variability can significantly predict all-cause mortality and the occurrence of complications, including micro- and macrovascular complications [6], 7]. Growing evidence has indicated that chronic inflammation, hyperglycemia, and dyslipidemia are all involved in insulin resistance, pathogenesis of T2DM, and systematic diabetic complications [8], 9]. There is a common microvascular complication of T2DM called diabetic kidney disease (DKD), which can develop into chronic kidney disease and occur in about 40 % of patients with T2DM [10]. DKD-associated features include glomerular sclerosis, increased proteinuria, and decreased glomerular filtration rate (GFR) [11]. Urinary microalbumin has been applied as a noninvasive marker to diagnose DKD and predict disease outcome. However, the concentration of urinary microalbumin fluctuates easily, which affects its sensitivity and specificity [12]. Also, the sensitivity of routine renal function indicators (urea and creatinine) are not enough to screen DKD [12]. Therefore, sensitive and specific biomarkers need to be further discovered to monitor DKD.
Hemoglobin A1c (HbA1c) can monitor long-term blood glucose and assess the risk of diabetic complications [13], 14]. However, multiple factors can affect HbA1c, leading to discrepancies between HbA1c measurements and true blood glucose results. In addition, it comes to an information failure in the setting of extreme hypoglycemia or hyperglycemia, blood glucose trends, and blood glucose fluctuations [15]. Continuous glucose monitoring (CGM) devices address many of the limitations associated with HbA1c, and the measures are now incorporated into the monitoring of diabetic patients [16]. Several indicators are provided on the CGM device, which measures interstitial fluid glucose every 1–5 min. Glucose Management Indicator (GMI) is calculated based on the average glucose [17]. Defined as the percentage of time, glucose is between 70 and 180 mg/dL (3.9–10.0 mmol/L), is related to HbA1c and can be used as a proxy for blood glucose control [16]. International consensus suggests that TIR be 70 %, consistent with the 7 % level of HbA1c, with a 10 % increase in TIR resulting in a 0.5 % decrease in HbA1c [18]. TIR increases by 5 % in patients with T2DM are associated with clinical benefits [16]. TIR is associated with diabetic microvascular complications, according to growing evidence [19], [20], [21]. However, TIR has been poorly studied in DKD.
GFR is linked to Cystatin C (Cys C), a protein that is not glycosylated and has low molecular weight of 13 kDa [22]. Cys C remains stable in almost all nucleated cells in the human body. It is not tissue-specific, has no age or gender restrictions, and is unaffected by inflammation or activity. In the circulatory system, the kidney is the only organ that interferes with Cys C clearance, and serum Cys C concentration is mainly determined by GFR [23], [24], [25]. Previous studies [26], 27] have shown that Cys C may be a diagnostic marker of DKD due to high sensitivity regardless of the degree of renal insufficiency.
Therefore, this study aims to explore the relationship between TIR and serum Cys C and DKD, as well as to analyze the diagnostic value of TIR and serum Cys C in DKD.
Materials and methods
Participants
This study was a clinical observational study and followed the STROBE guidelines. The diagnostic criteria for T2DM follow the guidelines recommended by the American Diabetes Association (ADA), that is, fasting blood glucose (FBG)≥7.0 mmol/L, 2-h blood glucose≥11.1 mmol/L, and/or HbA1c≥6.5 %. Exclusion criteria: (1) type one diabetes or other types of diabetes; (2) acute infectious diseases and inflammation; (3) diabetes-independent renal insufficiency; (4) non diabetic albuminuria; (5) acute and chronic liver diseases and cardiovascular and cerebrovascular diseases; (6) administration with drugs (GLP-1 receptor agonists, SGLT2 inhibitors, renin-angiotensin system inhibitors, etc.) or surgery within 1 month.
Finally enrolled patients with T2DM were classified into three groups [28]: (1) normoalbuminuria (NA) group (urinary albumin creatinine ratio [UACR]<30 mg/g, n=75); (2) microalbuminuria (MA) group (30 mg/g≤UACR < 300 mg/g, n=65); (3) clinical albuminuria (CA) group (UACR≥300 mg/g, n=60). According to the ADA guidelines [29], patients in the MA and CA groups were considered DKD (UACR≥30 mg/g). The procedures were approved by the Ethics Committee of Maanshan People’s Hospital (No. 202008AH-10). All participants signed informed consent forms.
Samples and biochemical index determination
Blood specimens were drawn the next morning after fasting for 10–12 h HbA1c was measured in 2 mL EDTA K2 anticoagulant venous blood. Non-anticoagulant venous blood (5 mL) was centrifuged (1,200 g, 10 min) for the detection of FBG, total cholesterol (TC), triglyceride (TG), and Cys C. Urine samples (10 mL) were centrifuged (400 g, 10 min) to detect urinary albumin and creatinine, and UACR was calculated.
HbA1c was measured on the HLC-723G8 HbA1c analyzer (Tosoh Corporation). FBG, TC, TG, carbamide, serum creatinine (SCr), and Cys C were measured on the AU5800 biochemical analyzer (Beckman Coulter). The estimated glomerular filtration rate (eGFR) was calculated following the Cockcroft-Gault equation “[(140 - age) × body weight (kg)]/SCr × 72 × [female 0.85]” and adjusted for body surface area of 1.73 m2 [30].
CGM
Blood glucose was monitored using Medtronic Enlite sensors (Medtronic, USA) for 6 days in two separate measurements, spaced 2 weeks apart. Interstitial glucose was recorded every 5 min for each measurement, ranging from 40 to 400 mg/dL. Glucose was also self-monitored twice daily by each patient with T2DM using the Abbott Freestyle Lite glucose meter (Abbott, USA). Each CGM report was evaluated to exclude periods of CGM dysfunction or significant dissynchrony (>30 %) between CGM and finger blood glucose.
Calculating TIR is done by determining what percentage of CGM glucose readings fall within the target range [16]. GMI is an estimated HbA1c based on CGM data calculated for 12 days [17].
Statistical analysis
SPSS version 19 was used for statistical analysis. Data normality was tested using the Shapiro-Wilk test, and homogeneity of variance was tested using the Levene test Variables following normal distribution were expressed as means and standard deviations (SD) and analyzed by one-way ANOVA and Tukey’s HSD test, while variables in non-normal distribution were shown as median and quartile ranges (IQR) and analyzed by Kruskal-Wallis H and Dunn test. Chi-square test was employed for categorical variables. Multiple logistic regression analysis was used to evaluate the independent variables of DKD, and ROC curves were generated. Correlation analysis was done with Spearman rank correlation analysis. p<0.05 meant statistical significance.
Results
General data of patients with T2DM
The study included 200 patients with T2DM. A summary of the baseline demographic and clinical characteristics of the patients can be found in Table 1.
Baseline demographic and clinical characteristics of patients with T2DM.
| Parameters | T2DM (n=200) |
|---|---|
| Age, years, mean ± SD | 54.09 ± 12.21 |
| Gender, male/female, n | 113/77 |
| BMI, kg/m2, mean ± SD | 23.53 ± 1.71 |
| Course of disease, years, mean ± SD | 10.57 ± 4.18 |
| SBP, mmHg, mean ± SD | 129.96 ± 9.60 |
| DBP, mmHg, mean ± SD | 83.96 ± 5.70 |
| FBG, mmol/L, mean ± SD | 9.72 ± 1.85 |
| HbA1c, %, mean ± SD | 7.32 ± 0.87 |
| TC, mmol/L, mean ± SD | 5.04 ± 0.35 |
| TG, mmol/L, mean ± SD | 1.26 ± 0.32 |
| UACR, mg/g, median (IQR) | 84.16 (11.27, 483.65) |
| eGFR, mL/min/1.73m2, median (IQR) | 98 (92, 104) |
| Cys C, mg/L, median (IQR) | 0.92 (0.77, 1.34) |
| GMI, %, mean ± SD | 7.20 ± 0.84 |
| TIR, %, mean ± SD | 62.70 ± 11.67 |
-
T2DM, type 2 diabetes mellitus; BMI, body mass index; SBP, systolic blood pressure; DBP, diastolic blood pressure; FBG, fasting blood glucose; TC, total cholesterol; TG, triglyceride; UACR, urinary albumin creatinine ratio; eGFR, estimated glomerular filtration rate; Cys C, Cystatin C; GMI, Glucose Management Indicator; TIR, time in range.
Serum Cys C increases, and TIR decreases with DKD progression
According to UACR level, patients with T2DM were assigned into NA, MA, and CA groups. Significant differences were seen in course of disease, eGFR, TIR, and serum Cys C but not in age, gender, BMI, blood pressure (systolic blood pressure and diastolic blood pressure), FBG, HbA1c, TC, and TG among all groups (Table 2). Course of disease and serum Cys C were increased in DKD patients (MA and CA groups) and eGFR and TIR were decreased. With DKD progression, serum Cys C level gradually increased, and TIR decreased (Figure 1A–D).
Biochemical indexes of patients with T2DM grouped according to UACR.
| Parameters | Patients with T2DM without kidney disease | Patients with DKD | p-Value | Analysis method | |
|---|---|---|---|---|---|
| NA group (n=75) | MA group (n=65) | CA group (n=60) | |||
| Age, years, mean ± SD | 52.43 ± 11.40 | 54.68 ± 12.72 | 55.54 ± 12.55 | 0.305 | One-way ANOVA and Tukey’s HSD test |
| Gender, male/female, n | 48/27 | 38/27 | 37/23 | 0.798 | Chi-square test |
| BMI, kg/m2, mean ± SD | 23.29 ± 1.76 | 23.58 ± 1.73 | 23.78 ± 1.84 | 0.273 | One-way ANOVA and Tukey’s HSD test |
| Course of disease, years | 8.00 ± 2.35 | 11.50 ± 3.28 | 12.76 ± 4.12 | <0.001 | One-way ANOVA and Tukey’s HSD test |
| SBP, mmHg, mean ± SD | 128.60 ± 8.76 | 131.20 ± 9.87 | 130.31 ± 10.25 | 0.265 | One-way ANOVA and Tukey’s HSD test |
| DBP, mmHg, mean ± SD | 82.80 ± 5.54 | 84.60 ± 6.18 | 84.73 ± 5.65 | 0.090 | One-way ANOVA and Tukey’s HSD test |
| FBG, mmol/L, mean ± SD | 9.42 ± 1.76 | 9.78 ± 1.65 | 10.03 ± 2.58 | 0.209 | One-way ANOVA and Tukey’s HSD test |
| HbA1c, %, mean ± SD | 7.18 ± 0.60 | 7.34 ± 0.79 | 7.46 ± 0.98 | 0.121 | One-way ANOVA and Tukey’s HSD test |
| TC, mmol/L, mean ± SD | 4.99 ± 0.25 | 5.06 ± 0.32 | 5.07 ± 0.48 | 0.350 | One-way ANOVA and Tukey’s HSD test |
| TG, mmol/L, mean ± SD | 1.21 ± 0.28 | 1.28 ± 0.36 | 1.30 ± 0.40 | 0.276 | One-way ANOVA and Tukey’s HSD test |
| eGFR, mL/min/1.73m2, median (IQR) | 104 (99, 108) | 96 (90, 101) | 93 (86, 99) | <0.001 | Kruskal-Wallis H and dunn test |
| Cys C, mg/L, median (IQR) | 0.75 (0.66, 0.89) | 0.91 (0.76, 1.26) | 1.13 (0.85, 1.41) | <0.001 | Kruskal-Wallis H and dunn test |
| GMI, %, mean ± SD | 7.08 ± 0.72 | 7.22 ± 0.88 | 7.32 ± 0.95 | 0.256 | One-way ANOVA and Tukey’s HSD test |
| TIR, %, mean ± SD | 68.75 ± 12.50 | 61.67 ± 10.41 | 56.25 ± 8.33 | <0.001 | One-way ANOVA and Tukey’s HSD test |
-
T2DM, type 2 diabetes mellitus; UACR, urinary albumin creatinine ratio; DKD, diabetic kidney disease; NA, normoalbuminuria; MA, microalbuminuria; CA, clinical albuminuria; BMI, body mass index; SBP, systolic blood pressure; DBP, diastolic blood pressure; FBG, fasting blood glucose; TC, total cholesterol; TG, triglyceride; eGFR, estimated glomerular filtration rate; Cys C, Cystatin C; GMI, glucose management indicator; TIR, time in range.
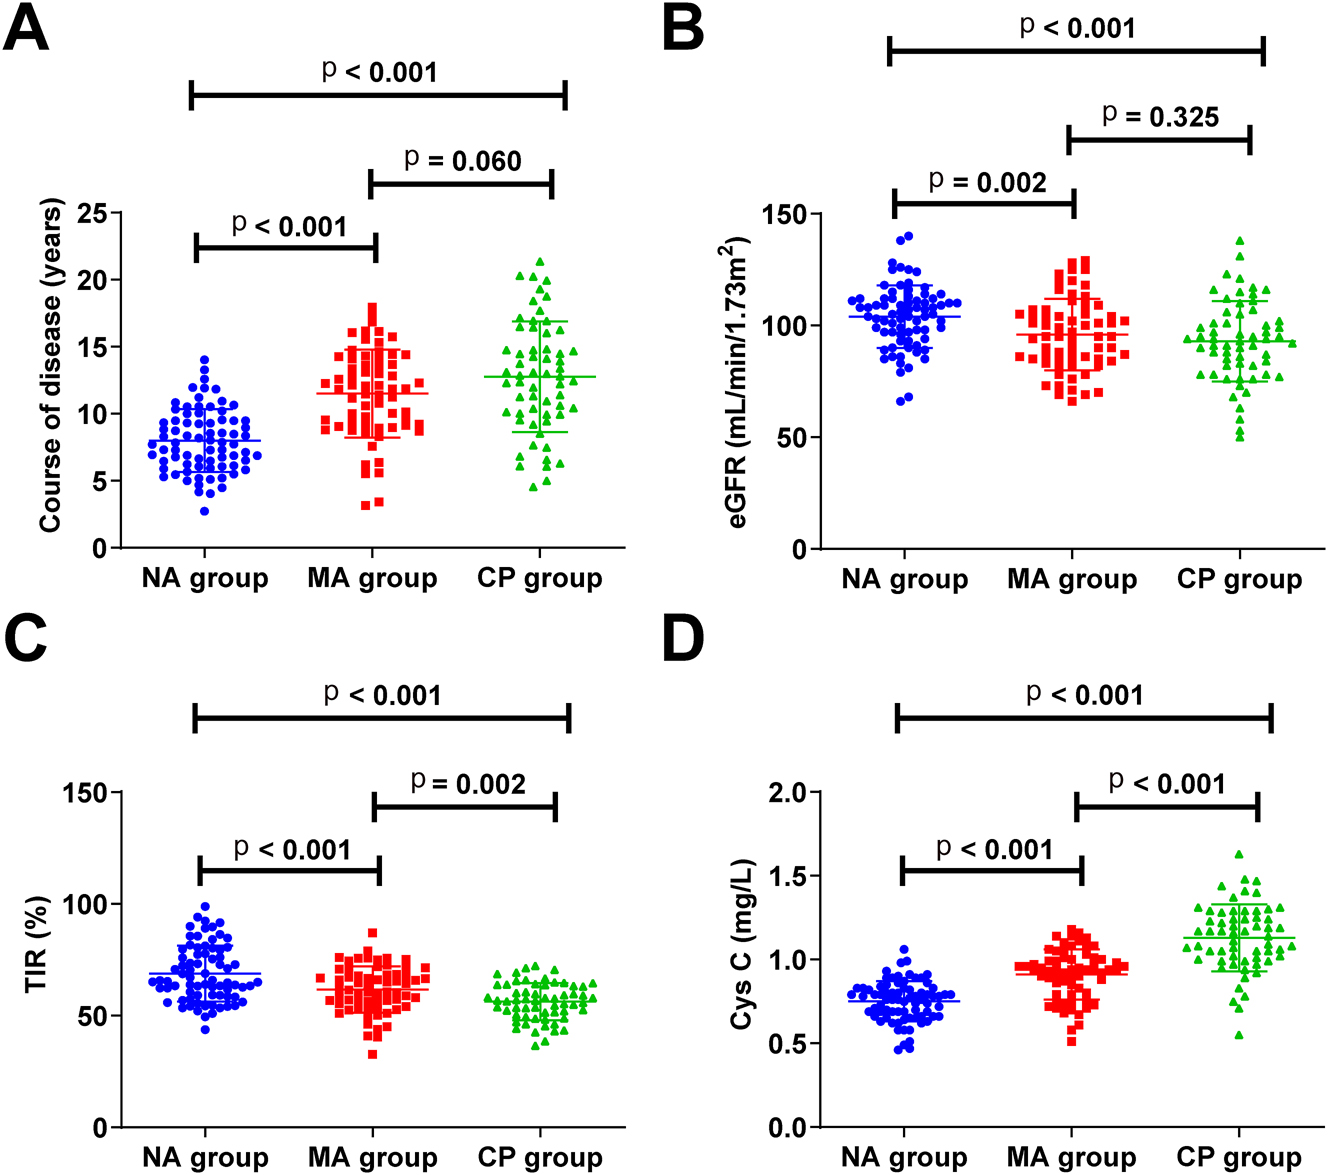
Serum Cys C level gradually increases and TIR decreases with DKD progression (A–D) course of disease, eGFR, TIR, and serum Cys C levels in patients with T2DM. eGFR, estimated glomerular filtration rate; TIR, time in range; Cys C, Cystatin C.
TIR and serum Cys C are independent variables for DKD
For the variables with significant differences in Table 2 (Course of disease, eGFR, Cys C, and TIR), multiple logistic regression analysis was performed using the stepwise method. The multiple logistic regression model automatically introduced or excluded independent variables based on their statistical significance. Course of disease and eGFR were excluded from stepwise screening as not statistically significant. The final established binary logistic regression model was: ln (P/1-P)=3.124–0.087 × TIR + 0.339 × Cys C. The −2 log-likelihood value of the model was 198.354, and the Hosmer-Lemeshow test yielded a p-value=0.778 (>0.05), indicating good model fit. In conclusion, TIR and serum Cys C levels are independent variables of DKD (Table 3).
Multiple logistic regression analysis of independent variables for DKD.
| Variables | OR | 95 % CI | p-Value |
|---|---|---|---|
| Course of disease | 1.115 | 0.953–1.262 | 0.145 |
| eGFR | 1.214 | 0.990–1.545 | 0.078 |
| Cys C | 1.404 | 1.228–1.605 | <0.001 |
| TIR | 0.917 | 0.887–0.949 | <0.001 |
-
OR, eodds ratio; CI, confidence interval; GFR, estimated glomerular filtration rate; Cys C, Cystatin C; TIR, time in range.
TIR and Cys C have good diagnostic value for DKD
According to the above results (Table 3), ROC curve analysis evaluated the diagnostic value of TIR and serum Cys C in DKD. TIR (cut-off = 61.52 %, AUC=0.811) and serum Cys C (cut-off = 0.95 mg/L, AUC=0.778) had good diagnostic value of DKD (Figure 2A and B). Subsequently, the predicted probabilities derived from the binary logistic regression model were used to construct an ROC curve. The results revealed that the combination of TIR and serum Cys C had a higher diagnostic value (cut-off = 0.59, AUC=0.861) (Figure 2C).
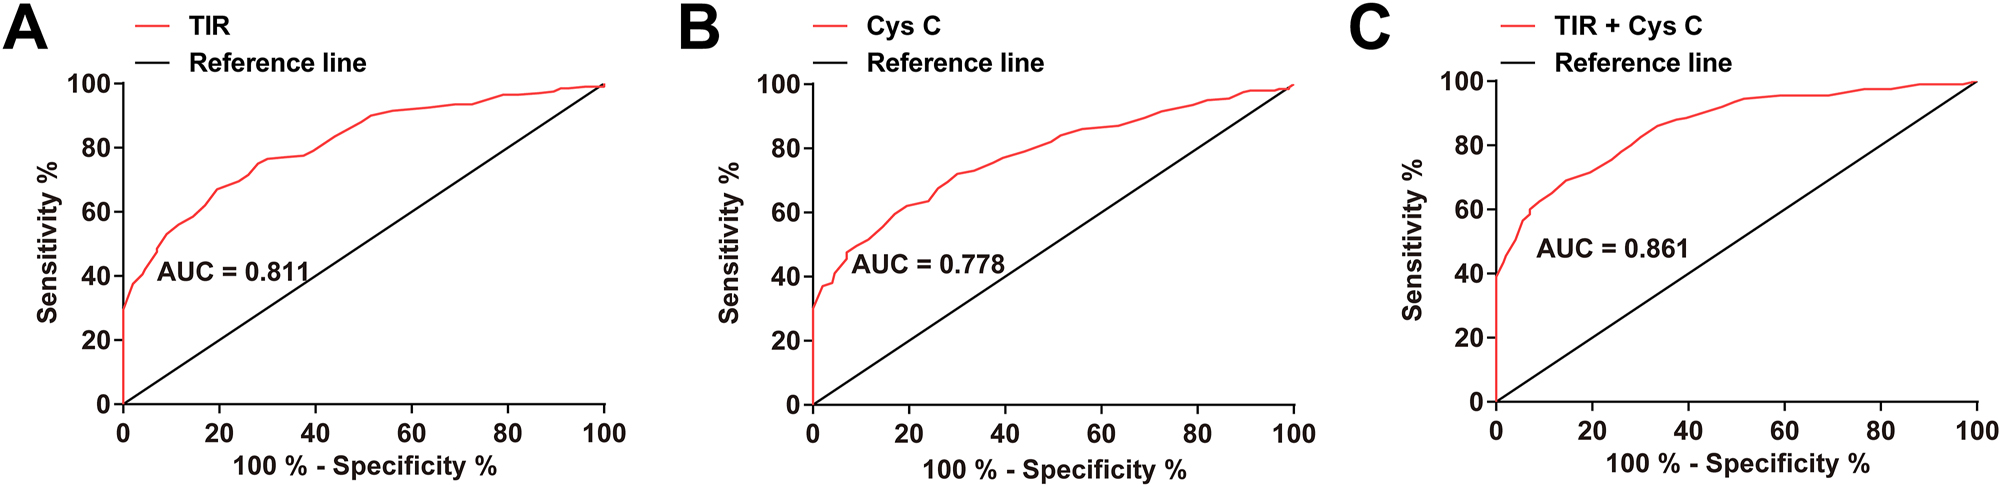
TIR and serum Cys C have good diagnostic values of DKD (A–C) ROC curve analysis of the diagnostic value of TIR and serum Cys C in DKD. TIR, time in range; Cys C, Cystatin C.
Correlation between TIR, serum Cys C, and other biochemical indicators
TIR was negatively correlated with the course of disease and positively correlated with eGFR, while serum Cys C showed opposite correlation with these two measures (Table 4).
Correlation between TIR, serum Cys C and other biochemical indicators.
| Variables | TIR | Cys C | ||
|---|---|---|---|---|
| r | p-Value | r | p-Value | |
| Age | −0.056 | 0.702 | 0.035 | 0.745 |
| BMI | −0.027 | 0.799 | 0.014 | 0.880 |
| Course of disease | −0.557 | <0.001 | 0.483 | <0.001 |
| SBP | −0.252 | 0.067 | 0.229 | 0.102 |
| DBP | −0.153 | 0.270 | 0.144 | 0.315 |
| FBG | −0.076 | 0.682 | 0.065 | 0.659 |
| HbA1c | 0.029 | 0.767 | 0.018 | 0.865 |
| TC | 0.094 | 0.543 | 0.080 | 0.578 |
| TG | −0.031 | 0.755 | −0.020 | 0.832 |
| eGFR | 0.499 | <0.001 | −0.436 | <0.001 |
| GMI | −0.234 | 0.098 | 0.212 | 0.130 |
-
Cys C, Cystatin C; TIR, time in range; BMI, body mass index; SBP, systolic blood pressure; DBP, diastolic blood pressure; FBG, fasting blood glucose; TC, total cholesterol; TG, triglyceride; eGFR, estimated glomerular filtration rate; GMI, glucose management indicator.
Discussion
The pathogenesis of DN is very complex, including genetic factors and metabolic disorders. Metabolic abnormalities caused by hyperglycemia, abnormal metabolism of vasoactive substances, altered renal hemodynamics, and proteinuria after renal injury are some of the factors that cause glomerular basement membrane thickening, tethered cell proliferation, and glomerulosclerosis [31], and ultimately leading to end-stage renal failure and death [32]. Patients with DKD face great difficulties in obtaining early treatment due to its insidious onset [33]. A kidney disease can be reversed if treated promptly and effectively, but edema symptoms or obvious proteinuria will result in a loss of ideal treatment time. Therefore, it is urgent to search for DKD early diagnostic markers.
Several studies have demonstrated the potential of TIR to predict diabetic microvascular complications. One study has found that a 10 % increase in TIR reduces abnormal carotid intima-media thickness by 6.4 % [34]. In patients with type 1 diabetes mellitus, 1-year improvement in TIR is associated with reduced proteinuria (a 10 % increase in TIR is associated with a 19 % decrease in UACR) [35]. TIR quartile is negatively correlated with the severity of DR [36]. Proteinuria is negatively associated with TIR [37], while DPN is associated with chronic kidney disease and T2DM [38].
In this study, patients with T2DM were classified according to UACR [39] and those in the MA and CA groups suffered from DKD. Patients with DKD had a longer duration of diabetes and a lower eGFR compared to patients with diabetes alone. Additionally, a significantly lower time in range (TIR) was observed in patients with DKD, and TIR decreased progressively with the advancement of DKD. Serum Cys C increased in DKD patients. TIR and serum Cys C were independent variables for predicting DKD. Further, TIR and serum Cys C had clinical value in the differential diagnosis of DKD and simple diabetes mellitus, and the combined detection of TIR and serum Cys C could further improve their diagnostic ability for DKD. Serum Cys C levels in diabetic patients can be considered biomarkers of DKD [40], [41], [42], [43] and can predict DKD progression [44]. The above results are highly consistent with the results of this study.
Several limitations need to be addressed in our research. This was a single-center study, and participants’ characteristics were not sufficiently diverse, limiting the generalizability of the findings. Also, as the study did not follow up on the subjects, it is unclear whether TIR and serum Cys C are associated with DKD prognosis.
Conclusions
TIR and serum Cys C are associated with DKD and are expected to be potential markers for DKD diagnosis.
-
Research ethics: The present study was approved by the Ethics Committee of Maanshan People’s Hospital (No. 202008AH-10) and written informed consent was provided by all patients prior to the study start. All procedures were performed in accordance with the ethical standards of the Institutional Review Board and The Declaration of Helsinki, and its later amendments or comparable ethical standards.
-
Informed consent: Informed consent was obtained from all individuals included in this study, or their legal guardians or wards.
-
Author contributions: LiangJun He and Jing Chen designed the research study. WeiHong Chen and XinRu Shen performed the research. LiangJun He and WeiHong Chen provided help and advice. Jing Chen and XinRu analyzed the data. LiangJun He and Jing Chen wrote the manuscript. All authors contributed to editorial changes in the manuscript. All authors have accepted responsibility for the entire content of this manuscript and approved its submission.
-
Use of Large Language Models, AI and Machine Learning Tools: None declared.
-
Conflict of interest: The authors state no conflict of interest.
-
Research funding: None declared.
-
Data availability: Not applicable.
References
1. Long, J, Yang, H, Yang, Z, Jia, Q, Liu, L, Kong, L, et al.. Integrated biomarker profiling of the metabolome associated with impaired fasting glucose and type 2 diabetes mellitus in large-scale Chinese patients. Clin Transl Med 2021;11:e432. https://doi.org/10.1002/ctm2.432.Suche in Google Scholar PubMed PubMed Central
2. Lu, Y, Yang, H, Xu, Z, Tang, X. Association between different obesity patterns and the risk of developing type 2 diabetes mellitus among adults in eastern China: a cross-sectional study. Diabetes Metab Syndr Obes 2021;14:2631–9. https://doi.org/10.2147/dmso.s309400.Suche in Google Scholar
3. Kim, YK, Ning, X, Munir, KM, Davis, SN. Emerging drugs for the treatment of diabetic nephropathy. Expet Opin Emerg Drugs 2022;27:417–30. https://doi.org/10.1080/14728214.2022.2155632.Suche in Google Scholar PubMed
4. Wei, JP, Wang, QH, Zheng, HJ, Wei, F. Research progress on non-drug treatment for blood glucose control of type 2 diabetes mellitus. Chin J Integr Med 2018;24:723–7. https://doi.org/10.1007/s11655-018-2844-2.Suche in Google Scholar PubMed
5. Daousi, C, Casson, IF, Gill, GV, MacFarlane, IA, Wilding, JP, Pinkney, JH. Prevalence of obesity in type 2 diabetes in secondary care: association with cardiovascular risk factors. Postgrad Med J 2006;82:280–4. https://doi.org/10.1136/pmj.2005.039032.Suche in Google Scholar PubMed PubMed Central
6. Wan, EYF, Yu, EYT, Chin, WY, Barrett, JK, Mok, AHY, Lau, CST, et al.. Greater variability in lipid measurements associated with cardiovascular disease and mortality: a 10-year diabetes cohort study. Diabetes Obes Metabol 2020;22:1777–88. https://doi.org/10.1111/dom.14093.Suche in Google Scholar PubMed PubMed Central
7. Lee, S, Zhou, J, Wong, WT, Liu, T, Wu, WKK, Wong, ICK, et al.. Glycemic and lipid variability for predicting complications and mortality in diabetes mellitus using machine learning. BMC Endocr Disord 2021;21:94. https://doi.org/10.1186/s12902-021-00751-4.Suche in Google Scholar PubMed PubMed Central
8. Bray, JJH, Foster-Davies, H, Salem, A, Hoole, AL, Obaid, DR, Halcox, JPJ, et al.. Glucagon-like peptide-1 receptor agonists improve biomarkers of inflammation and oxidative stress: a systematic review and meta-analysis of randomised controlled trials. Diabetes Obes Metabol 2021;23:1806–22. https://doi.org/10.1111/dom.14399.Suche in Google Scholar PubMed
9. Leite, MM, Dutra, MT, da Costa, MVG, Funghetto, SS, Silva, AO, de Lima, LR, et al.. Comparative evaluation of inflammatory parameters and substitute insulin resistance indices in elderly women with and without type 2 diabetes mellitus. Exp Gerontol 2021;150:111389. https://doi.org/10.1016/j.exger.2021.111389.Suche in Google Scholar PubMed
10. Alicic, RZ, Rooney, MT, Tuttle, KR. Diabetic kidney disease: challenges, progress, and possibilities. Clin J Am Soc Nephrol 2017;12:2032–45. https://doi.org/10.2215/cjn.11491116.Suche in Google Scholar PubMed PubMed Central
11. National Kidney Foundation. KDOQI clinical practice guideline for diabetes and CKD: 2012 update. Am J Kidney Dis 2012;60:850–86. https://doi.org/10.1053/j.ajkd.2012.07.005.Suche in Google Scholar PubMed
12. Chen, H, Li, H. Clinical implication of cystatin C and β2-Microglobulin in early detection of diabetic nephropathy. Clin Lab 2017;63:241–7. https://doi.org/10.7754/clin.lab.2016.160719.Suche in Google Scholar PubMed
13. Laiteerapong, N, Ham, SA, Gao, Y, Moffet, HH, Liu, JY, Huang, ES, et al.. The legacy effect in type 2 diabetes: impact of early glycemic control on future complications (the diabetes & aging study). Diabetes Care 2019;42:416–26. https://doi.org/10.2337/dc17-1144.Suche in Google Scholar PubMed PubMed Central
14. Stratton, IM, Adler, AI, Neil, HA, Matthews, DR, Manley, SE, Cull, CA, et al.. Association of glycaemia with macrovascular and microvascular complications of type 2 diabetes (UKPDS 35): prospective observational study. Br Med J 2000;321:405–12. https://doi.org/10.1136/bmj.321.7258.405.Suche in Google Scholar PubMed PubMed Central
15. Beck, RW, Connor, CG, Mullen, DM, Wesley, DM, Bergenstal, RM. The fallacy of average: how using HbA(1c) alone to assess glycemic control can be misleading. Diabetes Care 2017;40:994–9. https://doi.org/10.2337/dc17-0636.Suche in Google Scholar PubMed PubMed Central
16. Battelino, T, Danne, T, Bergenstal, RM, Amiel, SA, Beck, R, Biester, T, et al.. Clinical targets for continuous glucose monitoring data interpretation: recommendations from the international consensus on time in range. Diabetes Care 2019;42:1593–603. https://doi.org/10.2337/dci19-0028.Suche in Google Scholar PubMed PubMed Central
17. Bergenstal, RM, Beck, RW, Close, KL, Grunberger, G, Sacks, DB, Kowalski, A, et al.. Glucose management indicator (GMI): a new term for estimating A1C from continuous glucose monitoring. Diabetes Care 2018;41:2275–80. https://doi.org/10.2337/dc18-1581.Suche in Google Scholar PubMed PubMed Central
18. Danne, T, Nimri, R, Battelino, T, Bergenstal, RM, Close, KL, DeVries, JH, et al.. International consensus on use of continuous glucose monitoring. Diabetes Care 2017;40:1631–40. https://doi.org/10.2337/dc17-1600.Suche in Google Scholar PubMed PubMed Central
19. Beck, RW, Bergenstal, RM, Riddlesworth, TD, Kollman, C, Li, Z, Brown, AS, et al.. Validation of time in range as an outcome measure for diabetes clinical trials. Diabetes Care 2019;42:400–5. https://doi.org/10.2337/dc18-1444.Suche in Google Scholar PubMed PubMed Central
20. Hirsch, IB, Sherr, JL, Hood, KK. Connecting the dots: validation of time in range metrics with microvascular outcomes. Diabetes Care 2019;42:345–8. https://doi.org/10.2337/dci18-0040.Suche in Google Scholar PubMed PubMed Central
21. Sheng, X, Xiong, GH, Yu, PF, Liu, JP. The correlation between time in range and diabetic microvascular complications utilizing information management platform. Internet J Endocrinol 2020;2020:8879085. https://doi.org/10.1155/2020/8879085.Suche in Google Scholar PubMed PubMed Central
22. Lee, BW, Ihm, SH, Choi, MG, Yoo, HJ. The comparison of cystatin C and creatinine as an accurate serum marker in the prediction of type 2 diabetic nephropathy. Diabetes Res Clin Pract 2007;78:428–34. https://doi.org/10.1016/j.diabres.2007.06.015.Suche in Google Scholar PubMed
23. Kazama, JJ, Kutsuwada, K, Ataka, K, Maruyama, H, Gejyo, F. Serum cystatin C reliably detects renal dysfunction in patients with various renal diseases. Nephron 2002;91:13–20. https://doi.org/10.1159/000057599.Suche in Google Scholar PubMed
24. Rule, AD, Bergstralh, EJ, Slezak, JM, Bergert, J, Larson, TS. Glomerular filtration rate estimated by cystatin C among different clinical presentations. Kidney Int 2006;69:399–405. https://doi.org/10.1038/sj.ki.5000073.Suche in Google Scholar PubMed
25. Sjöström, P, Tidman, M, Jones, I. Determination of the production rate and non-renal clearance of cystatin C and estimation of the glomerular filtration rate from the serum concentration of cystatin C in humans. Scand J Clin Lab Invest 2005;65:111–24. https://doi.org/10.1080/00365510510013523.Suche in Google Scholar PubMed
26. Dharnidharka, VR, Kwon, C, Stevens, G. Serum cystatin C is superior to serum creatinine as a marker of kidney function: a meta-analysis. Am J Kidney Dis 2002;40:221–6. https://doi.org/10.1053/ajkd.2002.34487.Suche in Google Scholar PubMed
27. Ascić-Buturović, B, Cavaljuga, S. Cystatin C as a marker for detection of early renal failure in diabetes type 2 patients. Bosn J Basic Med Sci 2005;5:68–71. https://doi.org/10.17305/bjbms.2005.3237.Suche in Google Scholar PubMed PubMed Central
28. Shao, Y, Lv, C, Yuan, Q, Wang, Q. Levels of serum 25(OH)VD3, HIF-1alpha, VEGF, vWf, and IGF-1 and their correlation in type 2 diabetes patients with different urine albumin creatinine ratio. J Diabetes Res 2016;2016:1925424. https://doi.org/10.1155/2016/1925424.Suche in Google Scholar PubMed PubMed Central
29. Molitch, ME, DeFronzo, RA, Franz, MJ, Keane, WF, Mogensen, CE, Parving, HH, et al.. Nephropathy in diabetes. Diabetes Care 2004;27:S79–83. https://doi.org/10.2337/diacare.27.2007.s79.Suche in Google Scholar PubMed
30. Poggio, ED, Wang, X, Greene, T, Van Lente, F, Hall, PM. Performance of the modification of diet in renal disease and cockcroft-gault equations in the estimation of GFR in health and in chronic kidney disease. J Am Soc Nephrol 2005;16:459–66. https://doi.org/10.1681/asn.2004060447.Suche in Google Scholar
31. Kanwar, YS, Sun, L, Xie, P, Liu, FY, Chen, S. A glimpse of various pathogenetic mechanisms of diabetic nephropathy. Annu Rev Pathol 2011;6:395–423. https://doi.org/10.1146/annurev.pathol.4.110807.092150.Suche in Google Scholar PubMed PubMed Central
32. Levey, AS, Coresh, J, Balk, E, Kausz, AT, Levin, A, Steffes, MW, et al.. National kidney foundation practice guidelines for chronic kidney disease: evaluation, classification, and stratification. Ann Intern Med 2003;139:137–47. https://doi.org/10.7326/0003-4819-139-2-200307150-00013.Suche in Google Scholar PubMed
33. Khan, IA, Nasiruddin, M, Haque, SF, Khan, RA. Comparative evaluation of efficacy and safety profile of rhubarb and α-keto analogs of essential amino acids supplementation in patients with diabetic nephropathy. Saudi J Kidney Dis 2016;27:710–6. https://doi.org/10.4103/1319-2442.185227.Suche in Google Scholar PubMed
34. Lu, J, Ma, X, Shen, Y, Wu, Q, Wang, R, Zhang, L, et al.. Time in range is associated with carotid intima-media thickness in type 2 diabetes. Diabetes Technol Therapeut 2020;22:72–8. https://doi.org/10.1089/dia.2019.0251.Suche in Google Scholar PubMed
35. Ranjan, AG, Rosenlund, SV, Hansen, TW, Rossing, P, Andersen, S, Nørgaard, K. Improved time in range over 1 year is associated with reduced albuminuria in individuals with sensor-augmented insulin pump-treated type 1 diabetes. Diabetes Care 2020;43:2882–5. https://doi.org/10.2337/dc20-0909.Suche in Google Scholar PubMed
36. Lu, J, Ma, X, Zhou, J, Zhang, L, Mo, Y, Ying, L, et al.. Association of time in range, as assessed by continuous glucose monitoring, with diabetic retinopathy in type 2 diabetes. Diabetes Care 2018;41:2370–6. https://doi.org/10.2337/dc18-1131.Suche in Google Scholar PubMed
37. Yoo, JH, Choi, MS, Ahn, J, Park, SW, Kim, Y, Hur, KY, et al.. Association between continuous glucose monitoring-derived time in range, other core metrics, and albuminuria in type 2 diabetes. Diabetes Technol Therapeut 2020;22:768–76. https://doi.org/10.1089/dia.2019.0499.Suche in Google Scholar PubMed
38. Mayeda, L, Katz, R, Ahmad, I, Bansal, N, Batacchi, Z, Hirsch, IB, et al.. Glucose time in range and peripheral neuropathy in type 2 diabetes mellitus and chronic kidney disease. BMJ Open Diabetes Res Care 2020;8. https://doi.org/10.1136/bmjdrc-2019-000991.Suche in Google Scholar PubMed PubMed Central
39. Gross, JL, de Azevedo, MJ, Silveiro, SP, Canani, LH, Caramori, ML, Zelmanovitz, T. Diabetic nephropathy: diagnosis, prevention, and treatment. Diabetes Care 2005;28:164–76. https://doi.org/10.2337/diacare.28.1.164.Suche in Google Scholar PubMed
40. Laterza, OF, Price, CP, Scott, MG. Cystatin C: an improved estimator of glomerular filtration rate? Clin Chem 2002;48:699–707. https://doi.org/10.1093/clinchem/48.5.699.Suche in Google Scholar
41. Dejenie, TA, Abebe, EC, Mengstie, MA, Seid, MA, Gebeyehu, NA, Adella, GA, et al.. Dyslipidemia and serum cystatin C levels as biomarker of diabetic nephropathy in patients with type 2 diabetes mellitus. Front Endocrinol 2023;14:1124367. https://doi.org/10.3389/fendo.2023.1124367.Suche in Google Scholar PubMed PubMed Central
42. Jeon, YL, Kim, MH, Lee, WI, Kang, SY. Cystatin C as an early marker of diabetic nephropathy in patients with type 2 diabetes. Clin Lab 2013;59:1221–9. https://doi.org/10.7754/clin.lab.2013.120804.Suche in Google Scholar PubMed
43. Jeon, YK, Kim, MR, Huh, JE, Mok, JY, Song, SH, Kim, SS, et al.. Cystatin C as an early biomarker of nephropathy in patients with type 2 diabetes. J Kor Med Sci 2011;26:258–63. https://doi.org/10.3346/jkms.2011.26.2.258.Suche in Google Scholar PubMed PubMed Central
44. Kim, SS, Song, SH, Kim, IJ, Jeon, YK, Kim, BH, Kwak, IS, et al.. Urinary cystatin C and tubular proteinuria predict progression of diabetic nephropathy. Diabetes Care 2013;36:656–61. https://doi.org/10.2337/dc12-0849.Suche in Google Scholar PubMed PubMed Central
© 2025 the author(s), published by De Gruyter, Berlin/Boston
This work is licensed under the Creative Commons Attribution 4.0 International License.