Increased hemolysis rate in plasma tubes after implementation of a fully automated sample delivery and acceptance system
-
Jonathan A. Saenger


Abstract
Objectives
Automated sample delivery and laboratory acceptance systems (PTAS) may influence the hemolysis rate of blood samples due to g-forces, abrupt acceleration, and rapid deceleration. However, quantitative data regarding the rate of hemolysis in PTAS is limited. To fill this void, the effect of a pneumatic tube in combination with an acceptance system (PTAS) on the hemolysis rate was investigated in this study.
Methods
Lithium heparin plasma tubes were transported from different clinical departments to the hospital’s laboratory (a) by employees or (b) with an automated PTAS and analyzed for the presence of hemolysis based on a hemolysis index (HI) of >25. Hemolysis indices of 68.513 samples were retrieved from the laboratory information system before and after installation of the PTAS and were subjected to statistical analysis.
Results
A total of 32.614 samples were transported by employees, of which 3.815 samples (11.70%) were hemolytic, and 9.441 out of 35.899 samples delivered by PTAS (26.30%) were hemolytic. After the implementation of the PTAS, hemolysis rates increased in all departments.
Conclusions
Automated PTAS are associated with increased hemolysis rates. This has implications for routine patient management and should be considered for the transportation of samples used for the determination of hemolysis-sensitive laboratory parameters.
Introduction
Hemolysis arises from the pathological cell death of erythrocytes [1]. This process releases hemoglobin and intracellular substances or components to the surrounding plasma that subsequently can cause interference in laboratory testing [2]. Common mechanisms include divergence due to concentration differences, interactions between intracellular substances and extracellular substances or test reagents used for analysis, spectrophotometric interferences due to changes in optical absorption, or cell debris [2]. About 70% of hemolytic samples are due to errors in the preanalytical phase and are related to blood collection or specimen transport into the laboratory [1, 3, 4]. Technical advances in the analytical phase have reduced analytical laboratory errors [1, 3, 4]. Errors arising in the preanalytical phase can affect all subsequent steps of the laboratory process and thus, as a consequence, lead to inaccurate results and protracted patient management [1]. A possible source of hemolytic specimens are pneumatic tube transport systems (PTS), frequently used in modern hospitals. Based on pressure differences generated by pumps, single samples or capsules are delivered through a transport pipe from the areas of patient care to laboratory areas [5]. While PTS have the potential to reduce turnaround times, workload, and costs, their implementation may influence the quality of blood sample analysis [6]. Fully automated sample transport and acceptance systems (PTAS) represent technical progress by combining pneumatic tube transport systems for sample delivery with acceptance systems to allow further processing without conventional interventions. In our institution, an automated PTAS, capable of not only transporting but automatically transferring samples from transport capsules to the centrifuge and inserting them into instrument-specific test tube racks, was recently established. Following implementation, a steep increase in hemolytic plasma samples has been reported from the clinical departments. Thus, our study aims to systematically investigate the influence of PTAS on hemolysis rates in lithium heparin plasma tubes.
Materials and methods
Review Board approval
This retrospective study was approved by our Institutional Review Board at Sigmund Freud Private University and was waived for informed patient consent. Anonymized laboratory results of regular laboratory requests in the Clinic Favoriten were collected before (1.1. – 31.12.2015) and after (1.1. – 31.12.2017) implementation of a PTAS.
We included results from all lithium heparin plasma tubes of the departments of the mother–child surgery center of the Clinic Favoriten of patients over the age of 18 years in this study.
Sample handling
The departments in our study were located on different floors within the same building. Per institutional standards, all blood samples were taken by physicians or nurses and collected into 5 mL lithium heparin separator tubes (13 × 100) (Greiner Bio-One, Kremsmünster, Austria). The standard operating procedures and handling instructions for blood samples were not modified between 2015 and 2017. Before installation of the PTAS, all samples were conventionally delivered by hospital staff via transport cart and were physically handed over to laboratory personnel. Since 2017, samples have been transported in the mother-child surgery center using the PTAS (Sumetzberger, Wien, Austria) in automated load/and unload transport capsules (Sumetzberger, Wien, Austria) as shown in Figure 1. Our automated load and unload capsules use non-padded transport compartments for sample storage during PTAS transport. After insertion of the capsule into the transport station, the capsules are automatically delivered to the laboratory, guided by an integrated RFID chip. The exact length distances of the different PTAS transportation routes were not available for this study and could not be assessed systematically. The transport speed of the capsules within the entire PTAS relied on the manufacturer’s instructions and ranged between 1 and 3 m/s. After arrival in the laboratory, capsules are slowed down due to cushioning O-rings and compressed air and are then opened by air pressure. The capsules are emptied, and the sample tubes fall 30 cm onto a metal chute, from which they are taken over by an automatic pre-analysis system (RSA Pro Roche, Basel, Switzerland) encompassing automated centrifugation (Cobas p 471, Roche, Basel, Switzerland and Rotanta 460 Robotic, Hettich, Tuttlingen, Germany) and at 3500RPM for 10 min at a temperature of 20 °C and with an RCF (=g) of 2,643. Afterwards, samples are sorted into instrument-specific racks.
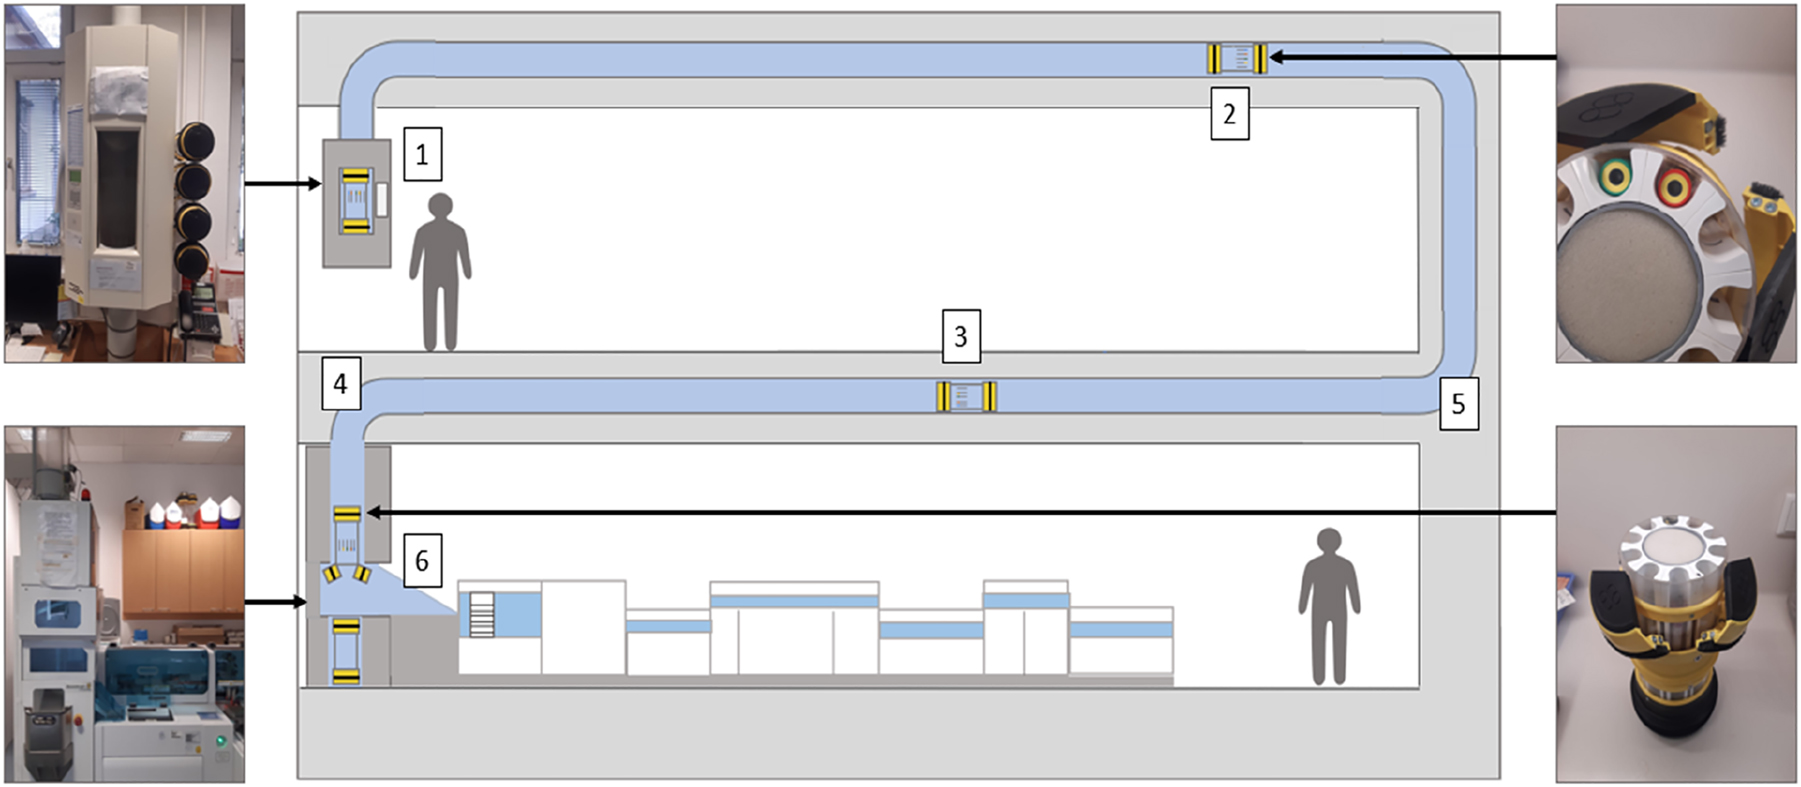
Schematic representation of our PTAS with the different possible causes of hemolysis: Lithium-heparin plasma tubes (1) and pneumatic tube systems, transport capsules (2), speed of specimen transport (3), length of transport path (4), G-forces during specimen transport (5) and shock forces during specimen transport (6). Samples are placed into transport capsules. The capsules are inserted into the transport station and automatically delivered to the laboratory, guided by an integrated RFID chip. After arrival in the laboratory, capsules are opened by air pressure, and the sample tubes are ejected into a metal chute, from which they are retrieved by an automated pre-analysis system (RSA Pro, Roche, Basel, Switzerland), encompassing automated centrifugation and sample sorting into instrument-specific racks.
Sample analysis
The racks collected by technicians were applied on a modular analyzer (Cobas 8000 System, Roche, Basel, Switzerland), and plasma samples were subjected to HI measurement (Cobas c501 module, Roche, Basel, Switzerland) in accordance with the manufacturer’s instructions. HI was measured using 600 nm (nm) and 570 nm wavelengths, including correction for lipemia-related absorption. All plasma samples with an HI greater than 25 (equals 0.25 g/L) were considered hemolytic to be able to exclude a possible influence of PTAS on laboratory values as recommended by Lippi et al. [7, 8]. To allow for better comparability, all plasma samples with an HI of 50 were reported as well.
Data collection
Data acquisition and data management were performed at the Institute of Laboratory Diagnostics at the Clinic Favoriten in accordance with data regulations of the International Organization for Standardization (ISO) standard 9001. The data set was read out using proprietary laboratory software (Glims, CliniSys Mips, Gent, Belgium) and exported in editable spreadsheets using standard office software (Office 365, Microsoft Corporation, Redmond, WA, USA).
Statistical analysis
Categorical data were reported as counts and percentages for HI of 25 and HI of 50 percentages and corresponding 95% confidence intervals (95% CI) were calculated using the standard error formula (Table 1). We stratified for transport modality (conventional transport vs. PTAS yes/no) and departments. The influence of transport by the PTAS (yes; coded as 1) on sample hemolysis (HI > 25; coded as 1) was analyzed using a binary logistic regression model (reference: conventional transport; coded as 0). We adjusted for departments (reference: department of anesthesia, lowest hemolysis incidence). Results are presented as odds ratios (OR) and corresponding 95% confidence intervals (95% CI). All analyses were performed using commercially available software (IBM SPSS Statistics 28 International Business Machines Corporation, Armonk, NY, USA).
Counts and percentages of samples with HI ≤ 25 and >25 and with HI ≤ 50 and >50 in the participating departments and in total stratified by transportation modality.
| Department | Conventional transport | PTAS transport | ||||||||||||||
|---|---|---|---|---|---|---|---|---|---|---|---|---|---|---|---|---|
| HI | ≤25 | >25 | ≤50 | >50 | ≤25 | >25 | ≤50 | >50 | ||||||||
| n | %a
95% CI |
n | %a
95% CI |
n | %a
95% CI |
n | %a
95% CI |
n | %a
95% CI |
n | %a
95% CI |
n | %a
95% CI |
n | %a
95% CI |
|
| Anaesthesiology | 3.547 | 95.7 95.0–96.4 |
158 | 4.3 1.1–7.5 |
3.642 | 98.3 97.9–98.7 |
63 | 1.7 −1.4–4.9 |
3.687 | 90.1 89.1–91.0 |
404 | 9.9 7.0–12.8 |
3.969 | 97.0 96.4–97.5 |
122 | 3.0 0.0–6.0 |
| Dermatology | 431 | 91.7 89.1–94.3 |
13 | 2.9 −6.2–12.0 |
439 | 98.8 97.9–99.9 |
5 | 1.1 −8.1–10.3 |
456 | 77.7 73.8–81.5 |
131 | 22.3 15.2–29.4 |
569 | 97.0 95.5–98.4 |
18 | 3.0 −4.8–11.0 |
| Gynaecology | 7.969 | 92 91.4–92.6 |
695 | 8.0 6.0–10.0 |
8.266 | 95.4 95.0–95.6 |
398 | 4.6 2.5–6.6 |
8.605 | 81.3 80.5–82.2 |
1.980 | 18.7 17.0–20.4 |
9.775 | 92.3 91.8–92.8 |
810 | 7.7 5.8–9.4 |
| Otolaryngology | 1.452 | 82.5 80.5–84.5 |
307 | 17.5 13.2–21.8 |
1.557 | 88.5 86.9–90.1 |
202 | 11.5 7.0–15.9 |
1.436 | 76.8 74.6–79.0 |
435 | 23.2 19.2–27.2 |
1.614 | 86.2 84.6–87.9 |
257 | 13.7 9.5–17.9 |
| Surgery | 12.100 | 84.7 84.1–85.3 |
2.189 | 15.3 13.8–16.8 |
12.844 | 89.9 89.4–90.4 |
1.445 | 10.1 8.6–11.6 |
9.704 | 62.1 61.1–63.1 |
5.927 | 37.9 36.7–39.1 |
13.061 | 83.6 82.9–84.2 |
2.570 | 16.4 15.0–17.8 |
| Urology | 3,300 | 87.9 86.8–89.0 |
453 | 12.1 9.0–15.1 |
3.463 | 92.3 91.4–93.2 |
290 | 7.8 4.6–10.8 |
2.570 | 82.0 80.5–83.5 |
564 | 18.0 14.8–21.2 |
2.867 | 91.5 90.5–92.5 |
267 | 8.5 5.2–11.9 |
| Total | 28.799 | 88.3 87.9–88.7 |
3.815 | 11.7 10.7–12.7 |
30.211 | 92.6 92.3–92.9 |
2.403 | 7.4 6.3–8.4 |
26.458 | 73.7 73.2–74.2 |
9.441 | 26.3 25.4–27.2 |
31.855 | 88.7 88.4–89.0 |
4.044 | 11.3 10.2–12.2 |
- a
Some percentages may not add up to 100 because of rounding; PTAS, pneumatic tube and acceptance system. HI, hemolysis index.
Results
In 2015, a total of 32.614 samples were sent to the laboratory by conventional transport. Among these, 3.815 (11.7%) were hemolytic based on an HI of 25 and 2.403 (7.4%) based on an HI of 50. In 2017, after installment of the PTAS, 35.899 samples were sent to the laboratory, of which 9.441 samples (26.3%) were hemolytic based on an HI of 25 and 4.044 samples (11.3%) based on an HI of 50.
The observed increase varied in the different departments, as shown in Table 1. The department with the highest absolute increase in hemolysis rate and the highest observed hemolysis rate was the department of surgery, with a hemolysis rate of 15.3% in 2015 and 37.9% in 2017.
Logistic regression was used to analyze the relationship between transportation modality (conventional transport = 0, PTAS = 1) and the odds of obtaining a hemolyzed blood sample. It was found that the odds of obtaining a hemolyzed blood sample increased by 64.1% (95% CI [0.61, 0.68]) for blood samples sent by the PTAS compared to conventional transport (Table 2). After adjustment for the submitting department, the odds of obtaining a hemolyzed blood sample increased to 67.7% (95% CI [0.64, 0.71]) for blood samples sent by the PTAS compared to conventional transport. The odds of obtaining a hemolyzed blood sample varied within the different departments. When compared to the reference department, the odds of significant hemolysis ranged from an increase of 103.3% for the department of dermatology to up to 403.9% for the department of surgery (Table 3).
Odds ratios of hemolytic samples stratified by transportation modality.
| All samples | Hemolytic samples (HI > 25) | p-Value | Odds ratio | 95% CI | |
|---|---|---|---|---|---|
| Conventional transporta | 32.614 | 3.815 | – | – | – |
| PTAS transport | 35.899 | 9.441 | <0.001 | 1.677 | 1.642–1.713 |
- a
Transportation by conventional transport was used as a reference group. CI, confidence interval.
Odds ratios of hemolytic samples stratified by the originating department.
| All samples | Hemolytic samples (HI > 25) | p-Value | Odds ratio | 95% CI | |
|---|---|---|---|---|---|
| Anaesthesiologya | 7.796 | 562 | – | – | – |
| Dermatology | 1.031 | 144 | <0.001 | 2.033 | 1.667–2.478 |
| Gynaecology | 19.249 | 2.675 | <0.001 | 2.059 | 1.870–2.266 |
| Otolaryngology | 3.630 | 742 | <0.001 | 3.445 | 3.057–3.882 |
| Surgery | 29.920 | 8.116 | <0.001 | 5.039 | 4.604–5.516 |
| Urology | 6.887 | 1.017 | <0.001 | 2.437 | 2.183–5.516 |
- a
Department of Anaesthesiology was used as a reference group for binary logistic regression since it had the lowest percentage of hemolytic samples.
Discussion
The present study found an association between a new PTAS and an increased rate of hemolytic specimens, particularly an increase in samples with HI values between 25 and 50.
The findings in this study are consistent with and extend those of previous reports [3, 5, 6, 9, 10] and contradict some studies showing no significant influence of PTS on hemolysis rates [11], [12], [13]. The heterogeneity of the effects may be explained by the fact that different PTS have a broad range of configurations and influencing factors, such as type of transport capsules, transport speed, the presence of distribution centers, transport distance, and maximum g-forces applied to the samples. Furthermore, the studies used different cutoffs for the definition of hemolysis. Moreover, some groups investigated other laboratory parameters to test for the presence of hemolysis [3, 5, 6, 9], [10], [11], [12], [13], ranging from visual inspection of the samples to the use of a modular analyzer system [12, 13].
A PTAS with automated load and unload pods has been used in the present study, which necessitates a sliding drop into the pods from a height of roughly 30 cm. Arguably, the abrupt opening and ejection of the samples from the capsules could also increase the risk of hemolysis. Streichert et al. demonstrated that a fall from a height of one meter increases the likelihood of sample hemolysis [14]. However, to the best of our knowledge, there is no evidence that supports attributing the observed increase in hemolysis rates to the sample acceptance part of the PTAS. Other factors that influence PTS/PTAS sample transport are briefly summarized as follows.
Lithium-heparin plasma tubes are more susceptible to hemolysis than is the case for serum tubes [15], [16], [17]. This is possibly due to the increased mobility of erythrocytes in anticoagulated lithium heparin tubes compared to coagulated serum samples [16]. If anticoagulated plasma tubes are incompletely filled and transported, hemolysis might occur due to air bubbles passing through the sample, causing additional hydrodynamic pressure on the erythrocytes [18, 19]. Hemolysis could thus be reduced using smaller or completely filled sample tubes [19, 20].
Reducing the sample movement space during transportation and padding the capsules or samples can decrease the occurrence of hemolysis [9, 21, 22]. Especially cushioning individual blood samples with bubble wrap proved effective but is not possible due to the automatic emptying process of the transport capsules [23]. In contrast, some systems try to avoid the application of transport capsules [24].
Especially at higher speeds, samples are exposed to substantial g-forces in curvy transport sections of PTS. This causes mechanical stress on erythrocytes and induces hemolysis [25, 26]. A significant difference in hemolysis rates can be observed among samples sent by PTS between 2 m/s and 3 m/s [26]. It is possible that the speed within the PTAS might have contributed to increased hemolysis rates.
Due to the high transport speed and the resulting short transport time, we assume that the temperature, which could alter the sample quality by creating hemolysis, didn’t vary during transport [14, 27]. PTS transport distance length demonstrably influences sample quality [28, 29]. Gils et al. reported a correlation between hemolysis and the length of transport in their PTS with individual sample transport [28]. Wei et al. showed that the longer PTS pathway in their study increased the percentage of hemolytic samples by 56,7% [29]. Therefore, the differences in hemolysis rates across the various departments of Clinic Favoriten may be partly explained by the different transport routes and lengths between sending and receiving locations.
The 3-axis acceleration during sample delivery significantly varies at different transport speeds as compared to delivery hospital staff [14]. During PTS transport, g-forces as high as 15 g for 2.5 m/s, 14 g for 2.0 m/s, and 13 g for 1.5 m/s have been measured in contrast to 9 g for hand-carried transport [14]. Clinically relevant differences have already been observed at a PTS transport speed of 1.5 m/s for the laboratory parameters aspartate aminotransferase and lactate dehydrogenase (LDH) [14].
After arrival, samples are usually centrifuged at a speed of 2,500–3,500 rpm for 10 min with high g-forces of up to 3,000 g without increasing the hemolysis rate. Therefore, g-forces per se most likely do not increase hemolysis rates [14, 24]. Rather the rapid acceleration and abrupt deceleration than the g-forces during sample transport may influence hemolysis rates in PTAS [5, 18].
A significant influence of abrupt acceleration, rapid deceleration, and the number of sudden changes in tube routing on hemolysis has already been demonstrated [9, 18, 22, 30]. The extent of these shock-like forces can cause a higher hemolysis rate within a particular PTS route and may explain our observed differences in hemolysis rates between departments. To reduce acceleration and deceleration effects, compressed air [22] and cushioning O-rings, as used in our system, are utilized to minimize hemolysis rates [9].
HI, lactate dehydrogenase (LDH), and potassium represent established references to monitor PTS-induced hemolysis in daily practice. Based on these indicators, any systemic hemolysis can be quickly noticed [28]. The specifications of the PTS influence the extent of sample hemolysis. It thus has been recommended recently that each laboratory should evaluate the PTS with particular emphasis on g-forces [5, 31, 32]. Smartphones equipped with appropriate apps are a simple and easily accessible option to measure acceleration and g-forces during sample delivery [14, 18, 33]. Moreover, commercial data loggers are suitable for recording the number and magnitude of g-forces within the PTS [14].
Our study has several limitations. First, we analyzed retrospective data of mostly surgical departments and were hence not able to compare two randomly assigned arms as a 1:1 comparison. Second, due to the nature of data retrieval, it was impossible to exclude the influence of the sample collection procedure. Third, due to nature of the available data, a differentiation between hemolysis prior to transport, hemolysis generated by the PTAS, and hemolysis due to the acceptance system was not possible. Fourth detailed information about system configuration and transport routes was not available to the authors. However, since hemolysis rates increased in all departments under investigation, a major impact of blood drawing practice seems unlikely. Nonetheless, additional training regarding sampling techniques has been implemented in response to our findings. The evaluation of the PTAS with a data logger is planned to find further possible sources of hemolysis and continue to improve our system.
Conclusions
Implementation of a PTS in combination with an automated load- and unloading infrastructure is associated with hemolysis affecting clinically relevant hemolysis-sensitive laboratory parameters. Our data confirms the importance of evaluating novel PTAS prior to routine implementation to consider conventional delivery for hemolysis-critical blood panel parameters.
Acknowledgments
We would like to thank the technicians and the entire medical staff for analyzing and validating the samples included in the present study.
-
Research funding: No specific grant has been obtained from any funding agency in the public, commercial, or not-for-profit sectors.
-
Author contributions: All authors have accepted responsibility for the entire content of this manuscript and approved its submission. The authors confirm their contribution to the paper as follows: study conception and design: J. Saenger, M. Födinger, J. Atamaniuk; data collection: J. Saenger, J. Asenbaum; analysis and interpretation of results: J. Saenger, M. Gaggl; draft manuscript preparation: J. Saenger, M. Födinger, F. Huber, A. Grieb; images: A. Grieb.
-
Competing interests: The authors state no conflict of interest.
-
Informed consent: The need for informed consent was waived by the author’s Institutional Review Board.
-
Ethical approval: Research involving human subjects complied with all relevant national regulations, institutional policies and is in accordance with the tenets of the Helsinki Declaration (as revised in 2013) and has been approved by the author’s Institutional Review Board at Sigmund Freud Private University (Nr.048-2019).
-
Data availability: The datasets generated during and/or analyzed during the current study are available from the corresponding author upon reasonable request.
References
1. Lippi, G, Favaloro, EJ, Cervellin, G, Plebani, M, Favaloro, EJ, Plebani, M. In:Sonntag, O, Plebani, M, editors. Vitro and in vivo hemolysis - an unresolved dispute in laboratory medicine, vol. 4, 1st ed. Berlin: DE GRUYTER; 2012:1–101 pp.10.1515/9783110246148Search in Google Scholar
2. Guder, WG. Haemolysis as an influence and interference factor in clinical chemistry. J Clin Chem Clin Biochem 1986;24:125–6.Search in Google Scholar
3. Lippi, G, Plebani, M, Di Somma, S, Cervellin, G. Hemolyzed specimens: a major challenge for emergency departments and clinical laboratories. Crit Rev Clin Lab Sci 2011;48:143–53. https://doi.org/10.3109/10408363.2011.600228.Search in Google Scholar PubMed
4. Lippi, G, Blanckaert, N, Bonini, P, Green, S, Kitchen, S, Palicka, V, et al.. Haemolysis: an overview of the leading cause of unsuitable specimens in clinical laboratories. Clin Chem Lab Med 2008;46:764–72. https://doi.org/10.1515/CCLM.2008.170.Search in Google Scholar PubMed
5. Kapoula, GV, Kontou, PI, Bagos, PG. The impact of pneumatic tube system on routine laboratory parameters: a systematic review and meta-analysis. Clin Chem Lab Med 2017;55:1834–44. https://doi.org/10.1515/cclm-2017-0008.Search in Google Scholar PubMed
6. Kara, H, Bayir, A, Ak, A, Degirmenci, S, Akinci, M, Agacayak, A, et al.. Hemolysis associated with pneumatic tube system transport for blood samples. Pakistan J Med Sci 2014;30:50–3. https://doi.org/10.12669/pjms.301.4228.Search in Google Scholar PubMed PubMed Central
7. Simundic, AM, Baird, G, Cadamuro, J, Costelloe, SJ, Lippi, G. Managing hemolyzed samples in clinical laboratories. Crit Rev Clin Lab Sci 2020;57:1–21. https://doi.org/10.1080/10408363.2019.1664391.Search in Google Scholar PubMed
8. Lippi, G, Giavarina, D, Gelati, M, Salvagno, GL. Reference range of hemolysis index in serum and lithium-heparin plasma measured with two analytical platforms in a population of unselected outpatients. Clin Chim Acta 2014;429:143–6. https://doi.org/10.1016/j.cca.2013.12.010.Search in Google Scholar PubMed
9. Ellis, G. An episode of increased hemolysis due to a defective pneumatic air tube delivery system. Clin Biochem 2009;42:1265–9. https://doi.org/10.1016/j.clinbiochem.2009.05.002.Search in Google Scholar PubMed
10. Koessler, J, Kobsar, AL, Brunner, K, Stolz, H, Dossler, B, Walter, U, et al.. The preanalytical influence of two different mechanical transport systems on laboratory analysis [Letter to the editor]. Clin Chem Lab Med 2011;49:1379–82. https://doi.org/10.1515/cclm.2011.198.Search in Google Scholar PubMed
11. Pupek, A, Matthewson, B, Whitman, E, Fullarton, R, Chen, Y. Comparison of pneumatic tube system with manual transport for routine chemistry, hematology, coagulation and blood gas tests. Clin Chem Lab Med 2017;55:1537–44. https://doi.org/10.1515/cclm-2016-1157.Search in Google Scholar PubMed
12. Fernandes, CMB, Worster, A, Eva, K, Hill, S, McCallum, C. Pneumatic tube delivery system for blood samples reduces turnaround times without affecting sample quality. J Emerg Nurs 2006;32:139–43. https://doi.org/10.1016/j.jen.2005.11.013.Search in Google Scholar PubMed
13. Phelan, MP, Reineks, E, Chamberlin, J, Berriochoa, J, Procop, G, Hustey, F, et al.. Does pneumatic tube system transport contribute to hemolysis in ED blood samples? West J Emerg Med 2016;17:557–60. https://doi.org/10.5811/westjem.2016.6.29948.Search in Google Scholar PubMed PubMed Central
14. Streichert, T, Otto, B, Schnabel, C, Nordholt, G, Haddad, M, Maric, M, et al.. Determination of hemolysis thresholds by the use of data loggers in pneumatic tube systems. Clin Chem 2011;57:1390–7. https://doi.org/10.1373/clinchem.2011.167932.Search in Google Scholar PubMed
15. Sodi, R, Darn, SM, Stott, A. Pneumatic tube system induced haemolysis: assessing sample type susceptibility to haemolysis. Ann Clin Biochem 2004;41:237–40. https://doi.org/10.1258/000456304323019631.Search in Google Scholar PubMed
16. Böckel-Frohnhöfer, N, Hübner, U, Hummel, B, Geisel, J. Pneumatic tube-transported blood samples in lithium heparinate gel separator tubes may be more susceptible to haemolysis than blood samples in serum tubes. Scand J Clin Lab Invest 2014;74:599–602.10.3109/00365513.2014.921931Search in Google Scholar PubMed
17. Pasqualetti, S, Szoke, D, Panteghini, M. Heparinate but not serum tubes are susceptible to hemolysis by pneumatic tube transportation. Clin Chem Lab Med 2016;54:785–9. https://doi.org/10.1515/cclm-2015-0751.Search in Google Scholar PubMed
18. Mullins, GR, Harrison, JH, Bruns, DE. Smartphone monitoring of pneumatic tube system-induced sample hemolysis. Clin Chim Acta 2016;462:1–5. https://doi.org/10.1016/j.cca.2016.08.011.Search in Google Scholar PubMed
19. Mullins, GR, Bruns, DE. Air bubbles and hemolysis of blood samples during transport by pneumatic tube systems. Clin Chim Acta 2017;473:9–13. https://doi.org/10.1016/j.cca.2017.08.008.Search in Google Scholar PubMed
20. Phelan, MP, Reineks, EZ, Berriochoa, JP, Schold, JD, Hustey, FM, Chamberlin, J, et al.. Impact of use of smaller volume, smaller vacuum blood collection tubes on hemolysis in emergency department blood samples. Am J Clin Pathol 2017;148:330–5. https://doi.org/10.1093/ajcp/aqx082.Search in Google Scholar PubMed
21. Strubi-Vuillaume, I, Carlier, V, Obeuf, C, Vasseur, F, Maury, JC, Maboudou, P, et al.. Gentle blood aspiration and tube cushioning reduce pneumatic tube system interference in lactate dehydrogenase assays. Ann Clin Biochem 2016;53:295–7. https://doi.org/10.1177/0004563215586600.Search in Google Scholar PubMed
22. Heath, B, Toppers, J, Walsh, K. Reducing pneumatic tube induced hemolysis in blood specimens. MedicalLab Manag Mag 2016;5:16–22.Search in Google Scholar
23. Cadamuro, J, Von Meyer, A, Johannis, W, Haschke-Becher, E, Keppel, MH, Streichert, T. Effect of five different pneumatic tube carrier inserts on mechanical sample stress: a multicentre evaluation. Clin Chem Lab Med 2021;59:E313–6. https://doi.org/10.1515/cclm-2020-1818.Search in Google Scholar PubMed
24. Suchsland, J, Winter, T, Greiser, A, Streichert, T, Otto, B, Mayerle, J, et al.. Extending laboratory automation to the wards: effect of an innovative pneumatic tube system on diagnostic samples and transport time. Clin Chem Lab Med 2017;55:225–30. https://doi.org/10.1515/cclm-2016-0380.Search in Google Scholar PubMed
25. Pragay, DA, Fan, P, Brinkley, S, Chilcote, ME. A computer directed pneumatic tube system: its effects on specimens. Clin Biochem 1980;13:259–61. https://doi.org/10.1016/s0009-9120(80)80005-1.Search in Google Scholar PubMed
26. Tiwari, AK, Pandey, P, Dixit, S, Raina, V. Speed of sample transportation by a pneumatic tube system can influence the degree of hemolysis. Clin Chem Lab Med 2012;50:471–4. https://doi.org/10.1515/CCLM.2011.779.Search in Google Scholar PubMed
27. Lippi, G, Guidi, GC, Mattiuzzi, C, Plebani, M. Preanalytical variability: the dark side of the moon in laboratory testing. Clin Chem Lab Med 2006;44:358–65. https://doi.org/10.1515/CCLM.2006.073.Search in Google Scholar PubMed
28. Gils, C, Broell, F, Vinholt, PJ, Nielsen, C, Nybo, M. Use of clinical data and acceleration profiles to validate pneumatic transportation systems. Clin Chem Lab Med 2020;58:560–8. https://doi.org/10.1515/cclm-2019-0881.Search in Google Scholar PubMed
29. Wei, J, Wu, YN, Ling, Y, ting, CX, Zhu, Q, Xu, J. False decrease of high-sensitivity cardiac troponin T assay in pneumatic tube system samples. Clin Chim Acta 2019;495:507–11. https://doi.org/10.1016/j.cca.2019.05.027.Search in Google Scholar PubMed
30. Gomez-Rioja, R, Fernandez-Calle, P, Alcaide, MJ, Madero, R, Oliver, P, Iturzaeta, JM, et al.. Interindividual variability of hemolysis in plasma samples during pneumatic tube system transport [Letter to the editor]. Clin Chem Lab Med 2013;51:231–3. https://doi.org/10.1515/cclm-2013-0171.Search in Google Scholar PubMed
31. Cakirca, G, Erdal, H. The effect of pneumatic tube systems on the hemolysis of biochemistry blood samples. J Emerg Nurs 2017;43:255–8. https://doi.org/10.1016/j.jen.2016.09.007.Search in Google Scholar PubMed
32. Franks, CE, Krekeler, JA, Gronowski, AM, Farnsworth, CW. A comparison of four 3-axis-accelerometers for monitoring hospital pneumatic tube systems. J Appl Lab Med 2020;5:1345–50. https://doi.org/10.1093/jalm/jfaa081.Search in Google Scholar PubMed
33. Mullins, GR, Harrison, JH, Bruns, DE. Smartphones can monitor medical center pneumatic tube systems [Letter to the editor]. Clin Chem 2016;62:891–3. https://doi.org/10.1373/clinchem.2016.257063.Search in Google Scholar PubMed
© 2023 the author(s), published by De Gruyter, Berlin/Boston
This work is licensed under the Creative Commons Attribution 4.0 International License.
Articles in the same Issue
- Frontmatter
- Original Articles
- Age-and sex-specific reference intervals of total cholesterol, LDL cholesterol, HDL cholesterol and non-HDL cholesterol. Comparison of two algorithms for the indirect estimation of reference intervals
- Increased hemolysis rate in plasma tubes after implementation of a fully automated sample delivery and acceptance system
- Keep cool! Observed temperature variations at different process stages of the biobanking workflow – examples from the Leipzig medical biobank
- Laboratory Case Report
- A case report of pseudoleukopenia: playing hide-and-seek
- Congress Report
- Congress report: 5th Munich POCT Symposium, September 27–29, 2022, Klinikum rechts der Isar der TU München