Preliminary investigation of serum ferritin level and its reference interval in apparent healthy children population in Provincial Children’s Hospital
-
Xiucai Zhang


Abstract
Objectives
Serum ferritin (SF) is a biomarker of physiological iron stores. Reference intervals for ferritin about children are the subject of some controversy.
Methods
SF was assayed on Beckman analyzer. All results were retrieved from the electronic medical record (3,344 samples). Student’s t test and one-way ANOVA test were applied to compare two groups, with respect to continuous and discrete variables.
Results
The reference range of SF on reference population was 8.40–95.98 µg/L. Among the male, there was no significant difference in the average level between the 0–1 years old group and the 1–3 years old group, but there were significant differences between the other groups and the previous group. In terms of women, there was no significant difference in the average level of ferritin between the 1–3 years old group and 9–17 years old group and the previous group, but there were significant differences in the average levels of ferritin in other groups.
Conclusions
We established the reference intervals of ferritin of different age groups and gender groups. Our results have practical significance for the formulation of clinical reference range, which would be helpful in interpreting laboratory data and clinical decision-making.
Introduction
Ferritin is a biomarker of physiological iron stores, the determination of serum ferritin can reflect the total iron storage in the body and can be used as a reliable index for the diagnosis of iron deficiency or overload [1]. Under normal circumstances, there is a small amount of ferritin in peripheral blood, which is called serum ferritin (SF). As an acute phase reactant, SF has been found to be elevated in patient by various non overload conditions including inflammation, infectious diseases, liver disease, malignancies, and hepatocellular carcinoma [2]. Therefore, ferritin can be used not only function as a marker of iron reserves, but may also to aid in clinical decision-making, including prognosis, diagnosis, treatment, and/or patient management [3]. As a result, the number of ferritin detection increased rapidly year by year.
Analyte reference interval (RIS) is one of the most widely used clinical decision making tools as the basis for interpreting medical laboratory data [4]. However, although in clinical practice measurement of SF has largely replaced laboratory assays of serum iron and transferrin or total iron‐binding capacity, there is no gold standard method for measuring SF. In contrast to the specificity of low ferritin concentrations for iron deficiency, less ferritin elevation is caused by iron overload rather than by non-overload. Therefore, any increase in ferritin above the reference interval (RI) could lead to follow-up such as additional laboratory testing and imaging, to identify the source [5]. This makes it difficult for doctors to interpret the results. Furthermore, studies have shown that there are significant ethnic differences in SF levels [5, 6]. Therefore, it is necessary to establish your own RIs based on its population and analytical methods for use in clinical laboratories.
This study retrospectively analyzed the ferritin results of the physical examination population in Zhejiang Grade Children’s Hospital in 2020, and established a reference range of ferritin applicable to the population in this region, so as to provide more accurate and reliable diagnostic data for the clinic.
Materials and methods
Data source
Retrospective study
All apparent healthy children population ferritin results performed in Children’s Hospital Affiliated to Zhejiang University Medical College System laboratories from 1 January 2020–31 December 2020 were retrieved from the electronic medical record (3,344 samples). The age range of the subjects ranged from 0.24 to 17 years, with 2001 male samples and 1,343 female samples. Individuals with conditions known to affect ferritin concentrations were removed based on International Classification of Disease. Exclusion criteria included: myocardial infarction, iron deficiency, or hemorrhage within 30 days; anemia, diabetes, metabolic syndrome, chronic infection, cancer, or disease of the liver, kidney, or thyroid.
SF measurement and quality control
Sample collection
Fasting venous blood was taken in the morning, and serum was separated within 2 h after blood collection (centrifugation at 3,500 rpm/min for 10 min), according to the reagent instructions require the exclusion of hemolytic, lipoblood, and jaundice samples that may interfere with ferritin results.
Instruments and reagents
Using Beckman Coulter DXL 800 automatic chemiluminescence immunoanalyzer and original ferritin quantitative determination kit (chemiluminescence method). Perform start-up maintenance and pre-test preparation according to SOP for equipment and project.
Statistical method
Big data set seems to follow the law of large numbers and the central limit theorem. So the whole sampled big data is normal distribution. The reference range of SF was expressed with the 2.5th and 97.5th percentiles, as described previously [7]. Student’s t-test and one-way ANOVA test were applied to compare two or multiple groups, with respect to continuous and discrete variables. Statistical analysis was performed using SPSS software. A p-value of <0.05 was considered statistically significant.
Results
SF value in general
Figure 1 shows the relationship between age and SF levels. Figure 1A represents male and Figure 1B represents female (Figure 1). There was no significant difference in SF between men and women (p=0.244).We found that most of the subjects were distributed within the range of 20.1–40.0, followed by 40.1–60.0 groups.
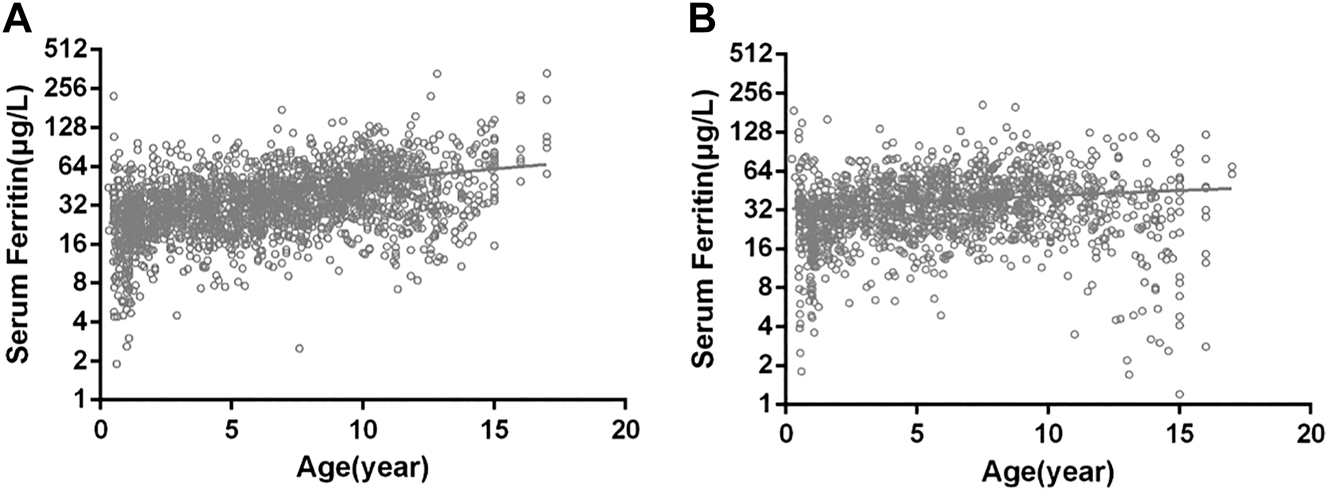
Correlation between age and serum ferritin levels.
(A) Males; (B) females.
SF concentrations in total population
In overall population, the mean value of SF was 38.60 µg/L, with a range (2.5th to 97.5th percentile) of 8.4–95.98 µg/L. The total population was categorized into five age groups (0–1, 1–3, 3–6, 6–9, and 9–17 years old). There was no significant difference in SF values between 0-1 years old and 1–3 years old, and SF values increased gradually with age after 3 years old. The range (2.5th to 97.5th percentile) of serum SF in different age groups was 4.40–108.04 µg/L, 4.05–66.64 µg/L, 10.52–77.24 µg/L, 13.70–91.30 µg/L, 8.71–117.46 µg/L, respectively. One-way ANOVA was applied to compare the variation among different age groups. In the total population, no significant difference was observed between 0–1 and 1–3 age groups (p=0.507). The mean SF value in overall population aged 1–3 years was 29 µg/L, significantly lower than those aged 3–6(p<0.001). And significant difference was observed between 3–6 and 6–9, 6–9 and 9–17 age groups (p<0.001) (Table 1).
Serum concentration of ferritin in total population.a
| Age | Ferritin of total population | p-Value | ||||
|---|---|---|---|---|---|---|
| No | Mean ± SE | Percentile | ||||
| 2.5th | 50th | 97.5th | ||||
| 0–1 year | 203 | 30.04 ± 28.15 | 4.40 | 24.30 | 108.04 | |
| 1–3 years | 619 | 29.00 ± 15.33 | 4.05 | 26.70 | 66.64 | 0.507 |
| 3–6 years | 807 | 34.86 ± 16.82 | 10.52 | 31.40 | 77.24 | 0.000b |
| 6–9 years | 789 | 40.98 ± 21.23 | 13.70 | 37.4 | 91.30 | 0.000b |
| 9–17 years | 926 | 48.11 ± 30.91 | 8.71 | 43.15 | 117.46 | 0.000b |
-
aThe p-value represents the mean level of this group compared with the upper group. bp<0.005 was considered as a significant difference.
Age- and sex-specific pediatric reference intervals for ferritin
As illustrated in Table 1, the mean value of ferritin in males was 39.15, and that in females was 37.78, slightly lower than that in males. The range (2.5th to 97.5th percentile) of serum SF in male and female were 9.50–96.60 µg/L and 6.90–95.14 µg/L. In the male group, no significant difference was observed between 0–1 and 1–3 age groups (p=0.423). For both male and female, the SF value after 1–3 years of age was correlated with age, and there was a significant difference between groups (p<0.001). In the female group, also no significant difference was observed between 0–1 and 1–3 age groups (p=0.136). The concentration of ferritin increases with age in male after 1 year old, and has the same trend in female.
Discussion
As an important iron storage substance in human body, the increase or decrease of serum ferric protein is of great value in evaluating normal tissue metabolism or assisting diagnosis of certain diseases [8]. Decreased SF is common in iron deficiency anemia, massive blood loss, long-term diarrhea, malnutrition and so on [9]. SF increased significantly in megaloblastic anemia, aplastic anemia and acute hematopoietic stagnation, and returned to normal when the condition improved [9]. Recent studies have shown that the increase of SF can assist in the diagnosis of malignant tumors [9]. The increase of SF in tumor patients was highest in liver cancer patients, followed by lung cancer patients, leukemia patients and malignant lymphoma patients [10]. SF is higher when the tumor metastases. Combined detection of tumor markers and ferritin will improve the detection rate of tumor diseases [11]. In summary, serum ferric protein has become a commonly used clinical test item due to its role in disease surveillance and screening.
In our study, we found that after the age of 3, with the increase of age, ferric protein will gradually increase. Studies have shown that with age [12], degenerative changes occur in liver, spleen, bone marrow and systemic reticuloendothelial cells. Iron-containing tissues are activated, disintegrate and release ferric protein. It has been reported in many literatures [13] that adult male serum ferric protein level is significantly higher than that of female, so it is necessary to set the reference interval according to gender group. The results showed that the SF level in both men and women showed a trend of increasing with age, but there was no significant difference in the average ferritin level in men and women. The samples of our study are from patients undergoing physical examination, and after reviewing the literature, newborns rarely take part in physical examination, at least there are no participants in our study. So there is no description of newborns in our study. In addition, according to the requirements of hospital physical examination, some items of menstruation can not be examined, so the examination is generally in the state of non-menstrual period, which should have no effect on the detection value of ferritin. Different manufacturers of kits due to different methodologies, the reference interval difference is obvious; Different regions, different ethnic groups of normal ferritin level also has the obvious difference [14], so the reference interval must consider regional differences in information and the crowd, direct reference to the manufacturer instructions or the literature of ferritin reference range will not be able to objectively reflect the reality of the local population ferritin level, so the suggestion in the evaluation of SF reference interval must be grouped according to age, sex, sets up.
Based on the statistics of children’s SF in the third class hospital of Zhejiang Province, a ferritin reference model that may be applicable to Zhejiang Province is established. The SF levels of the apparent healthy people in Provincial Children’s Hospital area were slightly different among people of different genders and ages. Test interval (but it should be noted that this statistics is only applicable to Beckman Kurt automatic chemiluminescence immunoanalyzer), which is helpful for clinical more objective disease diagnosis and monitoring, also provides a basis for physical examination people to correctly evaluate their ferritin level, avoid excessive panic caused by false high ferritin, and help clinicians make more standardized iron supplementation, prevent iron overload disease.
-
Research funding: None declared.
-
Author contributions: All authors have accepted responsibility for the entire content of this manuscript and approved its submission.
-
Competing interests: Authors state no conflict of interest.
-
Informed consent: Informed consent was obtained from all individuals included in this study.
-
Ethical approval: The local Institutional Review Board deemed the study exempt from review.
References
1. Mei, Z, Addo, OY, Jefferds, ME, Sharma, AJ, Flores-Ayala, RC, Brittenham, GM. Physiologically based serum ferritin thresholds for iron deficiency in children and non-pregnant women: a US National Health and Nutrition Examination Surveys (NHANES) serial cross-sectional study. Lancet Haematol 2021;8:e572–82. https://doi.org/10.1016/s2352-3026(21)00168-x.Search in Google Scholar
2. Auerbach, M, Adamson, JW. How we diagnose and treat iron deficiency anemia. Am J Hematol 2016;91:31–8. https://doi.org/10.1002/ajh.24201.Search in Google Scholar
3. Zhou, J, Zhou, J, Wu, ZQ, Goyal, H, Xu, HG. Ferritin index is a strong prognostic marker in adult hemophagocytic lymphohistiocytosis. Int J Clin Pract 2021;75:e13704. https://doi.org/10.1111/ijcp.13704.Search in Google Scholar
4. International Organization for Standardization. Medical laboratories: requirements for quality and competence [ISO 15189:2012,3rd ed.]. Geneva: International Organization for Standardization; 2012. Available from: www.iso.org/iso/catalogue_detail?csnumber=56115 [Accessed 28 Apr 2016].Search in Google Scholar
5. Cullis, JO, Fitzsimons, EJ, Griffiths, WJ, Tsochatzis, E, Thomas, DW, British Society for Haematology. Investigation and management of a raised serum ferritin. Br J Haematol 2018;181:331–40. https://doi.org/10.1111/bjh.15166.Search in Google Scholar
6. Tahmasebi, H, Trajcevski, K, Higgins, V, Adeli, K. Influence of ethnicity on population reference values for biochemical markers. Crit Rev Clin Lab Sci 2018;55:359–75. https://doi.org/10.1080/10408363.2018.1476455.Search in Google Scholar
7. Kratzsch, J, Fiedler, GM, Leichtle, A, Brugel, M, Buchbinder, S, Otto, L. New reference intervals for thyrotropin and thyroid hormones based on National Academy of Clinical Biochemistry criteria and regular ultrasonography of the thyroid. Clin Chem 2005;51:1480–6. https://doi.org/10.1373/clinchem.2004.047399.Search in Google Scholar
8. Hentze, MW, Muckenthaler, MU, Andrews, NC. Balancing acts: molecular control of mammalian iron metabolism. Cell 2004;117:285–97. https://doi.org/10.1016/s0092-8674(04)00343-5.Search in Google Scholar
9. Garcia-Casal, MN, Pasricha, SR, Martinez, RX, Lopez-Perez, L, Pena-Rosas, JP. Serum or plasma ferritin concentration as an index of iron deficiency and overload. Cochrane Database Syst Rev 2021;5:CD011817. https://doi.org/10.1002/14651858.CD011817.pub2.Search in Google Scholar PubMed PubMed Central
10. Song, A, Eo, W, Kim, S, Shim, B, Lee, S. Significance of serum ferritin as a prognostic factor in advanced hepatobiliary cancer patients treated with Korean medicine: a retrospective cohort study. BMC Complement Altern Med 2018;18:176. https://doi.org/10.1186/s12906-018-2240-7.Search in Google Scholar PubMed PubMed Central
11. Alkhateeb, AA, Connor, JR. The significance of ferritin in cancer: anti-oxidation, inflammation and tumorigenesis. Biochim Biophys Acta 2013;1836:245–54. https://doi.org/10.1016/j.bbcan.2013.07.002.Search in Google Scholar PubMed
12. Casale, G, Bonora, C, Migliavacca, A, Zurita, IE, de Nicola, P. Serum ferritin and ageing. Age Ageing 1981;10:119–22. https://doi.org/10.1093/ageing/10.2.119.Search in Google Scholar PubMed
13. Zheng, H, Cable, R, Spencer, B, Votto, N, Katz, SD. Iron stores and vascular function in voluntary blood donors. Arterioscler Thromb Vasc Biol 2005;25:1577–83. https://doi.org/10.1161/01.atv.0000174126.28201.61.Search in Google Scholar
14. Parkin, PC, Hamid, J, Borkhoff, CM, Abdullah, K, Atenafu, EG, Birken, CS. Laboratory reference intervals in the assessment of iron status in young children. BMJ Paediatr 2017;1:e000074. https://doi.org/10.1136/bmjpo-2017-000074.Search in Google Scholar PubMed PubMed Central
© 2022 Xiucai Zhang et al., published by De Gruyter, Berlin/Boston
This work is licensed under the Creative Commons Attribution 4.0 International License.
Articles in the same Issue
- Frontmatter
- Review
- An overview of the National Biobank of the National Health Laboratory Service: a South African national treasure for biological resources
- Original Articles
- RT-PCR detection of SARS-CoV-2 in nasopharyngeal and salivary specimens: contribution of alternative collection systems and extraction processes to cope with mass screening. Interpretation of low viral loads
- Assessment of COVID-19 mRNA vaccination titer and side effects in healthy volunteers
- Effects of sample handling on the stability of interleukin-6 in patients with breast neoplasms
- Preliminary investigation of serum ferritin level and its reference interval in apparent healthy children population in Provincial Children’s Hospital
- Reference intervals of homocysteine in apparently healthy Chinese Han ethnic adults
- Determination of Sigma metric based on various TEa sources for CBC parameters: the need for Sigma metrics harmonization
- Letters to the Editor
- Wrong Sigma metric causes chaos
- Profound decline of antibody titers 6 months after BNT162b2 vaccination in healthy volunteers
- Assessment of antibody titer after third doses of COVID-19 mRNA vaccination in healthy volunteers