Determination of Sigma metric based on various TEa sources for CBC parameters: the need for Sigma metrics harmonization
-
Seyda Ozdemir

 and
Fatma Ucar
and
Fatma Ucar

Abstract
Objectives
The application of Sigma metrics can be used for assessing the performance of diagnostic laboratories. Clinical laboratories are confronted with the trouble of having to select the best and suitable quality specifications that are required for quality planning. In this regard, our study aims at evaluating the performance of Sysmex XN-1000 hematology analyzer by using Sigma metrics based on different total allowable error (TEa) source and to determine the effects of these variations in Sigma metric evaluation.
Methods
Five TEa requirements were selected to calculate Sigma metrics of 11 complete blood count (CBC) parameters. Coefficient of variation (CV) and bias data were supplied from internal quality control (IQC) and External Quality Assessment Scheme (EQAS) respectively.
Results
According to TEa based on desirable biological variation (BV) database specifications, the highest Sigma value was achieved by white blood cell count for each level, the lowest value was achieved by Red Cell Distribution Width-Standard Deviation parameter. The Sigma calculation based on Spanish TEa showed that seven CBC parameter achieved Sigma value ≥3.
Conclusions
According to the results of the study, it can be concluded that Sigma scores have a significant fluctuation based on which TEa sources are utilized and the need for Sigma metrics harmonization and standardization is highlighted. Additionally, low Sigma values of most CBC parameters are resulted in the conclusion that the use of performance goals depending on BV data is difficult for common clinical use. Therefore, clear standardized criteria are quite necessary for the selection of TEa goal by laboratories.
Introduction
World Health Organization (WHO) defines the concept of patient safety as “the absence of preventable harm to a patient during the process of health care and reduction of risk of unnecessary harm associated with health care to an acceptable minimum” [1]. Regarding patient safety from the past to the present, laboratory medicine has been focused on the risk of negative consequences associated with laboratory tests and their prevention. Clinical laboratories play an essential role in the management of patient, providing important information critical to diagnosis, treatment and monitorization of diseases [2, 3]. From this point of view, it is very important that laboratories produce reliable results by targeting the strict quality assurance program.
In clinical laboratories, the total testing procedure is categorized in three phases such as preanalytical, analytical and postanalytical. Despite errors in laboratories are more frequently encountered during pre- and post-analytical processes, analytical errors constitute approximately 10% of total laboratory errors and the consequences negatively affect the patient safety. Although comparatively less error rates appear in the analytical phase, it is obvious that the issue of analytical quality is of high importance in terms of determining laboratory errors, and further improvement is supposed to be inevitable in this area [4], [5], [6].
The performance of diagnostic laboratories can be analyzed by the implementation of Sigma metrics during any phase of laboratory process [7]. Six Sigma has been implemented in clinical laboratories since less than two decades [5]. Six Sigma is a modern quality management tool that counts the defects which are known as defects per million (DPM) or quantifies the number of errors existing in an assay, and it can be applied for the improvement of quality control design [8]. The DPM are converted into a scale of Sigma values ranging from 0 to 6, in which six or greater values indicate world-class performance (3.4 DPM). The minimum Sigma value that can be acceptable for the performance of analytical process is three Sigma [9]. The accurate number of errors can be measured by conducting some procedures such as combining imprecision, bias, and total allowable error (TEa) [10]. Unsatisfactory analytical performances ranging from 3 to 4 Sigma have been described in laboratory medicine [2]. TEa defines the maximum potential of errors for patient results that a single result can show with a certain probability and presents the performance specifications and goals which are required for assays to be able to provide clinically valuable results [11], [12], [13]. One of the great challenges in using Sigma metrics is the selection of appropriate TEa goal because many measurands of TEa values show an alteration according to the source. The hierarchy for the selection of an appropriate TEa is recommended and introduced by the European Federation of Clinical Chemistry and Laboratory Medicine (EFLM), and the performance specifications depends on three models which are clinical outcomes (Model 1), biological variability (Model 2), and state of-the-art (SOTA) (Model 3). Despite the fact that a well-recommended hierarchy is currently available, which can be taken into consideration while selecting an appropriate TEa, there is no common decision concerning the most convenient source for a given measurand [5, 14], [15], [16].
A complete blood count (CBC) test is one of the most frequent tests applied in laboratories. Hematology analyzers are automated to a large extent, and the interpretation of results in an accurate way requires knowledge of the analytic performance of instruments which are expected to provide clinical significance of the results [17]. There are a limited number of publications related to the assessment of analytical performance of hematological parameters on Sigma scale. The purpose of the present study was to analyze the performance of Sysmex XN-1000 hematology analyzer by utilizing Sigma metrics based on different TEa source and to reveal the variation in Sigma metric calculation.
Materials and methods
This study was conducted in the Clinical Biochemistry Laboratory of the University of Health Sciences, Diskapi Yildirim Beyazit Training and Research Hospital and approved by the Ethical Committee of our hospital. White blood cell (WBC), red blood cell (RBC), hemoglobin (HGB), hematocrit (HCT), mean corpuscular volume (MCV), mean corpuscular hemoglobin (MCH), mean corpuscular hemoglobin concentration (MCHC), red cell distribution width-standard deviation (RDW-SD), platelet count (PLT), plateletcrit (PCT) and mean platelet volume (MPV) were analyzed in Sysmex XN-1000. For all these analytes mentioned above, commercial internal quality controls (IQC) provided by the vendors (XN CHECK® and e-CHECK®; SYSMEX Corporation, Chuo-ku, Kobe, Japan, Product Code; L1;213484, L2;213485, L3;213486) were utilized. Three levels of IQC data were collected retrospectively over a period of six months from June 2020 to December 2020. The analyzer and reagents were used according to the instructions outlined by the manufacturer and calibrated according to routine standard operating procedures before any control analysis. All specimens were run on a single instrument. Our laboratory also participates monthly in the External Quality Assessment Scheme (EQAS) of RIQAS (Randox international quality assessment scheme, Randox Laboratories, United Kingdom). The results of EQAS samples between January–December 2020 were included in the study.
Statistical analysis
Mean and standard deviation (SD) of the collected data were calculated with Microsoft Excel Software.
Calculation of CV% and bias%
Imprecision defined as coefficient of variance (CV) was calculated at each level of IQC.
Bias can be defined as the systematic difference between the results acquired through the laboratory’s test method and the results obtained from laboratories by applying same instrument and method or an accepted reference method. Percent bias values of each test were calculated from EQAS by the formula given below:
The average bias was used for Sigma value calculation. Five TEa sources were selected to calculate Sigma metrics. Sigma levels were measured by using the following formula:
Results
The Sigma values were determined by using five TEa sources, as shown in Figure 1, for CBC analysis and a comparison was made between the Sigma values depending on the source. The TEa of each assay was based on five standards: 1) Desirable biological variation (BV) database specifications (BV-EFLM) [18], 2) American Clinical Laboratory Improvement Amendments (New criteria of CLIA) [19], 3) State of Art (SOTA) [20, 21], 4) Standards of Rili-BAEK (Revision of the “Guideline of the German Medical Association on Quality Assurance in Medical Laboratory Examinations [22], and 5) Standards of Spanish (Minimum) [20].
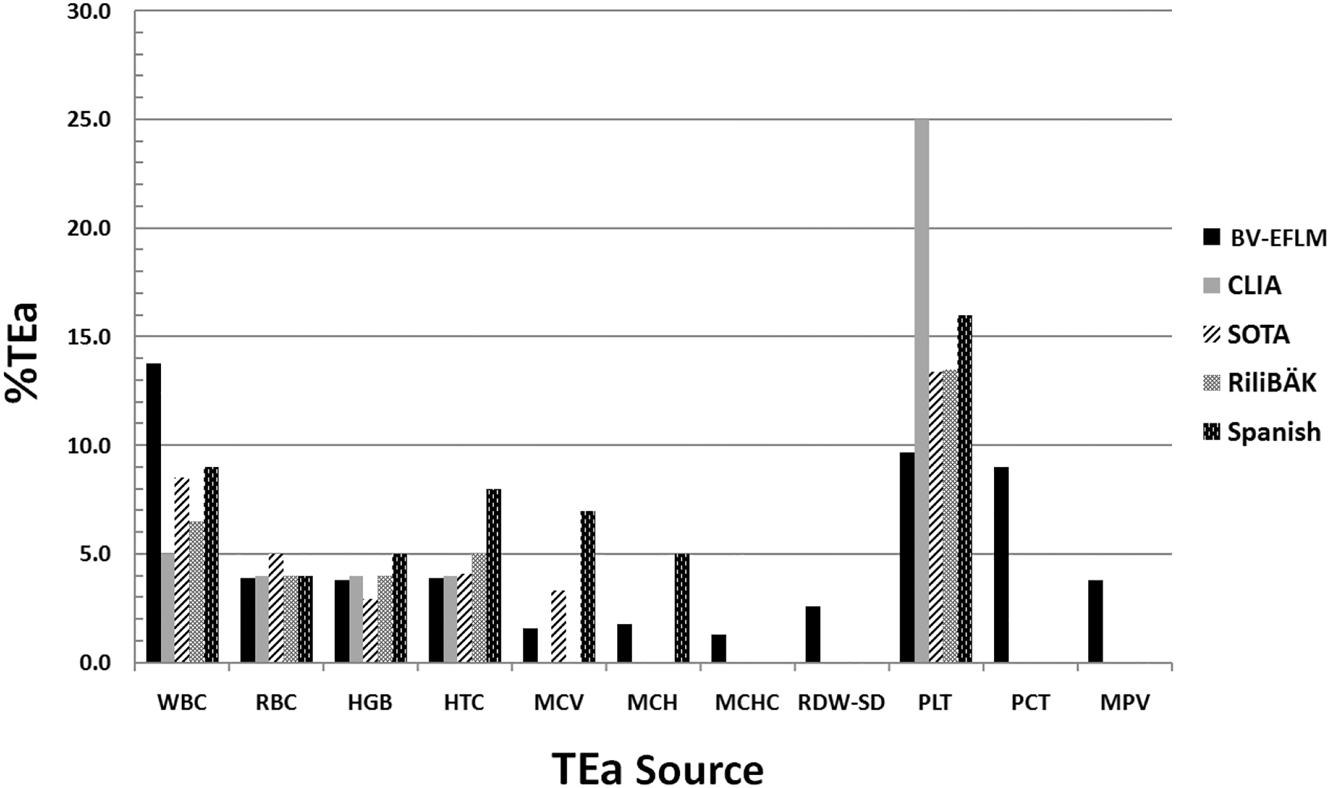
Sources for TEa specifications used to calculate Sigma metrics for CBC parameters.
Bias%, CV%, and TEa values of CBC parameters are shown in Table 1. For all the analytes, CV values were found within acceptable limits according to manufacturer claims. Sigma metrics of CBC parameters according to five different standards for TEa values were available in Table 2 for each level of IQC. Based on Table 2, according to BV-EFLM (Desirable) TEa, the highest Sigma value was achieved by WBC count for each level and the lowest value was achieved by RDW-SD parameter. The Sigma calculation based on Spanish TEa showed that seven assays achieved Sigma value ≥3 on Sysmex XN-1000 hematology analyzer (Table 3).
CV, bias and TEa values of CBC parameters.
| Parameters | CV% | Bias% | Tea, % | ||||||
|---|---|---|---|---|---|---|---|---|---|
| Standards based on BV-EFLM (desirable) | Standards of CLIA (new) | State of art (SOTA) | Standards of Rili-BAEK | Standards of Spanish (minimum) | |||||
| L1 | L2 | L3 | |||||||
| WBC, ×109 L | 2.33 | 1.66 | 1.43 | 1.96 | 13.8 | 5 | 8.52 | 6.5 | 9 |
| RBC, ×1012 L | 1.30 | 0.96 | 1.06 | 0.67 | 3.9 | 4 | 5 | 4 | 4 |
| HGB, g/dL | 1.33 | 0.90 | 0.96 | 0.78 | 3.8 | 4 | 2.95 | 4 | 5 |
| HCT, % | 1.90 | 1.56 | 1.53 | 1.04 | 3.9 | 4 | 4.11 | 5 | 8 |
| MCV, fL | 1.13 | 1.13 | 1.10 | 1.48 | 1.6 | – | 3.32 | – | 7 |
| MCH, pg | 1.16 | 0.86 | 0.83 | 0.87 | 1.8 | – | – | – | 5 |
| MCHC, g/dL | 1.70 | 1.46 | 1.36 | 0.96 | 1.3 | – | – | – | – |
| RDW-SD, fL | 1.33 | 1.23 | 1.4 | 2.69 | 2.6 | – | – | – | – |
| PLT, ×109 L | 3.96 | 2.46 | 1.9 | 2.71 | 9.7 | 25 | 13.83 | 13.5 | 16 |
| 8.5 | |||||||||
| 7.5 | |||||||||
| PCT, % | 6.23 | 3.83 | 2.73 | 3.12 | 9 | – | – | – | – |
| MPV, fL | 2.20 | 1.63 | 1.43 | 1.21 | 3.8 | – | – | – | – |
-
WBC, white blood cell; RBC, red blood cell; HGB, hemoglobin; HCT, hematocrit; MCV, mean corpuscular volume; MCH, mean corpuscular hemoglobin; MCHC, mean corpuscular hemoglobin concentration; RDW-SD, red cell distribution width-standard deviation; PLT, platelet count; PCT, plateletcrit; MPV, mean platelet volume.
Sigma metrics of CBC parameters using five different standards for TEa values.
| Parameters | Standards based on BV-EFLM (desirable) | Standards of CLIA (new) | State of art (SOTA) | Standards of Rili-BAEK | Standards of Spanish (minimum) | |||||||||||||||
|---|---|---|---|---|---|---|---|---|---|---|---|---|---|---|---|---|---|---|---|---|
| L1 | L2 | L3 | Average Sigma | L1 | L2 | L3 | Average Sigma | L1 | L2 | L3 | Average Sigma | L1 | L2 | L3 | Average Sigma | L1 | L2 | L3 | Average Sigma | |
| WBC, ×109 L | 5.07 | 7.10 | 8.25 | 6.81 | 1.30 | 1.82 | 2.11 | 1.74 | 2.81 | 3.93 | 4.57 | 3.77 | 1.94 | 2.72 | 3.16 | 2.61 | 3.01 | 4.22 | 4.91 | 4.05 |
| RBC, ×1012 L | 2.48 | 3.34 | 3.02 | 2.95 | 2.56 | 3.44 | 3.12 | 3.04 | 3.33 | 4.47 | 4.06 | 3.95 | 2.56 | 3.44 | 3.12 | 3.04 | 2.56 | 3.44 | 3.12 | 3.04 |
| HGB, g/dL | 2.26 | 3.36 | 3.12 | 2.91 | 2.41 | 3.58 | 3.33 | 3.11 | 1.63 | 2.41 | 2.24 | 2.09 | 2.41 | 3.58 | 3.33 | 3.11 | 3.16 | 4.69 | 4.37 | 4.07 |
| HCT, % | 1.50 | 1.82 | 1.86 | 1.73 | 1.56 | 1.89 | 1.93 | 1.79 | 1.61 | 1.96 | 2.00 | 1.86 | 2.08 | 2.53 | 2.58 | 2.40 | 3.66 | 4.44 | 4.54 | 4.21 |
| MCV, fL | 0.10 | 0.10 | 0.11 | 0.10 | – | – | – | – | 1.62 | 1.62 | 1.67 | 1.64 | – | – | – | – | 4.87 | 4.87 | 5.01 | 4.92 |
| MCH, pg | 0.79 | 1.06 | 1.11 | 0.99 | – | – | – | – | – | – | – | – | – | – | – | – | 3.53 | 4.76 | 4.95 | 4.41 |
| MCHC, g/dL | 0.20 | 0.23 | 0.24 | 0.22 | – | – | – | – | – | – | – | – | – | – | – | – | – | – | – | – |
| RDW-SD, fL | 0.07 | 0.07 | 0.07 | 0.07 | – | – | – | – | – | – | – | – | – | – | – | – | – | – | – | – |
| PLT, ×109 L | 1.76 | 2.83 | 3.68 | 2.76 | 5.62 | 9.04 | 11.73 | 8.79 | 2.80 | 4.51 | 5.85 | 4.39 | 2.72 | 2.35 | 2.52 | 2.53 | 3.35 | 5.39 | 6.99 | 5.24 |
| PCT, % | 0.94 | 1.53 | 2.15 | 1.54 | – | – | – | – | – | – | – | – | – | – | – | – | – | – | – | – |
| MPV, fL | 1.18 | 1.58 | 1.80 | 1.52 | – | – | – | – | – | – | – | – | – | – | – | – | – | – | – | – |
-
WBC, white blood cell; RBC, red blood cell; HGB, hemoglobin; HCT, hematocrit; MCV, mean corpuscular volume; MCH, mean corpuscular hemoglobin; MCHC, mean corpuscular hemoglobin concentration; RDW-SD, red cell distribution width-standard deviation; PLT, platelet count; PCT, plateletcrit; MPV, mean platelet volume.
Performance of the CBC parameters on Sigma metrics.
| TEa sources | ≥3 Sigma | <3 Sigma |
|---|---|---|
| BV-EFLM (desirable) | WBC | RBC, HGB, HCT, MCV, MCH, MCHC, RDW-SD, PLT, PCT, MPV |
| Standards of CLIA (new) | RBC, HGB, PLT | WBC, HCT |
| State of art (SOTA) | WBC, RBC, PLT | HGB, HCT, MCV |
| Standards of Rili-BAEK | RBC, HGB | WBC, HCT, PLT |
| Standards of Spanish (minimum) | WBC, RBC, HGB, HCT, MCV, MCH, PLT | – |
-
WBC, white blood cell; RBC, red blood cell; HGB, hemoglobin; HCT, hematocrit; MCV, mean corpuscular volume; MCH, mean corpuscular hemoglobin; MCHC, mean corpuscular hemoglobin concentration; RDW-SD, red cell distribution width-standard deviation; PLT, platelet count; PCT, plateletcrit; MPV, mean platelet volume.
In addition to the calculation of the Sigma metric, the Normalized Sigma metric Method Decision chart was utilized to make a graphical summary of instrument performance (Figure 2).
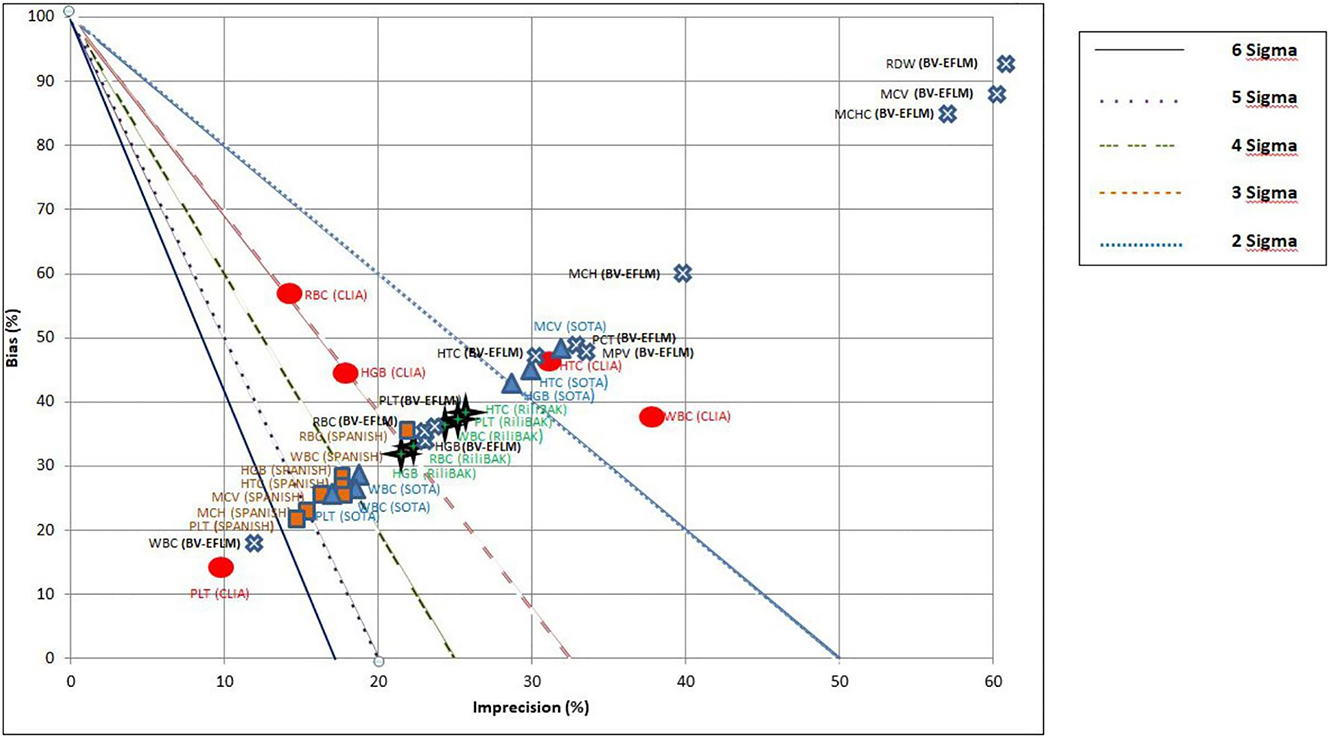
Normalized method decision chart for CBC parameters comparing Sigma metrics calculated using BV-EFLM, CLIA, SOTA, Rili-BAEK, Spanish TEa targets. X-axis represents imprecision (CV), Y-axis represents bias.
Diagonal lines separate the graph into different Sigma zones, which correspond to the different Sigma metrics levels.
In the review of literature, six studies conducting a research on Sigma metric analysis of CBC were found [23], [24], [25], [26], [27], [28], [29]. The characteristics and results of these studies are summarized in Table 4.
Summary of some of the previous studies and present study on Sigma metrics for hematology analyzers.
| Fuadi R. et al. [23] | Shaıkh MS. et al. [24] | Hidayati L. et al. [25] | Moya-Salazar J. [26] | Shu G. et al. [27,28] | Oprea OR. et al. [29] | Present study | |||
|---|---|---|---|---|---|---|---|---|---|
| Instrument used | Abbot Cell Dyne Ruby | Sysmex XE-5000 | Sysmex XT-1800i | Landwind LW D3600 | Mindray BC-3600 | Sysmex XT-1800i | Abbot Cell Dyne Ruby | Sysmex XN-1000 | |
| Number of CBC parameter | 5 | 10 | 5 | 6 | 5 | 5 | 4 | 11 | |
| Study period | 42 consecutive days | 35 consecutive days | Two month | First phase: five days Second phase:14 days |
20 days | – | – | IQC: six month EQAS: one year |
|
| CV calculation | IQC material | IQC material | IQC material | IQC material | IQC material | IQC material | IQC material | IQC material | |
| Bias calculation | IQC material | EQAS material | IQC material | IQC material | IQC material | EQAS material | EQAS material | EQAS material | |
| TEa source | Old CLIA criteria | Desirable BV (Ricos) | Old CLIA criteria | CLSI guide H26-A3. | Old CLIA criteria and BV (Ricos) | Old CLIA criteria | Old CLIA criteria | BV-EFLM (desirable), new CLIA criteria, SOTA, Standards of Rili-BAEK and Standards of Spanish (minimum) | |
| Sigma value | >6 | WBC, PLT | WBC, RBC, RDW, Neutr % | HBG | WBC, PLT | WBC, RBC,PLT | RBC, HTC | WBC | WBC (BV EFLM-desirable) |
| 3–6 | RBC, HGB | HGB, HTC, PLT, MPV, Lymph % | WBC, RBC, HTC, PLT | RBC, MCV | HGB, Lymph | WBC, HGB, PLT | RBC, HGB, PLT | – | |
| <3 | HTC | MCV | – | HGB, HTC | – | – | RBC, HGB, HCT, MCV, MCH, MCHC, RDW-SD, PLT, PCT, MPV (BV EFLM-desirable) | ||
-
WBC, white blood cell; RBC, red blood cell; HGB, hemoglobin; HCT, hematocrit; MCV, mean corpuscular volume; MCH, mean corpuscular hemoglobin; MCHC, mean corpuscular hemoglobin concentration; RDW-SD, red cell distribution width-standard deviation; PLT, platelet count; PCT, plateletcrit; MPV, mean platelet volume.
Discussion
Although the Sigma metrics model sets up an objective process to analyze the performance of a method, medical laboratories encounter great difficulty in choosing the most appropriate quality specifications for quality planning [30]. However, the optimum TEa, bias and CV to calculate six Sigma remain unclear, particularly when the sources of TEa vary between laboratories [31].
Preliminary list prepared by the EFLM Task and Finish Group on Allocation of Laboratory Tests to Different Models for Performance Specifications, most CBC components are assigned to model 1 and model 2, as indicated by Ceriotti et al. [32]. It has been proposed that the analytical performance specifications for Hb, platelets and neutrophil measurands of the CBC should be based on clinical outcomes (Model 1). However; no reliable clinical outcomes have yet been available. Model 2 offers an alternative approach for the establishment of analytical performance specifications, and it also provides the opportunity to use BV data for many other clinical applications. Laboratories establish BV based quality goals by evaluating the inherent biological variation of the analyte for three analytical performance specifications: minimum, desirable, and optimum. Many laboratories still use TEa based on the “desirable” specification. In this regard, the EFLM Biological Variation Working Group managed a very important multicenter study which is called European Biological Variation Study (EuBIVAS). The EFLM Biological Variation Database is intended to provide access to the continuously updated and easily accessible database on biological variations. Additionally, the EFLM conducts a meta-analysis of papers on the components of biological variations from which the TEa is derived and according to this information laboratories could decide TEa depending on what is possible and suitable for the laboratory [32], [33], [34].
In this study, five different quality goals have been selected to evaluate the analytical performance of CBC parameters by Sigma metrics. This study aims at evaluating the performance of Sysmex XN-1000 hematology analyzer by using Sigma metrics based on different TEa sources and to determine the effects of these variations in Sigma metric calculation. Our study demonstrates that the implementation of the six-Sigma concept on QC data commonly provides Sigma values below the minimum acceptable value of 3.0 and observations differ depending on the TEa source data used. Inevitably, the question that comes up is whether the six Sigma concept is useful for quantifying the analytical performance of hematology parameters. When using different TEa sources for calculating Sigma metric, a wide range of Sigma values was obtained. Multiple sources of TEa are available with no standardization for TEa specifications for laboratory tests around the world [5, 35, 36]. Our study used five different TEa standards to calculate Sigma values of CBC parameters. One of them is based on The EFLM Biological Variation Database, available at https://biologicalvariation.eu/ [18]. The standard based on BV- EFLM is too strict than others. Rili-BAEK is the German EQA performance specifications of the Rili-BAEK rules [22]. CLIA represents the US CLIA regulations, also new CLIA “proposed rules” were published and defined new criteria for acceptable performance for proficiency testing [19]. Minimum Spanish EQA is the minimum consensus performance specifications of multiple Spanish EQA surveys [20]. The last standard is based on a set of SOTA performance specifications for hematology parameters published by the International Journal of Laboratory Hematology. Vis and Huisman collected acceptable limits for CV and bias values for the blood count parameters according to SOTA. Based upon these data, Westgard has calculated TEa by using SOTA data [19, 20]. TEA values were not available for all CBC parameters in the five TEa sources we used, except BV and SOTA (most parameters). They are quite useful for us to gain insight into areas where previous resources have provided any significant benefit. Accordingly, CLIA does not provide any specifications (TEa) for more of the differentials.
The results of the present study indicate that “desirable” standards based on BV-EFLM data were the most stringent ones because only WBC reached to six Sigma. When using standards of Spanish, all of parameters Sigma score were above three. These results also conclude that Sigma scores have a significant fluctuation based on which TEa sources are used. Furthermore, this study demonstrates that the majority of the basic CBC parameters do not provide the acceptable Sigma value based on desirable BV- EFLM data. As a limitation of this study, we used internal control materials, not human samples, for conducting six Sigma calculations in this study. Although whole blood sample is still the ideal material for quality control of hematology analyzers, this type of specimen cannot be routinely used for many different reasons. For this reason, hematology quality control materials are different from freshly collected patient samples and inevitably have a source of uncertainty. However, in protocol of BV, a number of samples are obtained from a number of individuals whose health status is known and collected during a certain period of time with short, medium or long sampling interval [37, 38]. This means that we should not ignore a certain degree of diversity between control material and whole-blood samples in the use of the TEa based on BV.
The review of published data, predominantly measuring basic CBC parameters (WBC, RBC, Hb, Htc and PLT), reveals that analytical performance on Sigma values are above three, in which more flexible old CLIA standards and TEa values based on BV data updated by C. Ricos et al. [39] were used (Table 4) [23], [24], [25], [26], [27], [28], [29]. By the comparison of various studies, the discrepancy in Sigma metrics can be attributed to selecting different TEa source, method differences in CV and bias calculation. Although analytical problems have improved over the years due to the assay standardization, improved laboratory technology, well-defined rules for IQC as well as effective quality assurance schemes e.g., analytical quality still remains an important problem. Westgard has argued that “estimates on Sigma metric for common clinical chemistry and coagulation tests are unsatisfactory, ranging from 3 to 4 Sigma, at best” [40]. Analytical performances resulted in unsatisfactory outcomes have been identified not only in the area of clinical chemistry, but also in the fields of hematology, coagulation, and molecular biology testing [2].
Many difficulties can be faced that affect the comparability of calculated Sigma metrics among clinical laboratories. One of the most challenging issues of six Sigma is identifying the most appropriate performance specifications. Since there is not an existing quality goals (TEa) universally accepted, harmonization is necessary. Secondly, bias can affect the Sigma metric although bias is typically calculated through the use of IQC, and through either EQAS or rarely, reference materials. The highly recommended method is to use reference materials to measure bias. In addition, the differences in the methods used for CV calculation vary between laboratories. Components in the equation used to calculate the Sigma value such as TEa, bias, and CV remain unclear and vary between laboratories. Thus, there is no specific guideline of a harmonization protocol for Sigma calculation [7, 10]. The results of this study put forward different Sigma values for different parameters that were calculated using different source of TEa. Accordingly, this shows similarity with the study of Sharkawy et al. [41], who suggested a harmonization protocol for Sigma calculation. They provided a road map for TEa selection, bias and CV calculation so as to establish a harmonization between different laboratories. Moreover, Varela B. et al. [30], also proposed a selection algorithm for TEa source with the help of a graphic tool, through the use of IQC and EQAS performances, by which laboratories can evaluate TEa source that best suits the test analytical performance.
In conclusion, although Sigma metrics is a self assessment tool for performance analysis of various test parameters in the laboratory, the largest challenge of Sigma metrics is the selection of appropriate TEa goals and universally lack of a harmonized approach for Sigma calculation. This study highlights the need for Sigma metrics harmonization and standardization. Each laboratory is supposed to select TEa goal depending on clear standardized criteria of selection. Scientific societies and organizations should also make more efforts in harmonizing the entire Sigma metric process. Additionally, the result of the low Sigma values of most CBC parameters is that the use of performance goals based on BV data is extremely challenging in common clinical use. Laboratories, even as they acknowledge the controversy and challenges that will continue to feature in the use of Six Sigma, further studies should be carried out adopting the concept of harmonized approach.”
-
Research funding: None declared.
-
Author contributions: All authors have accepted responsibility for the entire content of this manuscript and approved its submission.
-
Competing interests: Authors state no conflict of interest.
-
Informed consent: Not applicable.
-
Ethical approval: This study was conducted in the Clinical Biochemistry Laboratory of the University of Health Sciences, Diskapi Yildirim Beyazit Training and Research Hospital and approved by the Ethical Committee of our hospital.
References
1. World Health Organization. 2009. The conceptual framework for the international classification for Patient Safety Version 1.1. Final Technical Report Chapter 3. The international classification for patient safety key concepts and preferred terms. https://www.who.int/teams/integrated-health-services/patient-safety [Accessed 13 Jun 2021].Search in Google Scholar
2. Plebani, M. The CCLM contribution to improvements in quality and patient safety. Clin Chem Lab Med 2013;51:39–46. https://doi.org/10.1515/cclm-2012-0094.Search in Google Scholar PubMed
3. Beastall, GH. Adding value to clinical biochemistry. Clin Chem Lab Med 2013;51:221–7. https://doi.org/10.1515/cclm-2012-0630.Search in Google Scholar PubMed
4. Iqbal, S, Mustansar, T. Application of Sigma metrics analysis for the assessment and modification of quality control program in the clinical chemistry laboratory of a tertiary care hospital. Indian J Clin Biochem 2017;32:106–9. https://doi.org/10.1007/s12291-016-0565-x.Search in Google Scholar PubMed PubMed Central
5. Westgard, S, Bayat, H, Westgard, JO. Special issue on six Sigma metrics – experiences and recommendations. Biochem Med 2018;28:020301.10.11613/BM.2018.020301Search in Google Scholar PubMed PubMed Central
6. Kapil, M, Sareen, R, Gupta, GN. Implementation of six Sigma in clinical laboratory – a new persuation. Int Clin Pathol J 2018;6:215–6.10.15406/icpjl.2018.06.00189Search in Google Scholar
7. Westgard, S, Bayat, H, Westgard, JO. Analytical Sigma metrics: a review of six Sigma implementation tools for medical laboratories. Biochem Med 2018;28:020502.10.11613/BM.2018.020502Search in Google Scholar PubMed PubMed Central
8. Sawalakhe, PV, Deshmukh, SV, Lakhe, RR. Suitability of six Sigma in testing laboratories; some explorations. Int J Eng Res Technol Ic-Quest 2016;4:30.Search in Google Scholar
9. Fasano, T, Bedini, JL, Fle, PA, Jlaiel, M, Hub, K, Datta, H, et al.. Multi-site performance evaluation and Sigma metrics of 20 assays on the Atellica chemistry and immunoassay analyzers. Clin Chem Lab Med 2019;18:59–68. https://doi.org/10.1515/cclm-2019-0699.Search in Google Scholar PubMed
10. Yang, F, Wang, W, Liu, Q, Wang, X, Bian, G, Teng, S, et al.. The application of six Sigma to perform quality analyses of plasma proteins. Ann Clin Biochem 2020;57:121–7. https://doi.org/10.1177/0004563219892023.Search in Google Scholar PubMed
11. Westgard, JO, Carey, RN, Wold, S. Criteria for judging precision and accuracy in method development and evaluation. Clin Chem 1974;20:825–33. https://doi.org/10.1093/clinchem/20.7.825.Search in Google Scholar
12. Oosterhuis, WP, Bayat, H, Armbruster, D, Coskun, A, Freeman, KP, Kallner, A, et al.. The use of error and uncertainty methods in the medical laboratory. Clin Chem Lab Med 2018;26:209–19. https://doi.org/10.1515/cclm-2017-0341.Search in Google Scholar PubMed
13. Westgard, SA. Utilizing global data to estimate analytical performance on the Sigma scale: a global comparative analysis of methods, instruments, and manufacturers through external quality assurance and proficiency testing programs. Clin Biochem 2016;49:699–707. https://doi.org/10.1016/j.clinbiochem.2016.02.013.Search in Google Scholar PubMed
14. Petrides, V, Schneider, S. Using Sigma metrics to establish analytical product performance requirements and optimize analytical performance of an in vitro diagnostic assay using a theoretical total PSA assay as an example. Biochem Med 2018;28:020903.10.11613/BM.2018.020903Search in Google Scholar PubMed PubMed Central
15. Molina, A, Guiñon, L, Perez, A, Segurana, A, Bedini, JL, Reverter, JC, et al.. State of the art vs. biological variability: comparison on hematology parameters using Spanish EQAS data. Int J Lab Hematol 2018;40:284–91. https://doi.org/10.1111/ijlh.12783.Search in Google Scholar PubMed
16. Sandberg, S, Fraser, CG, Horvath, AR, Jansen, R, Jones, G, Oosterhuis, W, et al.. Defining analytical performance specifications: consensus statement from the 1st strategic conference of the European Federation of Clinical Chemistry and Laboratory Medicine. Clin Chem Lab Med 2015;53:833–5. https://doi.org/10.1515/cclm-2015-0067.Search in Google Scholar PubMed
17. Buttarello, M, Plebani, M. Automated blood cell counts: state of the art. Am J Clin Pathol 2008;130:104–16. https://doi.org/10.1309/ek3c7ctdknvpxvtn.Search in Google Scholar
18. Aarsand, AK, Fernandez-Calle, P, Webster, C, Coskun, A, Gonzales-Lao, E, Diaz-Garzon, J, et al.. EFLM biological variation database. https://biologicalvariation.eu/ [Accessed 13 Jun 2021].Search in Google Scholar
19. CMS, CDC, HSS. Clinical laboratory improvement amendments of 1988 (CLIA) proficiency testing regulations related to analytes and acceptable performance. Fed Regist 2019;84:1536–67.Search in Google Scholar
20. Westgard Quality Control. 2016. State of the art analytical performance specifications for hematology. https://www.westgard.com/rcpa.htm [Accessed 13 Jun 2021].Search in Google Scholar
21. Vis, JY, Huisman, A. Verification and quality control of routine hematology analyzers. Int J Lab Hematol 2016;38:100–9. https://doi.org/10.1111/ijlh.12503.Search in Google Scholar PubMed
22. German Medical Associastion. Revision of the “Guideline of the German medical association on quality assurance in medical laboratory examinations – Rili-BAEK” (unauthorized translation). J Lab Med 2015;39:26–69.10.1515/labmed-2014-0046Search in Google Scholar
23. Fuadi, R. Using six Sigma to evaluate analytical performance of hematology analyzer. Indones J Clin Pathol Med Lab 2019;25:165. https://doi.org/10.24293/ijcpml.v25i2.1375.Search in Google Scholar
24. Shaikh, MS, Moiz B, B. Analytical performance evaluation of a high-volume hematology laboratory utilizing Sigma metrics as standard of excellence. Int J Lab Hematol 2016;38:193–7. https://doi.org/10.1111/ijlh.12468.Search in Google Scholar PubMed
25. Hidayati, L, Maradhona, Y. Six Sigma for evaluation of quality control in clinical laboratory. Int J Publ Health Clin Sci 2018;5:144–50.Search in Google Scholar
26. Moya-Salazar, J. Day-per-day maintenance and six Sigma of the Landwind LW D3600 hematological analyzer: clinical aspects and quality verification. Arch Hematol Blood Dis 2019;2:19–29.10.22259/2639-3581.0201004Search in Google Scholar
27. Shu, G, Lu, H, Du, H, Shi, J, Wu, G. Evaluation of Mindray BC-3600 hematology analyzer in a university hospital. Int J Lab Hematol 2012;35:61–9. https://doi.org/10.1111/j.1751-553x.2012.01464.x.Search in Google Scholar
28. Westgard Quality Control. Sigma-metrics of Mindray BC-3600 automated hematology analyzer. https://www.westgard.com/bc-3600.htm [Accessed 23 Jun 2021].Search in Google Scholar
29. Oprea, OR, Hutanu, A, Pavelea, O, Kodori, DR, Dobreanu, M. Quality control strategy for automated CBC: a laboratory point of view deducted from an internal study organised in an emergency laboratory. Rev Romana Med Lab 2020;28:19–27. https://doi.org/10.2478/rrlm-2020-0012.Search in Google Scholar
30. Varela, B, Pacheco, G. Comprehensive evaluation of the internal and external quality control to redefine analytical quality goals. Biochem Med 2018;28:020710.10.11613/BM.2018.020710Search in Google Scholar PubMed PubMed Central
31. Guo, X, Zhang, T, Gao, X, Li, P, You, T, Wu, Q, et al.. Sigma metrics for assessing the analytical quality of clinical chemistry assays: a comparison of two approaches. Biochem Med 2018;28:020708.10.11613/BM.2018.020708Search in Google Scholar PubMed PubMed Central
32. Ceriotti, F, Fernandez-Calle, P, Klee, GG, Nordin, G, Sandberg, S, Streichert, T, et al.. Criteria for assigning laboratory measurands to models for analytical performance specifications defined in the 1st EFLM strategic conference. Clin Chem Lab Med 2017;55:189–94. https://doi.org/10.1515/cclm-2016-0091.Search in Google Scholar PubMed
33. Coşkun, A, Carobene, A, Kilercik, M, Serteser, M, Sandberg, S, Aarsand, AK, et al.. European Biological Variation Study of the EFLM Working Group on Biological Variation. Within-subject and between-subject biological variation estimates of 21 hematological parameters in 30 healthy subjects. Clin Chem Lab Med 2018;56:1309–18. https://doi.org/10.1515/cclm-2017-1155.Search in Google Scholar PubMed
34. Carobene, A, Strollo, M, Jonker, N, Barla, G, Bartlett, WA, Sandberg, S, et al.. Biological Variation Working Group, European Federation of Clinical Chemistry and Laboratory Medicine. Sample collections from healthy volunteers for biological variation estimates’ update: a new project undertaken by the Working Group on biological variation established by the European Federation of Clinical Chemistry and Laboratory Medicine. Clin Chem Lab Med 2016;54:1599–608. https://doi.org/10.1515/cclm-2016-0035.Search in Google Scholar PubMed
35. Hollestelle, MJ, Ruinemans-Koerts, J, Idema, RN, Meijer, P, Maat, MP. Determination of Sigma score based on biological variation for haemostasis assays: fit-for-purpose for daily practice? Clin Chem Lab Med 2019;26:1235–41. https://doi.org/10.1515/cclm-2018-0934.Search in Google Scholar PubMed
36. Tahera, J, Cosmea, J, Renleyb, BA, Daghfalb, DJ, Yipa, PM. A novel Sigma metric encompasses global multi-site performance of 18 assays on the Abbott Alinity system. Clin Biochem 2019;63:106–12. https://doi.org/10.1016/j.clinbiochem.2018.10.003.Search in Google Scholar PubMed
37. Vidali, M, Carobene, A, Apassiti Esposito, S, Napolitano, G, Caracciolo, A, Seghezzi, M, et al.. Standardization and harmonization in hematology: instrument alignment, quality control materials, and commutability issue. Int J Lab Hematol 2021;43:364–71. https://doi.org/10.1111/ijlh.13379.Search in Google Scholar PubMed
38. Aarsand, AK, Røraas, T, Fernandez-Calle, P, Ricos, C, Díaz-Garzón, J, Jonker, N, et al.. The biological variation data critical appraisal checklist: a standard for evaluating studies on biological variation. Clin Chem 2018;64:501–14. https://doi.org/10.1373/clinchem.2017.281808.Search in Google Scholar PubMed
39. Ricos, C, Alvarez, V, Cava, F, Garcia-Lario, JV, Hernandez, A, Jimenez, CV, et al.. Current databases on biologic variation: pros, cons and progress. Scand J Clin Lab Invest 1999;59:491–500. https://doi.org/10.1080/00365519950185229.Search in Google Scholar PubMed
40. Westgard, JO, Westgard, SA. The quality of laboratory testing today. An assessment of σ metrics for analytic quality using performance data from proficiency testing surveys and the CLIA criteria for acceptable performance. Am J Clin Pathol 2006;125:343–54. https://doi.org/10.1309/v50h4frvvwx12c79.Search in Google Scholar
41. Sharkawy, RE, Westgard, S, Awad, AM, Ahmed, AO, Iman, H, Gaballah, A, et al.. Comparison between Sigma metrics in four accredited Egyptian medical laboratories in some biochemical tests: an initiative towards Sigma calculation harmonization. Biochem Med 2018;28:020711.10.11613/BM.2018.020711Search in Google Scholar PubMed PubMed Central
© 2022 Seyda Ozdemir and Fatma Ucar, published by De Gruyter, Berlin/Boston
This work is licensed under the Creative Commons Attribution 4.0 International License.
Articles in the same Issue
- Frontmatter
- Review
- An overview of the National Biobank of the National Health Laboratory Service: a South African national treasure for biological resources
- Original Articles
- RT-PCR detection of SARS-CoV-2 in nasopharyngeal and salivary specimens: contribution of alternative collection systems and extraction processes to cope with mass screening. Interpretation of low viral loads
- Assessment of COVID-19 mRNA vaccination titer and side effects in healthy volunteers
- Effects of sample handling on the stability of interleukin-6 in patients with breast neoplasms
- Preliminary investigation of serum ferritin level and its reference interval in apparent healthy children population in Provincial Children’s Hospital
- Reference intervals of homocysteine in apparently healthy Chinese Han ethnic adults
- Determination of Sigma metric based on various TEa sources for CBC parameters: the need for Sigma metrics harmonization
- Letters to the Editor
- Wrong Sigma metric causes chaos
- Profound decline of antibody titers 6 months after BNT162b2 vaccination in healthy volunteers
- Assessment of antibody titer after third doses of COVID-19 mRNA vaccination in healthy volunteers