Biomarkers of oxidative stress in pregnant women with recurrent miscarriages
-
Mirjana Bogavac

 ,
Ana Jakovljević
,
Ana Jakovljević

Abstract
Background
The aim of this study was to evaluate the markers of oxidative stress (OS), as well as the magnesium (Mg) concentration, pregnancy-associated plasma protein A (PAPP-A) and human chorionic gonadotropin (β-hCG) values in patients with previous recurrent miscarriages, with the purpose of comparing the level of OS with normal pregnancy.
Methods
The study was conducted as a prospective study, which included a total of 95 pregnant women divided into two groups. In the study group (n = 35), there were women with at least three consecutive previous miscarriages. The control group (n = 60) consisted of healthy pregnant women without previous miscarriages and complications in pregnancy. Blood samples were taken between the 11th and 14th weeks of gestation, and the values of superoxide dismutase (SOD-1), glutathione peroxidase (GSH-Px) and total antioxidant status (TAS) in the serum, as well as the Mg concentration, PAPP-A and β-hCG values were determined.
Results
The values of SOD and GHS-Px were statistically higher in the study group, while the values of TAS were statistically significantly higher in the control group. The values of the Mg concentration were statistically significantly higher in the control group, while the values of β-hCG were statistically significantly higher in the study group. When the study group was divided into subgroups according to the outcome of pregnancy, there were statistical differences in the level of GSH-Px, SOD between miscarriages and the term delivery group, as well as in the Mg concentration between miscarriages and the term delivery group and between the term and preterm delivery groups. Higher values of SOD and GHS-Px, and lower values of TAS and Mg concentration could be used as markers for the prediction of spontaneous miscarriages.
Conclusions
The results of this research indicated higher OS and exhaustion of antioxidant mechanisms in early pregnancy in a group with recurrent miscarriages. Also, lower values of serum Mg concentration could be one of the markers for the prediction of spontaneous miscarriages.
Introduction
A precisely regulated balance between the production of reactive oxygen species (ROS) and the activity of the components of antioxidant protection is required for the maintenance of integrity and function of all cells and tissues in normal pregnancy. The level of circulating products of lipid peroxidation physiologically increases continuously during pregnancy [1].
The reasons for the increased intensity of lipid peroxidation are numerous, but increased levels of circulating lipoproteins, prooxidant activity of the placenta and an altered basal metabolism in pregnancy are considered as the most important ones [2], [3].
Physiological pregnancy is characterized by well-balanced prooxidative and antioxidative processes. Increased ROS activity is accompanied by increased levels of antioxidants, Cu, Zn and superoxide dismutase (SOD-1) first of all, thereby maintaining the delicate balance between the cellular redox equilibrium systems that produce ROS, and the defense mechanisms which detoxify them [4], [5]. Oxidative stress (OS) occurs if the production of highly reactive metabolites of oxygen exceeds the capacity of antioxidant defense, leading to the disruption of cellular homeostasis [6], [7], [8].
As OS is a result of disturbed balance of prooxidants and antioxidants, it is very difficult to determine its level only through monitoring of prooxidant and antioxidant parameters, both in pregnancy and beyond. It has been found that no single antioxidant may reflect the overall defense response as the total antioxidant status (TAS), which is a measure of the total antioxidant capacity, and the joint activity of antioxidants, both enzymatic and nonenzymatic, can in the blood and biological fluids [9], [10]. Numerous studies [11], [12] have shown that OS in pregnancy has a significant impact on systemic and placental pathophysiological processes, which leads to disorders of placental vascularization, causing endothelial and immune dysfunction. For this reason, OS is considered to be a significant factor in pathological conditions in pregnancy such as the occurrence of spontaneous and recurrent miscarriage, preeclampsia, preterm delivery, mole hydatidosis and others [13], [14], [15], [16].
Recurrent miscarriage is defined as three or more consecutive spontaneous abortions before completing 20 weeks of gestation [17]. It is believed that this pathological condition affects 0.5%–3% of women in the reproductive period. In 50%–60% of cases with recurrent miscarriage, the cause is unknown, and this is a reason why they are classified as idiopathic. The consequences faced by women, particularly with repeated miscarriages, can be severe psychological trauma and gynecological complications [18], [19]. The problem of idiopathic recurrent miscarriage is the constant focus of doctors from various specialties, due to the complexity of a thorough understanding of their mechanisms [17], [20].
In our previous study [21], we investigated the parameters of OS in amniotic fluid and we concluded that the parameters of OS in amniotic fluid could be altered in certain pathological conditions. Their use as clinical biomarkers is limited due to great variations in the volume of amniotic fluid between patients, which favors the use of hemolysate or serum of pregnant women. We also investigated the evaluation of the markers of OS in the first trimester of pregnancy in patients with preeclampsia, and we concluded that a higher level of OS occurred in the first trimester of pregnancy with preeclampsia, which may indicate that the initiation and development of pathophysiological processes underlying preeclampsia start much earlier than the clinical syndrome exhibit [22].
A large number of women are at risk of hypomagnesemia due to insufficient food intake. In developed countries, as many as 23% of women consume less than two-thirds of the recommended daily intake of magnesium (320 mg), while in developing countries, such as India, it is estimated that approximately 45% of pregnant women have low levels of serum magnesium (<0.75 mmol/L) [23].
Some recent studies have recommended prophylactic oral magnesium supplementation as an inexpensive way of decreasing the risk of preterm labor among all pregnant women or those at higher risk [24], [25]. Serum magnesium level can be used as a predictive tool for preterm labor. Serum magnesium evaluation must be carried out in pregnant women in order that high-risk preterm labor can be predicted and prevented. Measurement of magnesium may also help in the cases of preterm labor to select patients who benefit from MgSO4 as a tocolytic agent [26]. A pregnancy loss that occurs after a positive human chorionic gonadotropin (β-hCG) or a raised serum β-hCG, but before ultrasound or histological verification, is defined as a biochemical loss occurring before 6 weeks of gestation, whereas clinical miscarriage is the loss of positive ultrasound examination or histological evidence for intrauterine pregnancy [27].
Progesterone and β-hCG concentration together were raised for potential of miscarriage predictor as they are referred to as reliable single markers [28].
A suboptimal rise in serum β-hCG (lower than 66% with 2 days interval in serial measurement) was previously considered as having a good prognostic accuracy. However, β-hCG should be carefully interpreted. It is advisable to combine it with other tests [29].
β-hCG is a glycoprotein produced by trophoblasts and is detectable in maternal serum within a few days after implantation. The prognostic significance of serum β-hCG measurement is based on its natural variability level during the course of pregnancy, with a high slope of increase during the first 8 weeks of pregnancy and then a slow decline until labor. β-hCG is beneficial to predict complications in pregnancy including pregnancy loss or ectopic pregnancy [30], [31].
Inhibin A and β-hCG are two substances produced by the growing trophoblast and the lower level of these two hormones was found to be associated with miscarriage [32].
However, supplementation with β-hCG had no potential advantage to overcome threatened miscarriage [33].
Three studies with 236 women analyzed pregnancy-associated plasma protein A (PAPP-A) to predict miscarriage [34], [35], [36]. PAPP-A had a poor and wide sensitivity that ranged from 25 to 64% but a high specificity ranging from 88 to 94%. Westergaard et al. were the first to evaluate PAPP-A in the prediction of pregnancy outcome in women presenting with a threatened miscarriage. They concluded that PAPP-A measurement might be useful in differentiating between pregnancies that will have a normal outcome and those that will not [37].
Aim of the study
The first aim of this study was to evaluate the markers of OS in patients with previous recurrent miscarriages, with the purpose of comparing the level of OS with normal pregnancy. The second aim of this study was to evaluate the values of magnesium (Mg), PAPP-A and β-hCG in patients with previous recurrent miscarriages, with the purpose of comparing the level of examined markers with normal pregnancy.
Materials and methods
The study was conducted at the Department of Obstetrics and Gynecology, Clinical Center of Vojvodina in Novi Sad as a prospective in a 4-year period. This study included a total of 95 pregnant women who were concordant with participation in the study, which was confirmed by their written consent in accordance with the criteria of the Helsinki Declaration. The protocol was approved by the Ethics Committee of the Medical Faculty in the Novi Sad Clinical Center of Vojvodina (Novi Sad).
The criteria for inclusion in the study were pregnancy age between 11 and 14 weeks, singleton pregnancy and the existence of three previous spontaneous abortions (with pathophysiological and cytogenetic confirmation of previous pregnancies that there were no fetal abnormalities or chromosomal aberrations). The study included only non-smokers.
The criteria for exclusion were: multiple pregnancies, polyhydramnios, maternal diseases (diabetes, hypertension, obesity, preeclampsia, kidney and heart disease, and urinary tract infections), fetal diseases (delayed development of the fetus), and local factors such as anatomical malformations of the uterus and vagina, cervical insufficiency, malignancies and any disease that can affect the levels of the biochemical markers in the serum, such as autoimmune diseases and hormonal imbalance.
From the originally formed database of patients, for the purpose of this study, 95 patients were isolated and these data were analyzed.
The study involved two groups of pregnant women: a study group (n=35) with at least three previous recurrent miscarriages and a control group (n=60), which consisted of healthy women without miscarriage and complications in previous pregnancies. After anamnesis and clinical examination, blood samples were taken from the patients –whole blood and serum – in which certain basic hematological and biochemical parameters were determined including the markers of OS such as SOD-1, TAS and glutathione peroxidase (GSH-Px), as well as Mg concentration, PAPP-A and β-hCG values.
The complete blood count (CBC) and C-reactive protein (CRP) were determined using an automated hematology analyzer ABX Micros CRP 200 (HoribaABX Diagnostics, Oberursel, Germany).
The GSH-Px activity was determined by a modified method of Paglia and Valentine with cumene hydroperoxide using RanSel (Randox, Ireland) tests (21). The activity of SOD-1 was measured by the xanthine oxidase (XOD) method using RanSOD tests (Randox, Ireland). TAS was determined by monitoring the inhibition of 2,2′-azino-bis(3-ethylbenzothiazoline-6-sulfonic acid) (ABTS)+colors using the TAS BIOREX (BIOREX Diagnostic Limited, Antrim, UK) kit. Mg was measured by standard biochemical methods using the clinical chemistry analyzer ADVIA 1800 (Siemens Healthcare GmbH, Erlangen, Germany). PAPP-A and free β-hCG values were determined by immune fluorimetric method using a Kryptor Brahms analyzer (Brahms GMbH [Thermo Scientific], Germany).
Data were analyzed using the statistical package IBM SPSS Statistics, version 23 and MedCalc for PC (MedCalc Software, Belgium). p-Values less than 0.05 were considered statistically significant. The results are presented either on graphs or in tables.
Results
The demographic and clinical characteristics of the patients in the study and control groups are shown in Table 1. There were significant differences between the groups with respect to the number of miscarriages (p<0.05), gestational week of pregnancy outcome (p<0.05), erythrocyte (Er) concentration (p<0.05), GSX-Px (p<0.05), SOG (p<0.05), TAS (p<0.05), Mg concentration (p<0.05), β-hCG (p<0.05) and outcome of pregnancy (p<0.05). No differences were found between the study and control groups with respect to the age of patients (p>0.05), body mass index (BMI) (p>0.05), body weight and length of the child (p>0.05), Apgar score (p>0.05), leukocyte (Leu) concentration (p>0.05), platelet concentration (p>0.05), hemoglobin (Hgb) concentration (p>0.05), hematocrit (Hct) concentration (p>0.05), CRP concentration (p>0.05), PAPP-A (p>0.05), dwelling place (p>0.05), problems in the current pregnancy (p>0.05) and sex of the child (p>0.05) (Table 1).
T test – demographic and clinical characteristics of pregnant women.
| Group | n | SE | Test results | p-Value | s/ns | ||
|---|---|---|---|---|---|---|---|
| Age | Control group | 60 | 27.80±4.994 | 0.645 | t=−1.414 | 0.162 | ns |
| Study group | 35 | 29.29±4.908 | 0.830 | ||||
| BMI | Control group | 60 | 23.15±3.08 | 0.398 | t=−0.57 | 0.955 | ns |
| Study group | 35 | 23.18±2.87 | 0.486 | ||||
| Number of miscarriages | Control group | 60 | 0.23±0.533 | 0.069 | t=−19.720 | 0.000 | s |
| Study group | 35 | 3.49±0.887 | 0.150 | ||||
| Gestational week of pregnancy outcome | Control group | 60 | 38.88±1.427 | 0.184 | t=2.754 | 0.009 | s |
| Study group | 35 | 32.54±13.576 | 2.295 | ||||
| Body weight of the child | Control group | 60 | 3353.17±453.231 | 58.512 | t=1.263 | 0.212 | ns |
| Study group | 35 | 3211.43±566.834 | 95.812 | ||||
| Body length of the child | Control group | 60 | 49.88±2.315 | 0.299 | t=1.091 | 0.278 | ns |
| Study group | 35 | 49.43±1.720 | 0.291 | ||||
| Apgar score | Control group | 60 | 9.49±0.622 | 0.080 | t=1.420 | 0.163 | ns |
| Study group | 35 | 9.08±1.655 | 0.280 | ||||
| Er conc. | Control group | 60 | 4.31±3.29 | 4.25 | t=2.229 | 0.029 | s |
| Study group | 35 | 4.14±3.73 | 6.32 | ||||
| Leu conc. | Control group | 60 | 9.29±2.22 | 2.87 | t=0.130 | 0.897 | ns |
| Study group | 35 | 9.23±2.17 | 3.68 | ||||
| Plt conc. | Control group | 60 | 248.82±65.88 | 85.06 | t=0.160 | 0.873 | ns |
| Study group | 35 | 246.85±52.68 | 89.04 | ||||
| Hgb conc. | Control group | 60 | 121.08±9.61 | 1.24 | t=0.835 | 0.406 | ns |
| Study group | 35 | 119.48±8.60 | 1.45 | ||||
| Hct conc. | Control group | 60 | 0.36087±0.029752 | 0.003841 | t=1.008 | 0.317 | ns |
| Study group | 35 | 0.35483±0.027208 | 0.004599 | ||||
| CRP conc. | Control group | 60 | 3.55333±4.333530 | 0.559456 | t=0.511 | 0.611 | ns |
| Study group | 35 | 3.14000 3.455618 | 0.584106 | ||||
| GSH-Px | Control group | 60 | 534.14000±151.731577 | 19.588462 | t=−6.137 | 0.000 | s |
| Study group | 35 | 732.28571±151.847935 | 25.666986 | ||||
| SOD | Control group | 60 | 29.58667±13.348059 | 1.723227 | t=−5.869 | 0.000 | s |
| Study group | 35 | 52.22286±20.414702 | 3.450714 | ||||
| TAS | Control group | 60 | 1.99667±1.208495 | 0.156016 | t=2.804 | 0.007 | s |
| Study group | 35 | 1.24543±1.288340 | 0.217769 | ||||
| Mg conc. | Control group | 60 | 0.89583±0.096941 | 0.012515 | t=5.463 | 0.000 | s |
| Study group | 35 | 0.73429±0.158509 | 0.026793 | ||||
| PAPP-A | Control group | 60 | 1.36068±0.771191 | 0.099560 | t=−0.039 | 0.969 | ns |
| Study group | 35 | 1.36649±0.663651 | 0.112178 | ||||
| β-hCG | Control group | 60 | 1.12687±0.580405 | 0.074930 | t=−2.062 | 0.045 | s |
| Study group | 35 | 1.59526±1.268417 | 0.214402 | ||||
| Dwelling place | Control group | 60 | / | / | χ2=0.620 | 0.284 | ns |
| Study group | 35 | ||||||
| Problems in the current pregnancy | Control group | 60 | / | / | χ2=3.117 | 0.210 | ns |
| Study group | 35 | ||||||
| Outcome of pregnancy | Control group | 60 | / | / | χ2=12.926 | 0.005 | s |
| Study group | 35 | ||||||
| Sex of the child | Control group | 60 | / | / | χ2=0.002 | 0.568 | ns |
| Study group | 35 |
The values of the examined parameters in pregnant women with recurrent miscarriages and in the control group in the first trimester are displayed in Figures 1–8.

Distribution of the mean value of the number of previous miscarriages by the group of patients.
In the control study there was no previous miscarriages.
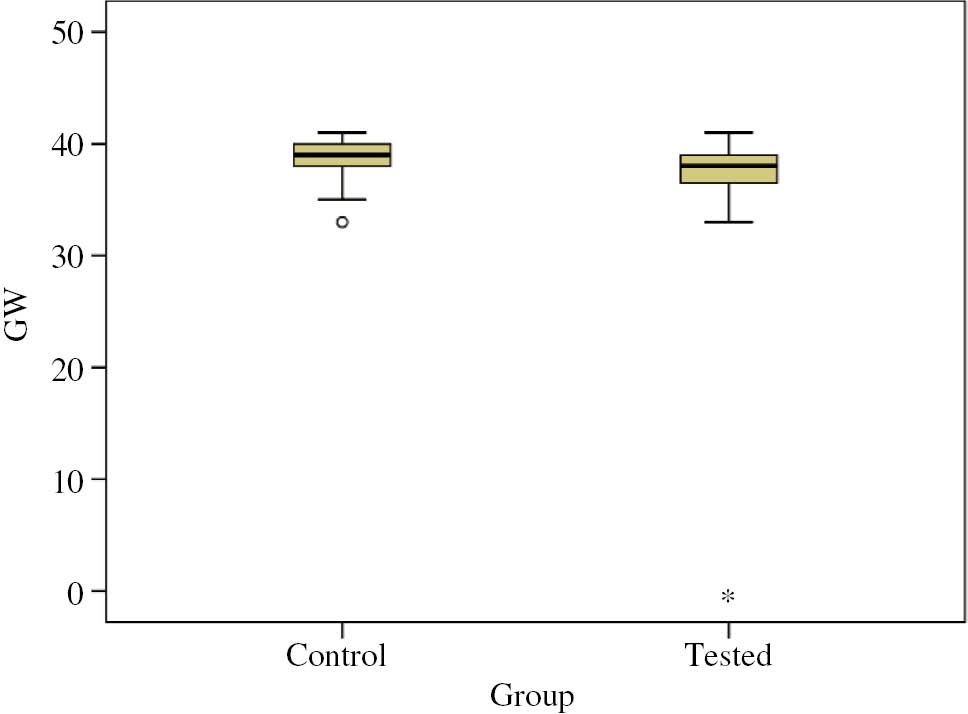
Distribution of the mean value of GW by the group of patients.
GW, gestational week of pregnancy outcome.

Distribution of the mean value of Er conc. by the group of patients.
Er conc., erythrocyte concentration.

Distribution of the mean value of GSH-Px by the group of patients.
GSH-Px, glutathione peroxidase.

Distribution of the mean value of SOD by the group of patients.
SOD, superoxide dismutase.

Distribution of the mean value of TAS by the group of patients.
TAS, total antioxidant status.
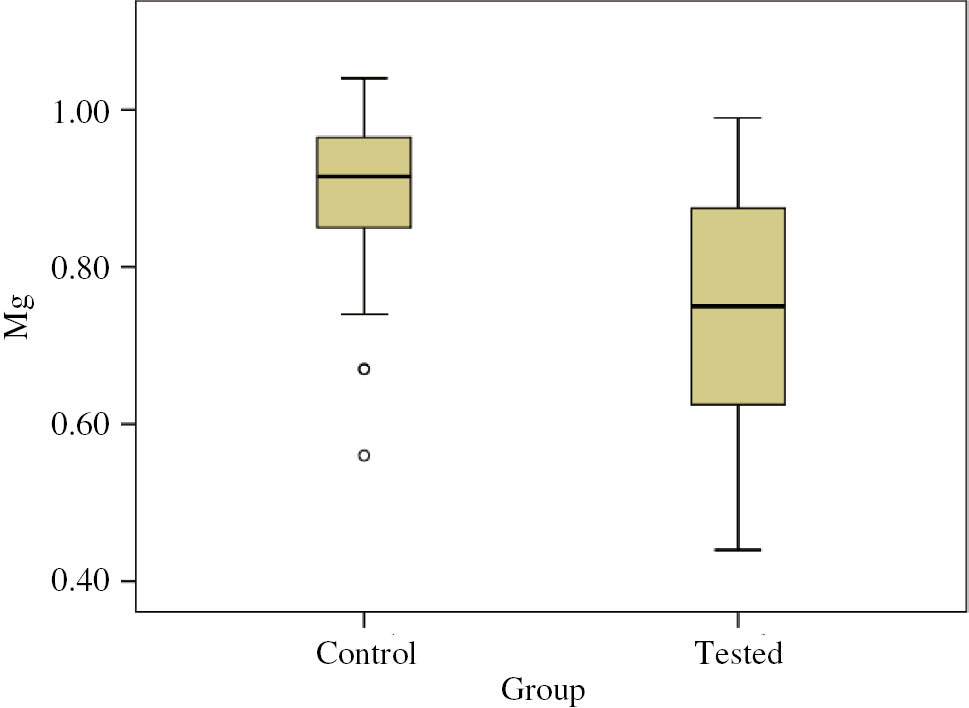
Distribution of the mean value of Mg concentration by the group of patients.
Mg, magnesium concentration (mmol/L).

Distribution of the mean value of β-hCG by the group of patients.
β-hCG, β-subunit of human chronic gonadotropin (CorMom).
The number of previous miscarriages of women in the control and the study groups are displayed in Figure 1. The mean value (mean±standard deviation
The gestational week of pregnancy outcome for women in the control and the study groups are displayed in Figure 2. The mean value
The Er concentration of women in the control and the study groups are displayed in Figure 3. The mean value
The values of SOD in the serum of women in the control and the study groups are displayed in Figure 4. The mean value
The values of GSH-Px in the serum of women in the control and the study groups are displayed in Figure 5. The mean value
The values of TAS in the serum of women in the control and the study groups are displayed in Figure 6. The mean value
The values of Mg in the serum of women in the control and the study groups are displayed in Figure 7. The mean value
The values of β-hCG in the serum of women in the control and the study groups are displayed in Figure 8. The mean value
The mean value
In Figure 9, we show the distribution of pregnancy outcome. In the control group, there were no miscarriages, and over 90% of patients finished pregnancy in term. In the study group, almost 20% of the patients had miscarriages.

Distribution of pregnancy outcome by the group of patients.
In control study was no previous miscarriages.
Table 2 shows the OS values in the study group depending on the outcome of the current pregnancy. We divided the study group into three subgroups: I group – with miscarriages, II group – with preterm delivery (delivery before the 37th week of gestation) and III group – with delivery after the 37th week of gestation in current pregnancy.
ANOVA – multiple comparisons (GSH-Px, SOD and TAS).
| Tukey HSD | |||||||
|---|---|---|---|---|---|---|---|
| Dependent variable | (I) Outcome | (J) Outcome | Mean difference (I–J) | SE | Sig. | 95% Confidence interval | |
| Lower bound | Upper bound | ||||||
| GSH-Px | Miscarriages | Term delivery | 248.448434a | 79.070582 | 0.006 | 60.08388 | 436.81299 |
| Preterm delivery | 202.668571 | 100.543558 | 0.114 | −36.84962 | 442.18676 | ||
| Term delivery | Miscarriages | −248.448434a | 79.070582 | 0.006 | −436.81299 | −60.08388 | |
| Preterm delivery | −45.779862 | 67.581968 | 0.777 | −206.77586 | 115.21614 | ||
| Preterm delivery | Miscarriages | −202.668571 | 100.543558 | 0.114 | −442.18676 | 36.84962 | |
| Term delivery | 45.779862 | 67.581968 | 0.777 | −115.21614 | 206.77586 | ||
| SOD | Miscarriages | Term delivery | 28.643855a | 8.585740 | 0.003 | 8.19062 | 49.09709 |
| Preterm delivery | 22.094286 | 10.917345 | 0.112 | −3.91338 | 48.10195 | ||
| Term delivery | miscarriages | −28.643855a | 8.585740 | 0.003 | −49.09709 | −8.19062 | |
| Preterm delivery | −6.549570 | 7.338269 | 0.646 | −24.03104 | 10.93190 | ||
| Preterm delivery | Miscarriages | −22.094286 | 10.917345 | 0.112 | −48.10195 | 3.91338 | |
| Term delivery | 6.549570 | 7.338269 | 0.646 | −10.93190 | 24.03104 | ||
| TAS | Miscarriages | Term delivery | −1.237639 | 0.572289 | 0.083 | −2.60096 | 0.12569 |
| Preterm delivery | −0.225143 | 0.727704 | 0.949 | −1.95870 | 1.50842 | ||
| Term delivery | Miscarriages | 1.237639 | 0.572289 | 0.083 | −0.12569 | 2.60096 | |
| Preterm delivery | 1.012496 | 0.489138 | 0.102 | −0.15274 | 2.17774 | ||
| Preterm delivery | Miscarriages | 0.225143 | 0.727704 | 0.949 | −1.50842 | 1.95870 | |
| Term delivery | −1.012496 | 0.489138 | 0.102 | −2.17774 | 0.15274 | ||
GSH-Px, glutathione peroxidase; SE, standard error; SOD, superoxide dismutase; TAS, total antioxidant status. aThe mean difference is significant at the 0.05 level.
There were statistically significant differences in the level of GSH-Px between the subgroups with miscarriages and term delivery (p=0.006). In the other subgroups, there were no statistically significant differences in the level of GSH-Px (Figure 10).

Distribution of the mean value of GSH-Px by outcome.
GSH-Px, glutathione peroxidase.
There were statistically significant differences in the level of SOD between the subgroups with miscarriages and term delivery (p=0.003). In the other subgroups, there were no statistically significant differences in the level of SOD (Figure 11). There were no statistically significant differences in the level of TAS between the subgroups (Figure 12).

Distribution of the mean value of SOD by outcome.
SOD, superoxide dismutase.

Distribution of the mean value of TAS by outcome.
TAS, total antioxidant status.
In Table 3, we show the level of Mg, PAPP-A and β-hCG in the study group depending on the outcome of the current pregnancy. We divided the study group into three subgroups: I group – with miscarriages, II group – with preterm delivery (delivery before the 37th week of gestation) and III group – with delivery after the 37th week of gestation in the current pregnancy.
ANOVA – multiple comparisons (Mg, PAPP-A and β-hCG).
| Tukey HSD | |||||||
|---|---|---|---|---|---|---|---|
| Dependent variable | (I) Outcome | (J) Outcome | Mean difference (I–J) | Std. error | Sig. | 95% Confidence interval | |
| Lower bound | Upper bound | ||||||
| Mg | Miscarriage | Term delivery | −0.15308a | 0.06009 | 0.033 | −0.2962 | −0.0099 |
| Preterm delivery | 0.07371 | 0.07641 | 0.601 | −0.1083 | 0.2557 | ||
| Term delivery | Miscarriage | 0.15308a | 0.06009 | 0.033 | 0.0099 | 0.2962 | |
| Preterm delivery | 0.22680a | 0.05136 | 0.000 | 0.1044 | 0.3492 | ||
| Preterm delivery | Miscarriage | −0.07371 | 0.07641 | 0.601 | −0.2557 | 0.1083 | |
| Term delivery | −0.22680a | 0.05136 | 0.000 | −0.3492 | −0.1044 | ||
| PAPP-A | Miscarriage | Term delivery | −0.57398 | 0.33374 | 0.203 | −1.3690 | 0.2211 |
| Preterm delivery | −0.71043 | 0.42438 | 0.221 | −1.7214 | 0.3005 | ||
| Term delivery | Miscarriage | 0.57398 | 0.33374 | 0.203 | −0.2211 | 1.3690 | |
| Preterm delivery | −0.13645 | 0.28525 | 0.882 | −0.8160 | 0.5431 | ||
| Preterm delivery | Miscarriage | 0.71043 | 0.42438 | 0.221 | −0.3005 | 1.7214 | |
| Term delivery | 0.13645 | 0.28525 | 0.882 | −0.5431 | 0.8160 | ||
| β-hCG | Miscarriage | Term delivery | 0.60628 | 0.42081 | 0.324 | −0.3962 | 1.6087 |
| Preterm delivery | 0.93734 | 0.53508 | 0.192 | −0.3373 | 2.2120 | ||
| Term delivery | Miscarriage | −0.60628 | 0.42081 | 0.324 | −1.6087 | 0.3962 | |
| Preterm delivery | 0.33106 | 0.35966 | 0.629 | −0.5257 | 1.1879 | ||
| Preterm delivery | Miscarriage | −0.93734 | 0.53508 | 0.192 | −2.2120 | 0.3373 | |
| Term delivery | −0.33106 | 0.35966 | 0.629 | −1.1879 | 0.5257 | ||
β-hCG, beta human chorionic gonadotropin; Mg conc., magnesium concentration; PAPP-A, pregnancy-associated plasma protein A; SE, standard error. aThe mean difference is significant at the 0.05 level.
There were statistically significant differences in the level of Mg between the subgroups with miscarriages and term delivery (p=0.033); and between the subgroups with term and preterm delivery (p<0.001). In the other subgroups, there were no statistically significant differences in the level of Mg (Figure 13).

Distribution of the mean value of Mg concentration by outcome.
Mg, magnesium concentration (mmol/L).
There were no statistically significant differences in the level of PAPP-A between the subgroups. There were no statistically significant differences in the level of β-hCG between the subgroups (Figures 14 and 15).

Distribution of the mean value of PAPP-A by outcome.
PAPP-A, pregnancy-associated plasma protein A (CorMom).

Distribution of the mean value of β-hCG by outcome.
β-hCG, β-subunit of human chorionic gonadotropin (CorMom).
Figures 16–19 show the interactive dot diagrams for the GSH-Px, SOD and TAS values in the study and control groups, and the receiver operating characteristic (ROC) curves for the GSH-Px, SOD and TAS values. The results indicate that the GSH-Px value cutoff level at ≥687.3 had a sensitivity of 83.3% and a specificity of 68.6%, and a positive likelihood ratio of 125.04 in the detection of women with recurrent miscarriages (Figure 16). The results indicate that the SOD value cutoff level at ≥34.8 had a sensitivity of 75% and a specificity of 80%, and a positive likelihood ratio of 113.951 in the detection of women with recurrent miscarriages (Figure 17). The results indicate that the TAS value cutoff level at ≤0.78 had a sensitivity of 88.3% and a specificity of 57.1%, and a positive likelihood ratio of 97.315 in the detection of women with recurrent miscarriages (Figure 18).

Interactive dot diagram of GSH-Px levels in the first trimester of pregnancy in the group of patients with calculated maximum sensitivity and specificity values.
GSH-Px, glutathione peroxidase; group 0, patients with recurrent miscarriages; group 1, control group; Sens, sensitivity; spec, specificity.

Interactive dot diagram of SOD levels in the first trimester of pregnancy in the group of patients with calculated maximum sensitivity and specificity values.
SOD, superoxide dismutase; group 0, patients with recurrent miscarriages; group 1, control group; Sens, sensitivity; spec, specificity.

Interactive dot diagram of TAS levels in the first trimester of pregnancy in the group of patients with calculated maximum sensitivity and specificity values.
TAS, total antioxidant status; group 0, patients with recurrent miscarriages; group 1, control group; Sens, sensitivity; spec, specificity.

ROC curves of the serum concentrations of GSH-Px, SOD and TAS in the first trimester of pregnancy as early markers in the prediction of recurrent miscarriages.
GSH-Px, glutathione peroxidase, SOD, superoxide dismutase, TAS, total antioxidant status.
ROC analysis showed that the highest diagnostic accuracy was detected for SOD (area under the curve [AUC] 0.822, p<0.001), GSH-Px (AUC 0.818, p<0.001) and TAS (AUC 259, p<0.001) in the detection of spontaneous miscarriages (Figure 19, Table 4).
Area under the curve (GSH-Px, SOD and TAS).
| Test result variable(s) | Area | Std. errora | Asymptotic sig.b | Asymptotic 95% confidence interval | |
|---|---|---|---|---|---|
| Lower bound | Upper bound | ||||
| GSH-Px | 0.818 | 0.045 | 0.000 | 0.729 | 0.907 |
| SOD | 0.822 | 0.046 | 0.000 | 0.731 | 0.913 |
| TAS | 0.259 | 0.058 | 0.000 | 0.146 | 0.373 |
GSH-Px, glutathione peroxidase; SOD, superoxide dismutase; TAS, total antioxidant status. The test result variable(s): SOD and TAS have at least one tie between the positive actual state group and the negative actual state group. Statistics may be biased. aUnder the nonparametric assumption. bNull hypothesis: true area=0.5.
Figures 20–23 show the interactive dot diagrams for Mg, PAPP-A and β-hCG values in the study and control groups, and the ROC curves for Mg, PAPP-A and β-hCG values. The results indicate that the Mg value cutoff level at ≤0.81 had a sensitivity of 80% and a specificity of 68.6%, and a positive likelihood ratio of 53.005 in the detection of women with recurrent miscarriages (Figure 20). The results indicate that the PAPP-A value cutoff level at ≤2.066 had a sensitivity of 93.3% and a specificity of 20%, and a positive likelihood ratio of 116.723 in the detection of women with recurrent miscarriages (Figure 21). The results indicate that the β-hCG value cutoff level at ≥1.34 had a sensitivity of 93.3% and a specificity of 20%, and a positive likelihood ratio of 122.268 in the detection of women with recurrent miscarriages (Figure 22).

Interactive dot diagram of Mg levels in the first trimester of pregnancy in the group of patients with calculated maximum sensitivity and specificity values.
Mg, magnesium concentration (mmol/L), group 0, patients with recurrent miscarriages, group 1, control group; Sens, sensitivity; spec, specificity.

Interactive dot diagram of PAPP-A levels in the first trimester of pregnancy in the group of patients with calculated maximum sensitivity and specificity values.
PAPP-A, pregnancy-associated plasma protein A (CorMom); group 0, patients with recurrent miscarriages; group 1, control group; Sens, sensitivity; spec, specificity.

Interactive dot diagram of β-hCG levels in the first trimester of pregnancy in the group of patients with calculated maximum sensitivity and specificity values.
β-hCG, β-subunit of human chorionic gonadotropin (CorMom); group 0, patients with recurrent miscarriages; group 1, control group; Sens, sensitivity; spec, specificity.

ROC curves of the serum concentrations of Mg, PAPP-A and β-hCG in the first trimester of pregnancy as early markers in the prediction of recurrent miscarriages.
Mg conc., magnesium concentration; PAPP-A, pregnancy-associated plasma protein A; β-hCG, β-subunit of human chorionic gonadotropin.
ROC analysis showed that the highest diagnostic accuracy was detected for Mg (AUC 0.197, p<0.001). PAPP-A and β-hCG did not show statistically significant diagnostic accuracy in the detection of spontaneous miscarriages (Figure 23, Table 5).
Area under the curve (Mg, PAPP-A and β-hCG).
| Test result variable(s) | Area | Std. errora | Asymptotic sig.b | Asymptotic 95% confidence interval | |
|---|---|---|---|---|---|
| Lower bound | Upper bound | ||||
| Mg conc. | 0.197 | 0.048 | 0.000 | 0.103 | 0.291 |
| PAPP-A | 0.510 | 0.065 | 0.868 | 0.383 | 0.637 |
| β-hCG | 0.565 | 0.065 | 0.292 | 0.437 | 0.693 |
β-hCG, beta human chorionic gonadotropin; Mg conc., magnesium concentration; PAPP-A, pregnancy-associated plasma protein A. The test result variable(s): Mg conc., PAPP-A and β-hCG have at least one tie between the positive actual state group and the negative actual state group. Statistics may be biased. aUnder the nonparametric assumption. bNull hypothesis: true area=0.5.
Discussion
Controlled increase in OS physiologically encompasses all the phases of pregnancy, from the implantation of a fertilized egg through the control mechanisms that prevent the rejection of the concept generated by increased levels of the circulating markers of lipid peroxidation accompanied by increased levels of antioxidants, which remain present throughout pregnancy [2], [38]. But, physiological pregnancy is a state of increased OS, which is certainly significantly increased in the pathological conditions in pregnancy. In the first trimester, the levels of antioxidant defense vary greatly in each individual case and depend on different factors such as BMI, age and living conditions [39].
The results of our study indicate that a statistically significant increase in both the most important antioxidant enzymes SOD-1 and GSH-Px in the group of patients with recurrent spontaneous abortions speaks in favor of the mobilization of antioxidant defense, and it is an indicator of increased OS in this group of pregnant women. BMI, patient’s age and living conditions between the study and control groups excluded the impact of these factors on the antioxidant status.
Our results are consistent with other studies [40], [41], [42] and indicate that in patients with spontaneous abortions, the entire antioxidant system is at a lower level compared to women who did not have miscarriages. This information was derived from the significantly lower levels of TAS in the study group. TAS is a complex parameter of antioxidant status, which, despite the enzyme activity of SOD-1 and GSH-Px, includes a number of other components, such as other enzymes (catalase), cellular antioxidants (acidum uricum and bilirubin) and non-enzymatic antioxidants (vitamins C and E, coenzyme Q) [8], [40]. In addition, pregnant women in the study group had a significantly higher incidence of miscarriages and premature births in the current pregnancy compared to the control group. In the study subgroups with poor pregnancy outcome (miscarriages and premature birth), there was a tendency for higher values of SOD and GSH-Px in relation to the values obtained in the subgroup with normal pregnancy outcome, while TAS values were lower in the subgroups with poor pregnancy outcome. In relation to the antioxidant status of the study group, the antioxidant capacity decreased and OS increased as the duration of pregnancy was shorter, and the outcome was worse. This points to a reduced ability of antioxidant defense in the second half of pregnancy in women with previous abortions and justifies the need for frequent monitoring of these patients in the second and third trimesters of pregnancy with the initiation of dietary and antioxidant treatments [20], [40].
All the mechanisms by which the elevated levels of SOD-1 influence the delicate redox balance in the first trimester of pregnancy are insufficiently clear. It is very likely that the role of SOD-1 may be strict protection but does not exclude the possibility of a simultaneous regulatory function, and it all depends on the mechanisms that lead to the induction of the synthesis of the enzyme. In their study, Frendo et al. [43] raised the claim that just an elevated level of SOD-1 in T21 cells of cytotrophoblasts has a negative impact on the differentiation of cytotrophoblasts and that it is a regulatory factor that affects the rejection of the genetically altered concept [43]. As increased OS may be one of the triggers of the induction of the synthesis of the first enzyme of antioxidant defense and as we got a lower total antioxidant capacity in our study, it is more likely that the role of SOD-1 is protective.
Our results indicate that the β-hCG value cutoff level at ≥1.34 had a sensitivity of 93.3% and a specificity of 20%, and a positive likelihood ratio of 122.268 in the detection of women with recurrent miscarriages. In the study by Lo et al. [44], the β-hCG cut-off point was 18,000 mIU/mL (sensitivity=74.5%, specificity=68.4%). Using logistic regression, they found that progesterone and β-hCG were useful to predict miscarriages during the first trimester of pregnancy [44]. In the study by Ajayi et al. [45], they showed that there was no statistically significant difference in the concentration of serum Mg between pregnant women with and without miscarriages [45]. In our study, there were statistically significant differences in the level of Mg between the subgroups with miscarriages and term delivery (p=0.033); and between the subgroups with term and preterm delivery (p<0.001). The results indicate that the Mg value cutoff level at ≤0.81 had a sensitivity of 80% and a specificity of 68.6%, and a positive likelihood ratio of 53.005 in the detection of women with recurrent miscarriages.
Three earlier studies with 236 women analyzed PAPP-A to predict miscarriage [34], [35], [36]. PAPP-A had a poor and wide sensitivity that ranged from 25 to 64% but a high specificity ranging from 88 to 94%. Westergaard et al. were the first to evaluate PAPP-A in the prediction of pregnancy outcome in women presenting with a threatened miscarriage. They concluded that PAPP-A measurement might be useful in differentiating pregnancies that will have a normal outcome from those that will not [37]. Our results showed that the values of PAPP-A were not significantly different in the study group compared to the values in the control group (p<0.969). Also, there were no statistically significant differences in the level of PAPP-A between the subgroups. The results indicate that the PAPP-A value cutoff level at ≤2.066 had a sensitivity of 93.3% and a specificity of 20%, and a positive likelihood ratio of 116.723 in the detection of women with recurrent miscarriages.
Detailed recommendations for practical use in the care of pregnant women with risk of spontaneous miscarriages were not standardized. The role of OS during pregnancy and in adverse pregnancy outcomes has a basis in pathophysiology, although the role of OS and the treatment of OS during or before pregnancy remain speculative. Antioxidant defense involves several strategies, both enzymatic and non-enzymatic. In the lipid phase, tocopherols and carotenes as well as oxy-carotenoids are of interest, as are vitamin A and ubiquinol. Overall, these low molecular mass antioxidant molecules add significantly to the defense provided by the enzymes SOD-1, catalase and GSH-Pxs.
They should include supplements with some antioxidants such as vitamin C, vitamin E, Zn, Mn, melatonin, etc.
Vitamin E was found to be most effective in restoring the inherent antioxidant system. Thus vitamin E can be given as a nutritional supplement for scavenging free radicals generated in order to reduce OS.
Melatonin has the ability to directly neutralize a number of free radicals and reactive oxygen and nitrogen species, and it stimulates several antioxidative enzymes which increase its efficiency as an antioxidant.
Conclusions
The results of our study indicate increased levels of OS in pregnant women with previous miscarriages, as well as the exhaustion of the antioxidant protection system that may be one of the reasons for the poor pregnancy outcome in the current study groups. Also, lower values of serum Mg concentration could be a marker for the prediction of spontaneous miscarriages. The results of this study justify the need for increased control in pregnant women in the second and third trimesters of pregnancy.
This could be just the beginning of our research of this complex topic that should be upgraded in the future with a larger number of respondents.
Author contributions: All the authors have accepted responsibility for the entire content of this submitted manuscript and approved submission.
Research funding: None declared.
Employment or leadership: None declared.
Honorarium: None declared.
Competing interests: The funding organization(s) played no role in the study design; in the collection, analysis, and interpretation of data; in the writing of the report; or in the decision to submit the report for publication.
References
1. Halliwell B, Gutteridge JM. Free radicals in biology and medicine, 3rd ed. New York: Oxford University Press Inc, 1999.Suche in Google Scholar
2. Jakovljević B, Novakov-Mikić A, Brkić S, Bogavac M, Tomić S, Miler V. Lipid peroxidation in the first trimester of pregnancy. J Matern-Fetal Neo M 2012;25:1316–8.10.3109/14767058.2011.632038Suche in Google Scholar
3. Kashinakunti SV, Sunitha H, Gurupadappa K, Shankarprasad DS, Suryaprakash G, Ingin JB. Lipid peroxidation and antioxidant status in preeclampsia. Al Ameen J Med Sci 2010;3:38–41.Suche in Google Scholar
4. Đukić MM (ed.) Oksidativni stress- slobodniradikali, prooksidansi i antioksidansi [Oxidative stress-free radicals, prooxidants and antioxidants] (in Serbian). Beograd: Mono i Manjana, 2008.Suche in Google Scholar
5. Kambayashi Y, Tero-Kubota S, Yamamoto Y, Kato M, Nakano M, Yagi K, Ogino K. Formation of superoxide anion during ferrous ion-induced decomposition of linoleic acid hyperperoxide under aerobic conditions. J Biochem 2003;134:903–9.10.1093/jb/mvg217Suche in Google Scholar
6. Bogavac M, Lakić N, Simin N, Nikolić A, Suđi J, Božin B. Bacterial vaginosis and biomarkers of oxidative stress in amniotic fluid. J Matern-Fetal Neo M 2012;25:1050–4.10.3109/14767058.2011.614660Suche in Google Scholar
7. Ruder EH, Hartman TJ, Goldman MB. Impact of oxidative stress on female fertility. Curr Opin Obstet Gynecol 2009;21:219–2.10.1097/GCO.0b013e32832924baSuche in Google Scholar
8. AL-Guborya KH, Fowlerb PA, Garrelc C. The roles of cellular reactive oxygen species, oxidative stress and antioxidants in pregnancy outcomes. Int J Biochem Cell Biol 2010;42:1634–50.10.1016/j.biocel.2010.06.001Suche in Google Scholar
9. Koruk M, Taysi S, CemilSavas M, Yilmaz O, Akcay F, Karakok M. Oxidative stress and enzymatic antioxidant status in patients with nonalcoholic steatohepatitis. Ann Clin Lab Sci 2004;34:57–62.Suche in Google Scholar
10. Suresh DR, Vamseedhar A, Pratibha K, Maruti P. Total antioxidant capacity – a novel early bio-chemical marker of oxidative stress in HIV infected individuals. J Biomed Sci 2009;16:61–64.10.1186/1423-0127-16-61Suche in Google Scholar
11. Jauniaux E, Watson AL, Hempstock J, Bao YP, Skepper JN, Burton GJ. Onset of maternal arterial blood flow and placental oxidative stress. A possible factor in human early pregnancy failure. Am J Pathol 2000;157:2111–22.10.1016/S0002-9440(10)64849-3Suche in Google Scholar
12. Sajal G, Ashok A, Jashoman B, Juan AG. The role of oxidative stress in spontaneous abortion and recurrent pregnancy loss: a systematic review. Obstet Gynecol Surv 2007;62:335–47.10.1097/01.ogx.0000261644.89300.dfSuche in Google Scholar PubMed
13. Chamy VM, Lepe J, Catalan A, Retamal D, Escobar JA, Madrid EM. Oxidative stress is closely related to clinical severity of preeclampsia. Biol Res 2006;39:229–36.10.4067/S0716-97602006000200005Suche in Google Scholar PubMed
14. Palmieri B, Sblendorio V. Oxidative stress tests: overview on reliability and use. Part II. Eur Rev Med Pharmacol Sci 2007;11:383–99.Suche in Google Scholar
15. Perrone S, Bellieni CV, Centini G, Kenanidis A, De Marco L, Petraglia F, et al. Early oxidative stress in amniotic fluid of pregnancies with Down syndrome. Clin Biochem 2007;40: 177–80.10.1016/j.clinbiochem.2006.10.019Suche in Google Scholar PubMed
16. Gupta S, Malhotra N, Sharma D, Chandra A, Ashok A. Oxidative stress and role in female infertility and assisted reproduction: clinical implications. Int J Fertil Steril 2009;2:147–64.Suche in Google Scholar
17. Shamsi MB, Venkatesh S, Pathak D, Deka D, Dada R. Sperm DNA damage and oxidative stress in recurrent spontaneous abortion (RSA). Indian J Med Res 2011;133:550–1.Suche in Google Scholar
18. Micle O, Muresan M, Antal L, Bodog F, Bodog A. The influence of homocysteine and oxidative stress on pregnancy outcome. J Med Life 2012;5:68–73.Suche in Google Scholar
19. Rai R, Regan L. Recurrent miscarriage. Lancet 2006;368:601–11.10.1002/9780470753354.ch13Suche in Google Scholar
20. Hempstock J, Jauniaux J, Greenwold N, Burton GJ. The contribution of placental oxidative stress to early pregnancy failure. Hum Pathol 2003;34:1265–75.10.1016/j.humpath.2003.08.006Suche in Google Scholar
21. Bogavac M, Lakic N, Simin N, Nikolic A, Sudji J, Bozin B. Biomarkers of oxidative stress in amniotic fluid and complications in pregnancy. J Matern Fetal Neonatal Med 2012;25:104–8.10.3109/14767058.2011.560625Suche in Google Scholar
22. Bogavac M, Jakovljević A, Stajić Z, Nikolić A, Milošević-Tošić M, Dejanović J, et al. Preeclampsia and level of oxidative stress in the first trimester of pregnancy. Vojnosanit Pregl 2017;74:633–638.10.2298/VSP150517251BSuche in Google Scholar
23. Schlegel RN, Cuffe JS, Moritz KM, Paravicini TM. Maternal hypomagnesemia causes placental abnormalities and fetal and postnatal mortality. Placenta 2015;36:750–8.10.1016/j.placenta.2015.03.011Suche in Google Scholar
24. Lumley J. Defining the problem: the epidemiology of preterm birth. BJOG 2003;110(Suppl 20):3–7.10.1016/S1470-0328(03)00011-9Suche in Google Scholar
25. Gupta A, Rao AA, Gorantla VR. Study of serum magnesium levels in preterm labour. Int J Innov Res Dev 2014;3:62–7.Suche in Google Scholar
26. Lotfalizadeh M, Ghomian N, Dadgar S, Halimi F. Maternal magnesium level effect on preterm labor treatment. IJWHRS 2018;6:55–9.10.15296/ijwhr.2018.10Suche in Google Scholar
27. Jauniaux E, Farquharson RG, Christiansen OB, Exalto N. Evidence-based guidelines for the investigation and medical treatment of recurrent miscarriage. Hum Reprod 2006;21: 2216–22.10.1093/humrep/del150Suche in Google Scholar PubMed
28. Hasan R, Baird DD, Herring AH, Olshan AF, Jonsson Funk ML, Hartmann KE. Association between first-trimester vaginal bleeding and miscarriage. Obstet Gynecol 2009;114:860–7.10.1097/AOG.0b013e3181b79796Suche in Google Scholar PubMed PubMed Central
29. Kadar N, Caldwell BV, Romero R. A method of screening for ectopic pregnancy and its indications. Obstet Gynecol 1981;58:162–6.Suche in Google Scholar
30. Miller D. Assessment and management of miscarriage. N Z Med J 2008;35:P202–6.Suche in Google Scholar
31. Konrad G. First-trimester bleeding with falling hCG: don’t assume miscarriage. Can Fam Physician 2007;53:831–2.Suche in Google Scholar
32. Luisi S, Florio P, D’Antona D, Severi FM, Sanseverino F, Danero S, et al. Maternal serum inhibin A levels are a marker of a viable trophoblast in incomplete and complete miscarriage. Eur J Endocrinol 2003;148:233–6.10.1530/eje.0.1480233Suche in Google Scholar PubMed
33. Qureshi NS, Edi-Osagie EC, Ogbo V, Ray S, Hopkins RE. First trimester threatened miscarriage treatment with human chorionic gonadotrophins: a randomised controlled trial. Br J Obstet Gynaecol 2005:112:1536–41.10.1111/j.1471-0528.2005.00750.xSuche in Google Scholar
34. Westergaard JG, Teisner B, Sinosich MJ, Madsen LT, Grudzinskas JG. Does ultrasound examination render biochemical tests obsolete in the prediction of early pregnancy failure? BJOG 1985;92:77–83.10.1111/j.1471-0528.1985.tb01052.xSuche in Google Scholar
35. Ruge S, Pedersen JF, SøSrensen S, Lange AP. Can pregnancy-associated plasma protein A (PAPP-A) predict the outcome of pregnancy in women with threatened abortion and confirmed fetal viability? Acta Obstet Gynecol Scand 1990;69:589–95.10.3109/00016349009028701Suche in Google Scholar
36. Hanita O, Roslina O, Azlin MN. Maternal level of pregnancy-associated plasma protein A as a predictor of pregnancy failure in threatened abortion. Malays J Pathol 2012;34:145.Suche in Google Scholar
37. Westergaard JG, Sinosich MJ, Bugge M, Madsen LT, Teisner B, Grudzinskas JG. Pregnancy-associated plasma protein A in the prediction of early pregnancy failure. Am J Obstet Gynecol 1983;145:67–9.10.1016/0002-9378(83)90341-1Suche in Google Scholar
38. Chappell LC, Seed PT, Briley A, Kelly F, Hunt BJ, Charnock JS, et al. A longitudinal study of biochemical variables in women at risk of preeclampsia. Am J Obstet Gynecol 2002;187:127–36.10.1067/mob.2002.122969Suche in Google Scholar PubMed
39. Djordjevic A, Spasic S, Jovanovic-Galovic A, Djordjevic R, Grubor-Lajsic G. Oxidative stress in diabetic pregnancy: SOD, CAT and GSH-Px activity and lipid peroxidation products. J Matern-Fetal Neo M 2004;16:367–72.10.1080/jmf.16.6.367.372Suche in Google Scholar
40. Patil SB, Kodliwadmath MV, Kodliwadmath SM. Lipid peroxidation and nonenzymatic antioxidants in normal pregnancy. J ObstetGynecol India 2006;56:399–401.Suche in Google Scholar
41. Burton GJ, Jauniaux E. Placental oxidative stress: from miscarriage to preeclampsia. J Soc Gynecol Investig 2004;11:342–52.10.1016/j.jsgi.2004.03.003Suche in Google Scholar PubMed
42. Burton GJ, Jauniaux E. Oxidative stress. Best Pract Res Cl Ob 2011;25:287–99.10.1016/j.bpobgyn.2010.10.016Suche in Google Scholar PubMed PubMed Central
43. Frendo JL, Therond P, Bird T, Massin N, Muller F, Guibourdenche J, et al. Overexpression of copper zinc superoxide dismutase impairs human trophoblast cell fusion and differentiation. Endocrinology 2001;142:3638–48.10.1210/endo.142.8.8329Suche in Google Scholar PubMed
44. Lo E, Rajuddin R. The accuracy of single progesterone, single β-hCG, and their combination measurement in predicting early miscarriage: a prospective study in outpatient setting. KnE Medicine 2016;1:99–106.Suche in Google Scholar
45. Ajayi OO, Charles-Davies MA, Arinola OG. Progesterone, selected heavy metals and micronutrients in pregnant Nigerian women with a history of recurrent spontaneous abortion. Afr Health Sci 2012;12:153–9.10.4314/ahs.v12i2.12Suche in Google Scholar PubMed PubMed Central
©2019 Walter de Gruyter GmbH, Berlin/Boston
This article is distributed under the terms of the Creative Commons Attribution Non-Commercial License, which permits unrestricted non-commercial use, distribution, and reproduction in any medium, provided the original work is properly cited.
Artikel in diesem Heft
- Frontmatter
- Infectiology and Microbiology
- Seroprevalence and geographical distribution of hepatitis C virus in Iranian patients with thalassemia: a systematic review and meta-analysis
- Geriatric Laboratory
- White blood cell counts, CRP, GGT and LDH in the elderly German population
- Laboratory Management
- Pre-analytical quality control in hemostasis laboratories: visual evaluation of hemolysis index alone may cause unnecessary sample rejection
- Endocrinology
- Direct laboratory evidence that pregnancy-induced hypertension might be associated with increased catecholamines and decreased renalase concentrations in the umbilical cord and mother’s blood
- Allergy and Autoimmunity
- Investigating the presence of human anti-mouse antibodies (HAMA) in the blood of laboratory animal care workers
- Original Articles
- Lipid indexes and parameters of lipid peroxidation during physiological pregnancy
- Biomarkers of oxidative stress in pregnant women with recurrent miscarriages
- Effects of sleeve gastrectomy on liver enzymes, non-alcoholic fatty liver disease-related fibrosis and steatosis scores in morbidly obese patients: first year follow-up
- Laboratory Case Report
- Neuroendocrine differentiation of prostatic adenocarcinoma – an important cause for castration-resistant disease recurrence