Risk factors for primary cesarean delivery in women with gestational diabetes mellitus: a predictive model for clinical risk assessment
-


Abstract
Objectives
Gestational diabetes mellitus (GDM) is associated with complications such as fetal macrosomia, shoulder dystocia, and prolonged labor, making cesarean section an important delivery option to reduce maternal and neonatal risks. This study aims to identify factors associated with cesarean delivery in women with GDM and to develop a predictive model for clinical risk assessment.
Methods
This retrospective cross-sectional study included 2,276 GDM patients who were delivered at a tertiary hospital from January 2020 to December 2023. Data on age, BMI, gravidity, abortion history, and family history of diabetes were collected. Patients were grouped by delivery mode. ANOVA/Kruskal-Wallis, chi-square test, Pearson correlation, and stepwise logistic regression were used to identify independent predictors. Two prediction models were developed and evaluated using ROC curves.
Results
Among all included GDM patients, 200 (8.79 %) underwent cesarean section. The average age and BMI were 30.8 ± 3.9 years and 23.658 ± 4.221, respectively. Cesarean section rates increased with rising BMI (p<0.05). Significant differences among BMI groups were observed in age, number of pregnancies, miscarriage history, family history of diabetes, HbA1c, hemoglobin (HGB), and platelet count (PLT) (all p<0.05). BMI was correlated with adjusted BMI, HbA1c, HGB, and PLT. Logistic regression identified six independent predictors of cesarean section: BMI, adjusted BMI, HGB, PLT, prothrombin time (PT), and D-dimer. Model one showed good predictive ability (AUC=0.792). After optimization, Model two (including BMI grouping, number of miscarriages, and HbA1c) performed better (AUC=0.842).
Conclusions
A multi-parameter model demonstrates strong potential for predicting cesarean risk in GDM patients and may assist clinical decision-making.
Introduction
Gestational diabetes mellitus (GDM) is a transient glucose intolerance that typically occurs in the second or third trimester of pregnancy, particularly between 24 and 28 weeks of gestation [1], 2]. The pathophysiology involves increased insulin resistance due to the placental secretion of various anti-insulin hormones – such as human placental lactogen, cortisol, and estrogen – coupled with an inadequate compensatory insulin response [3], [4], [5]. This imbalance ultimately leads to hyperglycemia and the onset of GDM. Studies have shown that women with a history of GDM face an approximately 50 % risk of developing type 2 diabetes within 10 years postpartum [6], 7]. Although GDM is temporary, its long-term health implications necessitate early clinical intervention and continuous postpartum follow-up.
Clinical and epidemiological studies have identified GDM as a significant independent risk factor for cesarean section [8]. In a retrospective cohort study, the cesarean section rate was 54.5 % in the GDM group and 41.5 % in the control group, with a statistically significant difference between the two groups (p=0.002) [9]. Similarly, American College of Obstetricians and Gynecologists (ACOG) data suggest that GDM independently predicts higher cesarean delivery rates [10]. Research published in The Lancet Diabetes & Endocrinology further demonstrated that GDM remains associated with increased cesarean rates even after adjusting for fetal weight, suggesting the involvement of additional factors such as metabolic abnormalities or dysfunctional uterine contractility [11].
A constellation of clinical factors influences the decision for cesarean delivery in GDM pregnancies. Among these, maternal body mass index (BMI) is strongly associated with increased cesarean risk, with overweight and obese women being more prone to complications such as macrosomia or cephalopelvic disproportion [12]. Other significant contributors include advanced maternal age, nulliparity, previous cesarean section, and a history of multiple miscarriages [12], 13]. Furthermore, poor glycemic control, gestational hypertension, polyhydramnios, abnormal fetal presentation, and estimated fetal macrosomia are also recognized as relevant clinical risk factors [14], 15]. Regarding laboratory findings, hematological and coagulation parameters – such as HGB, PLT, and D-dimer levels – have been explored as auxiliary predictive markers. In addition to physiological and clinical variables, psychosocial factors, including maternal preference, physician recommendation, and access to obstetric care, may also influence the mode of delivery.
Given the multifactorial nature of cesarean section decisions in GDM, constructing a comprehensive predictive model incorporating demographic, clinical, and laboratory data may aid in the early identification of high-risk patients and improve perinatal management strategies [16], 17].
This study aims to identify the determinants associated with cesarean section among women with GDM and to establish a predictive model for clinical use. By retrospectively analyzing baseline data – including maternal age, BMI, parity, abortion history, and family history of diabetes – alongside third-trimester laboratory parameters such as HbA1c, HGB, white blood cell (WBC) count (WBC), PLT, prothrombin time (PT), activated partial thromboplastin time (APTT), fibrinogen (FIB), and D-dimer, we seek to evaluate the relationship between these variables and cesarean delivery. Our findings may contribute to the early detection and individualized management of high-risk GDM pregnancies and offer valuable insights for clinical application.
Materials and methods
Inclusion of GDM patients
A total of 2,276 patients diagnosed with gestational diabetes mellitus (GDM) who received obstetric care at the Second Hospital of Hebei Medical University, Shijiazhuang Obstetrics and Gynecology Hospital, Tangshan Maternal and Child Health Hospital, Maternity and Child Care Center of Qinhuangdao, between 2022 and 2024 were included in this study. All participants provided written informed consent for both cesarean and vaginal deliveries. As this was a retrospective study, no additional informed consent was required. The study protocol was reviewed and approved by the Ethics Committee of the Second Hospital of Hebei Medical University (Reference number: 2021-R231).
Diagnostic criteria for GDM
The diagnosis of GDM was based on the 2020 guidelines issued by the Obstetrics and Gynecology Branch of the Chinese Medical Association. All participants underwent a 75 g oral glucose tolerance test (OGTT) between 24 and 28 weeks of gestation, with plasma glucose levels measured at fasting, 1 h, and 2 h post-ingestion. A diagnosis of GDM was made if any one of the following thresholds was met or exceeded: (1) Fasting plasma glucose (FPG) ≥ 5.1 mmol/L; (2) 1-h post-glucose ≥ 10.0 mmol/L; (3) 2-h post-glucose ≥ 8.5 mmol/L.
Inclusion and exclusion criteria
Inclusion criteria
(1) A positive OGTT result between 24 and 28 weeks of gestation; (2) Singleton pregnancy with no significant fetal structural abnormalities; (3) Complete prenatal and delivery records, including blood glucose monitoring, fetal assessments, and mode of delivery; (4) Maternal age between 18 and 45 years; (5) Indications for cesarean section were met.
Exclusion criteria
(1) Pre-existing diabetes diagnosed before pregnancy; (2) Presence of metabolic disorders, malignancies, or other severe maternal complications; (3) Miscarriage or elective termination during mid-to-late pregnancy, and patients who opted for cesarean section by personal choice (non-medical indications); (4) Patients with a history of cesarean section.
Clinical and laboratory measurements
Pre-pregnancy BMI was categorized into four groups based on standards for the Chinese population: underweight (BMI<18.5), normal weight (BMI 18.5–24.0), overweight (BMI 24.0–28.0), and obese (BMI>28.0). Baseline data included maternal age, pre- and post-pregnancy BMI, gravidity, number of previous miscarriages, and family history of diabetes. In addition, routine hematological and coagulation parameters were recorded for statistical analysis.
Statistical analysis
All data were processed and analyzed using SPSS version 25.0 and MedCalc software. Categorical variables were presented as frequencies and percentages and compared between groups using the chi-square test. Continuous variables were presented as mean±standard deviation for normally distributed data or median with interquartile range (25th, 75th percentiles) for non-normally distributed data. Analysis of variance (ANOVA) was used to compare normally distributed continuous variables across multiple groups, while the Kruskal–Wallis H test was used for non-normally distributed data. Pearson correlation analysis was performed to assess relationships between continuous variables. Logistic regression analysis was used to conduct univariate and multivariate analyses of potential influencing factors. Associations were expressed as odds ratios (ORs) with corresponding 95 % confidence intervals (CIs). A p-value of < 0.05 was considered statistically significant.
Results
Baseline characteristics of patients
A total of 2,276 GDM patients were included in this study from the Department of Obstetrics and Gynecology of the Second Hospital of Hebei Medical University, Shijiazhuang Obstetrics and Gynecology Hospital, Tangshan Maternal and Child Health Hospital, Maternity and Child Care Center of Qinhuangdao. Among them, 200 patients (8.79 %) underwent cesarean section. The overall mean age of the GDM cohort was 30.8±3.9 years, and the mean BMI was 23.658±4.221. The number of pregnancies ranged from one to 9, with a median of 2.0 (1.0, 3.0), and the number of abortions ranged from 0 to 6. 412 patients (18.10 %) had a family history of diabetes mellitus (Table 1).
Baseline characteristics of patients in different BMI (kg/m2) range groups.
| Indicators | Groups | <18.5 (n=154, %) | 18.5–24.0 (n=1,249) | 24.0–28.0 (n=522) | >28.0 (n=351) | F/χ² | p-Value |
|---|---|---|---|---|---|---|---|
| Age, years | 29.78 ± 3.84b,c,d | 30.76 ± 3.74a,c | 31.44 ± 3.87a,b,d | 30.62 ± 4.40a,c | 8.565 | <0.001 | |
| C-section | Yes | 3 (1.95) | 72 (5.77) | 42 (8.00) | 90 (23.43) | 124.050 | <0.001 |
| No | 151 (98.05) | 1,175 (94.23) | 483 (92.00) | 294 (76.57) | |||
| BMI, kg/m2 | 17.783 ± 0.611b,c,d | 21.382 ± 1.499a,c,d | 25.583 ± 1.639a,b,d | 31.271 ± 2.971a,b,c | 3,797.422 | <0.001 | |
| Adjusted BMI | 5.164 ± 1.862c,d | 5.130 ± 1.859c,d | 4.483 ± 2.033a,b,d | 3.970 ± 2.374a,b,c | 37.816 | <0.001 | |
| Gravida | 1.99 ± 1.03c | 2.09 ± 1.08c | 2.31 ± 1.20a,b | 2.20 ± 1.27a | 5.858 | 0.001 | |
| Abortion, times | 0.46 ± 0.56b,c,d | 0.58 ± 0.60a,c | 0.69 ± 0.65a,b | 0.65 ± 0.80a | 6.538 | <0.001 | |
| Diabetes FH | Yes | 29 (18.83) | 202 (16.17) | 115 (22.03) | 69 (19.66) | 9.120 | 0.028 |
| No | 125 (81.17) | 1,047 (83.83) | 407 (77.97) | 282 (80.34) | |||
| HbA1c, % | 5.314 ± 0.375c,d | 5.443 ± 1.307d | 5.498 ± 0.361a | 5.579 ± 0.454a,b | 3.041 | 0.028 | |
| WBC, × 109/L | 9.624 ± 2.540 | 9.881 ± 4.463 | 10.184 ± 8.361 | 10.026 ± 2.486 | 0.526 | 0.664 | |
| HGB, g/dL | 122.268 ± 9.556 | 123.278 ± 12.609d | 123.684 ± 13.625d | 119.849 ± 13.570b,c | 6.844 | <0.001 | |
| PLT, × 109/L | 196.339 ± 49.625c,d | 195.072 ± 46.469c,d | 207.196 ± 49.153a,b,d | 222.268 ± 53.035a,b,c | 28.015 | <0.001 | |
| PT, s | 11.6 (11.100, 12.0) | 11.7 (11.2, 12.1) | 11.700 ± 0.986 | 11.4 (10.6, 12.1) | 0.838 | 0.473 | |
| APTT, s | 31.1 (28.95, 33.2) | 31.347 ± 4.268 | 30.994 ± 2.987 | 30.0 (28.2, 32.3) | 1.439 | 0.230 | |
| Fib, mg/dL | 4.364 ± 2.311 | 5.200 ± 21.468 | 5.610 ± 24.064 | 4.512 ± 0.850 | 0.257 | 0.856 | |
| D-dimer, ng/mL | 395.5 (2.5, 700.0) | 438.0 (3.1, 748.0) | 425.0 (2.7, 662.0) | 443.0 (223.0, 849.0) | 3.686 | 0.297 |
-
BMI, body mass index; FH, family history; HbA1c, hemoglobin A1c; WBC, white blood cell; PLT, platelet; PT, prothrombin time; APTT, activated partial thromboplastin time; FIB, fibrinogen; aBMI<18.5 kg/m2group; bBMI, 18.5–24.0; cBMI, 24.0–28.0; dBMI>28.0. a,b,c,dIndicate statistically significant differences in pairwise comparisons between the corresponding BMI, groups (p<0.05). The bold p-value indicates a statistically significant difference between the groups.
Baseline characteristics stratified by BMI
Based on BMI classification, 154 patients (6.77 %) were underweight (BMI<18.5), with a mean age of 29.78±3.84 years; 1,249 patients (54.88 %) were in the normal weight group (BMI 18.5–24.0), mean age 30.76±3.74 years; 522 patients (22.93 %) were overweight (BMI 24.0–28.0), mean age 31.44±3.87 years; and 351 patients (15.42 %) were obese (BMI>28.0), mean age 30.62±4.40 years. The differences in age across the four groups were statistically significant (p<0.05), with details shown in Table 1 and Figure 1.
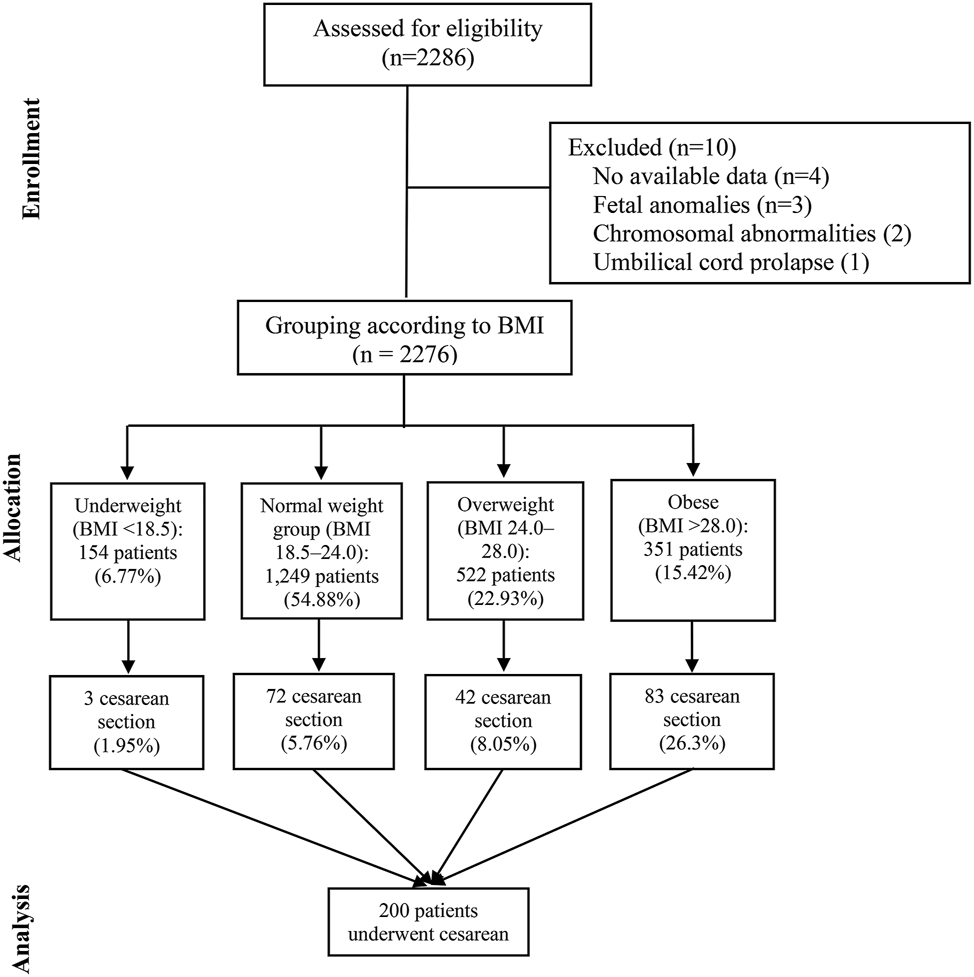
Flow diagram of patient numbers by BMI category.
Analysis of BMI change (delivery BMI minus pre-pregnancy BMI) also revealed a statistically significant difference among groups (p<0.001). The proportion of cesarean section increased with rising BMI, showing a significant upward trend across the four groups (p<0.05): 3 cases (1.95 %) in the underweight group, 72 (5.76 %) in the normal group, 42 (8.69 %) in the overweight group, and 90 (25.64 %) in the obese group.
In addition, statistically significant differences were found among BMI groups in adjusted BMI values (pre-vs. post-pregnancy), number of pregnancies, number of abortions, and family history of diabetes (all p<0.05).
Regarding laboratory findings, significant differences were observed across BMI groups in HbA1c (%), HGB (g/dL), and PLT ( × 109/L) (all p<0.05). However, no significant difference was found in the WBC ( × 109/L) count (p=0.664). Furthermore, no significant differences were observed among the four groups in coagulation indicators (all p>0.05), as detailed in Table 1.
Correlation analysis among variables
Pearson correlation analysis was used to assess linear relationships between continuous variables. BMI showed significant correlations with adjusted BMI, HbA1c, HGB, and PLT (all p<0.05). However, no strong collinearity was found among these variables, suggesting they are suitable for inclusion in subsequent regression models (Table 2).
The test results of the correlation analysis among continuous variable indicators.
| Indicators | Age | BMI | Adjusted BMI | HbA1c | WBC | HGB | PLT | PT | APTT | FIb | D-dimer, ng/mL |
|---|---|---|---|---|---|---|---|---|---|---|---|
| Age | 1 | ||||||||||
| BMI | 0.024 | 1 | |||||||||
| Adjusted BMI | −0.094b | −0.215b | 1 | ||||||||
| HbA1c | 0.005 | 0.073b | 0.006 | 1 | |||||||
| WBC | −0.066b | 0.029 | 0.051a | 0.009 | 1 | ||||||
| HGB | −0.026 | −0.052a | −0.014 | −0.008 | 0.317b | 1 | |||||
| PLT | −0.040 | 0.213b | 0.040 | 0.067b | 0.114b | 0.062b | 1 | ||||
| PT | −0.023 | −0.047 | −0.050a | −0.011 | 0.000 | −0.136b | −0.028 | 1 | |||
| APTT | 0.025 | −0.034 | −0.010 | 0.003 | −0.020 | 0.040 | −0.024 | 0.018 | 1 | ||
| FIb | −0.015 | −0.018 | −0.006 | 0.000 | 0.009 | 0.032 | 0.019 | −0.009 | 0.074b | 1 | |
| D-dimer, ng/mL | 0.048a | 0.031 | −0.017 | −0.005 | 0.022 | −0.116b | −0.032 | −0.011 | −0.010 | −0.006 | 1 |
-
ap<0.05; bp<0.01. The correlation analysis of continuous variables was conducted using the Pearson correlation method.
Regression analysis
A two-step approach was employed to identify factors influencing cesarean section. In step one, univariate logistic regression was used to screen potential variables, and those with p<0.10 were entered into the multivariate logistic regression model in step two.
In step one, 11 variables met the inclusion criteria. Detailed results are shown in Table 3. After including these variables in the multivariate logistic regression model, six variables were identified as independent risk factors for cesarean delivery (all p<0.05): BMI (categories 24.0–28.0 and >28.0), adjusted BMI, HGB, PLT, prothrombin time (PT), and D-dimer levels (D-Dug/mL) (Table 3).
Results of univariate and multivariate regression analysis.
| Detection indicators | Univariate regression | Multiple regression (Model 1) | Multiple regression (Model 2) | ||||||
|---|---|---|---|---|---|---|---|---|---|
| β | Or (95 % CI) | Sig. | β | Or (95 % CI) | Sig. | β | Or (95 % CI) | Sig. | |
| BMI | 1.126 | 3.084 (0.960, 9.910) | 0.059 | 1.162 | 3.169 (0.745, 13.720) | 0.118 | 1.066 | 2.905 (0.901, 9.364) | 0.074 |
| 1.485 | 4.413 (1.349, 14.442) | 0.014 | 1.757 | 5.796 (1.308, 25.683) | 0.021 | 1.381 | 3.979 (1.210, 13.086) | 0.023 | |
| 2.939 | 18.903 (5.865, 60.925) | <0.001 | 3.305 | 27.242 (6.229, 119.137) | <0.001 | 2.780 | 16.112 (4.966, 52.273) | <0.001 | |
| Abortion, times | −0.252 | 0.777 (0.609, 0.991) | 0.042 | −0.094 | 0.910 (0.692, 1.197) | 0.500 | −0.365 | 0.694 (0.540, 0.893) | 0.004 |
| HbA1c | 1.304 | 3.684 (2.558, 5.307) | <0.001 | 0.120 | 1.127 (0.992, 1.280) | 0.066 | 1.027 | 2.792 (1.909, 4.083) | <0.001 |
| Adjusted BMI | 0.092 | 1.096 (1.020, 1.178) | 0.012 | 0.158 | 1.172 (1.062, 1.292) | 0.002 | |||
| HGB | −0.031 | 0.970 (0.958, 0.982) | <0.001 | −0.017 | 0.983 (0.967, 0.999) | 0.034 | |||
| PLT | 0.008 | 1.008 (1.005, 1.011) | <0.001 | 0.004 | 1.004 (1.001, 1.008) | 0.026 | |||
| PT | −0.521 | 0.599 (0.496, 0.724) | <0.001 | −0.614 | 0.541 (0.423, 0.692) | <0.001 | |||
| APTT | −0.104 | 0.901 (0.853, 0.952) | <0.001 | −0.007 | 0.993 (0.968, 1.019) | 0.608 | |||
| D-dimer, ng/mL | <0.001 | 1.000 (1.000, 1.000) | 0.008 | <0.001 | 1.0 (1.0, 1.1) | 0.003 | |||
| Gravida | −0.014 | 0.986 (0.866, 1.123) | 0.834 | ||||||
| Diabetes FH | −0.037 | 0.963 (0.660, 1.405) | 0.846 | ||||||
| Age, years | −0.032 | 0.969, (0.933, 1,006) | 0.104 | ||||||
| WBC | 0.001 | 1.001 (0.973, 1.029) | 0.963 | ||||||
| FIb | −0.006 | 0.994 (0.964, 1.025) | 0.707 | ||||||
-
The bold p-value indicates a statistically significant difference between the groups.
Diagnostic performance of the predictive models
A predictive model (Model 1) was constructed using the six independent variables associated with cesarean section. The area under the ROC curve (AUC) of Model one was 0.792, with a sensitivity of 81.77 % and specificity of 71.00 %. However, the diagnostic performance was slightly lower than expected.
Clinical considerations were incorporated to improve the model, and a new model (Model 2) was established by including BMI category, abortions (times), and HbA1c levels. Model two achieved an improved AUC of 0.842, with a sensitivity of 85.50 % and specificity of 76.72 %. Although some individual indicators (e.g., HGB, with a specificity of 91.91 %) showed relatively high diagnostic value, none outperformed Model two in overall predictive ability (Table 4 and Figure 2).
Detailed information on the ROC curve.
| Parameters (systole) | AUC | SE | 95 % CI | Sensitivity, % | Specificity, % | Youden | AC | Z | p-Value |
|---|---|---|---|---|---|---|---|---|---|
| BMI, kg/m2 | 0.689 | 0.022 | 0.669 – 0.708 | 43.00 | 88.13 | 0.311 | >27.68 | 8.665 | <0.001 |
| Adjusted BMI | 0.544 | 0.023 | 0.523 – 0.565 | 44.00 | 70.61 | 0.146 | >5.87 | 1.876 | 0.061 |
| Abortion, times | 0.579 | 0.020 | 0.558 – 0.600 | 63.50 | 56.08 | 0.196 | – | 3.901 | 0.001 |
| PLT, × 109/L | 0.617 | 0.022 | 0.595 – 0.639 | 37.02 | 80.21 | 0.172 | >237 | 5.428 | <0.001 |
| HbA1c, % | 0.799 | 0.019 | 0.782 – 0.816 | 70.50 | 79.21 | 0.497 | >5.6 | 16.149 | <0.001 |
| HGB, g/L | 0.616 | 0.024 | 0.594 – 0.638 | 26.52 | 91.91 | 0.184 | ≤111 | 4.895 | <0.001 |
| PT | 0.646 | 0.026 | 0.622 – 0.670 | 47.85 | 78.21 | 0.261 | ≤11.1 | 5.722 | <0.001 |
| APTT | 0.604 | 0.024 | 0.579 – 0.628 | 54.60 | 65.44 | 0.200 | ≤30.1 | 4.287 | <0.001 |
| Model 1 | 0.813 | 0.017 | 0.795 – 0.830 | 81.77 | 71.00 | 0.528 | >0.078 | 18.604 | <0.001 |
| Model 2 | 0.842 | 0.014 | 0.826 – 0.857 | 85.50 | 76.72 | 0.622 | >0.082 | 24.845 | <0.001 |
-
AUC, area under curve; SE, standard error; AC, associated criterion; PLT, platelet. The bold p-value indicates a statistically significant difference between the groups.
![Figure 2:
Area under the curve (AUC) of the detection indicator. Model 1 [BMI + Abortion (times) + HbA1c + Adjusted BMI + HGB + PLT + PT + d-dug/mL]; Model 2 [BMI + Abortion (times) + HbA1c]. BMI, body mass index; HbA1c, hemoglobin A1c; PLT, platelet; PT, prothrombin time.](/document/doi/10.1515/jpm-2025-0245/asset/graphic/j_jpm-2025-0245_fig_002.jpg)
Area under the curve (AUC) of the detection indicator. Model 1 [BMI + Abortion (times) + HbA1c + Adjusted BMI + HGB + PLT + PT + d-dug/mL]; Model 2 [BMI + Abortion (times) + HbA1c]. BMI, body mass index; HbA1c, hemoglobin A1c; PLT, platelet; PT, prothrombin time.
Discussion
This study found that as BMI increased, the proportion of GDM patients delivered by cesarean section also increased. This suggests that higher BMI may be an independent factor influencing the decision for cesarean delivery in GDM patients. This finding is consistent with the research by Ehrenberg et al., who demonstrated that both obesity and diabetes independently increase the risk of cesarean section [18]. Furthermore, rapid weight gain during pregnancy is also considered a predictor of cesarean section [19]. Therefore, in GDM patients, controlling pre-pregnancy and gestational weight gain may help reduce the incidence of cesarean sections. However, it should be noted that high BMI may indirectly increase the risk of cesarean delivery through mechanisms such as affecting fetal weight and the progress of labor, and the specific mechanisms require further research [20], [21], [22].
In the blood routine tests of this study, significant differences in HbA1c, HGB, and PLT were observed across different BMI groups (all p<0.05), suggesting that these indicators may be involved in the metabolic and hemodynamic changes associated with high BMI. However, the direct relationship between these indicators and cesarean section remains unclear. Although some studies have shown that elevated HbA1c and D-dimer levels are associated with fetal growth restriction (FGR) in GDM patients, their direct relationship with cesarean section still needs further exploration. A study by Ying Zhang et al. [23]explored the relationship between HbA1c and D-dimer (D-D) levels and FGR in GDM patients. This retrospective analysis of clinical data from 164 GDM patients found that 63 had FGR and 101 had normal fetal weight. Their research found that HbA1c and D-D levels were significantly higher in the FGR group than in the normal group, suggesting that these two indicators are closely related to the occurrence of FGR. Furthermore, HbA1c levels above 5.80 % and D-D levels above 3.04 mg/L were considered effective thresholds for predicting FGR. This study showed that HbA1c levels>5.6 % were a turning point in influencing the choice of cesarean section, which is consistent with the findings of the aforementioned study.
GDM patients are often accompanied by elevated levels of inflammatory factors such as CRP, IL-6, and TNF-α, indicating a systemic inflammatory state [24]. White blood cell count (WBC), an important indicator reflecting immune and inflammatory status, tends to increase physiologically during pregnancy. However, in GDM patients, elevated WBC is more likely to reflect a potential chronic low-grade inflammatory state, which is considered closely related to the development of GDM and pregnancy complications [25], [26], [27]. In recent years, researchers have begun to focus on whether WBC levels can also serve as a potential biomarker for predicting the risk of cesarean section in GDM patients. However, research on the direct relationship between WBC and cesarean section in GDM patients is inconsistent [28]. Some studies did not observe significant statistical differences between WBC and delivery method, which may be related to sample size, dynamic changes in WBC during delivery, and GDM subtypes (e.g., whether insulin therapy is involved) [29]. Additionally, the metabolic characteristics of GDM (such as hyperglycemia and hyperinsulinemia) may induce systemic inflammation, but whether WBC levels fully reflect this inflammatory state remains controversial. In this study, no significant differences in WBC count or coagulation indicators were found across BMI groups, suggesting that inflammation may not be a major factor influencing cesarean section in the study population.
Regarding coagulation, the high insulin state in GDM patients may stimulate fibrinogen (FIB) synthesis and activate platelet aggregation, leading to a hypercoagulable state. Previous studies have shown that D-dimer levels are significantly higher in GDM patients than those with normal pregnancies, indicating endothelial dysfunction and hypercoagulability [30], 31]. Elevated D-dimer levels are not only associated with thrombotic events during pregnancy but are also considered an early sign of placental dysfunction and placental abruption, which may indirectly contribute to the indication for cesarean section. In this study, although the coagulation factors PT and D-Dimer were identified as independent factors influencing cesarean section, the diagnostic performance of these two indicators was limited (both AUC<0.70).
Through regression model analysis, this study identified BMI, adjusted BMI, HGB, PLT, PT, and D-dimer as independent predictors of cesarean section in GDM patients. These factors span multiple physiological dimensions, including metabolism, circulation, and coagulation, indicating that the decision for cesarean section in GDM patients is multifactorial. Although no collinearity was found among these factors in the model (all VIF values<5), there may still be interactions between them. For example, high BMI may indirectly increase the risk of cesarean section through its effect on hematological indicators, and the specific mechanisms require further study. While the predictive model constructed in this study performed well in sensitivity and specificity, its feasibility and practicality in clinical application need to be considered. This study highlights the potential value of BMI and related hematological indicators in predicting the risk of cesarean section in GDM patients, providing data support for personalized delivery planning.
However, it should be noted that as a retrospective study, this research has certain limitations, such as selection bias in sample size and data completeness, which may lead to bias in the results and conclusions. The data were collected from a single-center source, which could introduce a certain degree of bias. Therefore, multicenter collaboration would enhance the reliability of the model. Future research should adopt a prospective design and consider more potential confounding factors to validate the findings of this study. Additionally, the effects of interventions such as weight management and blood glucose control in reducing the risk of cesarean section in GDM patients should be explored.
-
Research ethics: The study protocol was reviewed and approved by the Ethics Committee of the Second Hospital of Hebei Medical University (Reference number: 2021-R231).
-
Informed consent: All participants provided written informed consent for both cesarean and vaginal deliveries. As this was a retrospective study, no additional informed consent was required.
-
Author contributions: ZLL and KHF conceived and designed the experiments. WF performed data acquisition. SY and CYQ analyzed the data. XH and ZLL wrote the paper. All authors read and approved the final manuscript.
-
Use of Large Language Models, AI and Machine Learning Tools: None declared.
-
Conflict of interest: The authors state no conflict of interest.
-
Research funding: This work was supported by the S&T Program of Hebei, 21377707D.
-
Data availability: The datasets generated and/or analyzed during the current study are available from the corresponding author on reasonable request.
References
1. Selen, DJ, Thaweethai, T, Schulte, CC, Hsu, S, He, W, James, K, et al.. Gestational glucose intolerance and risk of future diabetes. Diabetes Care 2023;46:83–91. https://doi.org/10.2337/dc22-1390.Search in Google Scholar PubMed PubMed Central
2. Champion, ML, Battarbee, AN, Biggio, JR, Casey, BM, Harper, LM. Postpartum glucose intolerance following early gestational diabetes mellitus. Am J Obstet Gynecol MFM 2022;4:100609. https://doi.org/10.1016/j.ajogmf.2022.100609.Search in Google Scholar PubMed PubMed Central
3. Al-Hussein, RKA, Jawad, SMA. Effect of human placental lactogen hormone and some physiological parameter changes association with fetal sex in women with gestational diabetes. Biochem Cell Arch 2021;21:4251–7.Search in Google Scholar
4. Stern, C, Schwarz, S, Moser, G, Cvitic, S, Jantscher-Krenn, E, Gauster, M, et al.. Placental endocrine activity: adaptation and disruption of maternal glucose metabolism in pregnancy and the influence of fetal sex. Int J Mol Sci 2021;22:12722. https://doi.org/10.3390/ijms222312722.Search in Google Scholar PubMed PubMed Central
5. Szlapinski, SK, Hill, DJ. Metabolic adaptations to pregnancy in healthy and gestational diabetic pregnancies: the pancreas-placenta axis. Curr Vasc Pharmacol 2021;19:141–53. https://doi.org/10.2174/1570161118666200320111209.Search in Google Scholar PubMed
6. Gajera, D, Trivedi, V, Thaker, P, Rathod, M, Dharamsi, A. Detailed review on gestational diabetes mellitus with emphasis on pathophysiology, epidemiology, related risk factors, and its subsequent conversion to type 2 diabetes mellitus. Horm Metab Res 2023;55:295–303. https://doi.org/10.1055/a-2061-9441.Search in Google Scholar PubMed
7. Moon, JH, Jang, HC. Gestational diabetes mellitus: diagnostic approaches and maternal-offspring complications. J Diabetes Metabol 2022;46:3–14. https://doi.org/10.4093/dmj.2021.0335.Search in Google Scholar PubMed PubMed Central
8. Kouhkan, A, Najafi, L, Malek, M, Baradaran, HR, Hosseini, R, Khajavi, A, et al.. Gestational diabetes mellitus: major risk factors and pregnancy-related outcomes: a cohort study. Int J Reprod Biomed 2021;19:827. https://doi.org/10.18502/ijrm.v19i9.9715.Search in Google Scholar PubMed PubMed Central
9. Pittyanont, S, Suriya, N, Sirilert, S, Tongsong, T. Comparisons of the rates of large-for-gestational-age newborns between women with diet-controlled gestational diabetes mellitus and those with non-gestational diabetes mellitus JJJ. Clin Pract 2024;14:536–45.10.3390/clinpract14020041Search in Google Scholar PubMed PubMed Central
10. Ramos, SZ, Lewkowitz, AK, Lord, MG, Has, P, Danilack, VA, Savitz, DA, et al.. Predicting primary cesarean delivery in pregnancies complicated by gestational diabetes mellitus. Am J Obstet Gynecol 2023;229:549–e1. https://doi.org/10.1016/j.ajog.2023.06.002.Search in Google Scholar PubMed PubMed Central
11. Chiefari, E, Quaresima, P, Visconti, F, Mirabelli, M, Brunetti, A. Gestational diabetes and fetal overgrowth: time to rethink screening guidelines. Lancet Diabetes Endocrinol 2020;8:561–2. https://doi.org/10.1016/s2213-8587(20)30189-3.Search in Google Scholar PubMed
12. Borsamo, A, Ermias, D, Asmare, Y, Kifile, K. Prevalence, and associated factors of cephalopelvic disproportion among pregnant women attending delivery services at wachemo university, nigist elleni mohammed memorial referral hospital, southern Ethiopia [Preprint] 2024. https://doi.org/10.21203/rs.3.rs-4849671/v1.Search in Google Scholar
13. Braggion, A, Favre, G, Lepigeon, K, Sichitiu, J, Baud, D, Desseauve, D. Advanced maternal age among nulliparous at term and risk of unscheduled cesarean delivery. Am J Obstet Gynecol MFM 2023;5:100972. https://doi.org/10.1016/j.ajogmf.2023.100972.Search in Google Scholar PubMed
14. Morikawa, M, Kato-Hirayama, E, Mayama, M, Saito, Y, Nakagawa, K, Umazume, T, et al.. Glycemic control and fetal growth of women with diabetes mellitus and subsequent hypertensive disorders of pregnancy. PLoS One 2020;15:e0230488. https://doi.org/10.1371/journal.pone.0230488.Search in Google Scholar PubMed PubMed Central
15. Yang, H, Xiao, C, Tu, J. The effect of gestational diabetes mellitus on pregnancy outcomes in advanced primiparous women: a retrospective study. Medicine 2024;103:e37570. https://doi.org/10.1097/md.0000000000037570.Search in Google Scholar
16. Zhang, H, Dai, J, Zhang, W, Sun, X, Sun, Y, Wang, L, et al.. Integration of clinical demographics and routine laboratory analysis parameters for early prediction of gestational diabetes mellitus in the Chinese population. Front Endocrinol 2023;14:1216832. https://doi.org/10.3389/fendo.2023.1216832.Search in Google Scholar PubMed PubMed Central
17. Sweeting, AN, Appelblom, H, Ross, GP, Wong, J, Kouru, H, Williams, PF, et al.. First trimester prediction of gestational diabetes mellitus: a clinical model based on maternal demographic parameters. Diabetes Res Clin Pract 2017;127:44–50. https://doi.org/10.1016/j.diabres.2017.02.036.Search in Google Scholar PubMed
18. Ehrenberg, HM, Huston-Presley, L, Catalano, PM. The influence of obesity and gestational diabetes mellitus on accretion and the distribution of adipose tissue in pregnancy. Am J Obstet Gynecol 2003;189:944–8. https://doi.org/10.1067/s0002-9378(03)00761-0.Search in Google Scholar PubMed
19. Langley‐Evans, SC, Pearce, J, Ellis, S. Overweight, obesity and excessive weight gain in pregnancy as risk factors for adverse pregnancy outcomes: a narrative review. J Hum Nutr Diet 2022;35:250–64. https://doi.org/10.1111/jhn.12999.Search in Google Scholar PubMed PubMed Central
20. Carlson, NS, Hernandez, TL, Hurt, KJ. Parturition dysfunction in obesity: time to target the pathobiology. Reprod Biol Endocrinol 2015;13:1–14. https://doi.org/10.1186/s12958-015-0129-6.Search in Google Scholar PubMed PubMed Central
21. O’Dwyer, V, O’Kelly, S, Monaghan, B, Rowan, A, Farah, N, Turner, MJ. Maternal obesity and induction of labor. Acta Obstet Gynecol Scand 2013;92:1414–8. https://doi.org/10.1111/aogs.12263.Search in Google Scholar PubMed
22. Catalano, PM, Shankar, K. Obesity and pregnancy: mechanisms of short term and long term adverse consequences for mother and child. Br Med J 2017;356. https://doi.org/10.1136/bmj.j1.Search in Google Scholar PubMed PubMed Central
23. Zhang, Y, Li, T, Yue, C-Y, Liu, Y. Associations of serum D-dimer and glycosylated hemoglobin levels with third-trimester fetal growth restriction in gestational diabetes mellitus. World J Diabetes 2024;15:914. https://doi.org/10.4239/wjd.v15.i5.914.Search in Google Scholar PubMed PubMed Central
24. Yang, Y, Cao, X, Wang, W. The expression and significance of IL-6, CRP and TNF-α in pregnant women with gestational diabetes and hypertension 2022;22:1092–5.Search in Google Scholar
25. Ye, Y-X, Wang, Y, Wu, P, Yang, X, Wu, L, Lai, Y, et al.. Blood cell parameters from early to middle pregnancy and risk of gestational diabetes mellitus. J Clin Endocrinol Metab 2023;108:e1702–1. https://doi.org/10.1210/clinem/dgad336.Search in Google Scholar PubMed
26. Khambule, L, George, JA. The role of inflammation in the development of GDM and the use of markers of inflammation in GDM screening. Adv Exp Med Biol 2019;1134:217–42.10.1007/978-3-030-12668-1_12Search in Google Scholar PubMed
27. Lekva, T, Norwitz, ER, Aukrust, P, Ueland, T. Impact of systemic inflammation on the progression of gestational diabetes mellitus. Curr Diabetes Rep 2016;16:1–11. https://doi.org/10.1007/s11892-016-0715-9.Search in Google Scholar PubMed
28. Gascho, CLL, Leandro, DMK, Ribeiro, T, Silva, JC. Predictors of cesarean delivery in pregnant women with gestational diabetes mellitus. Rev Bras Ginecol Obstet/RBGO Rev Bras Ginecol Obstet 2017;39:060–5.10.1055/s-0037-1598644Search in Google Scholar PubMed PubMed Central
29. Stoikou, M, Grimolizzi, F, Giaglis, S, Schäfer, G, van Breda, SV, Hoesli, IM, et al.. Gestational diabetes mellitus is associated with altered neutrophil activity. Front Immunol 2017;8:702. https://doi.org/10.3389/fimmu.2017.00702.Search in Google Scholar PubMed PubMed Central
30. Zeng, J, Li, Y, Dong, Y, Chen, Y, Liu, Y, Wang, S, et al.. Predictive values of D-dimer for adverse pregnancy outcomes: a retrospective study. Clin Chem Lab Med 2021;59:e99–101. https://doi.org/10.1515/cclm-2020-0392.Search in Google Scholar PubMed
31. Gutiérrez García, I, Pérez Cañadas, P, Martínez Uriarte, J, García Izquierdo, O, Angeles Jódar Pérez, M, García de Guadiana Romualdo, L. D-dimer during pregnancy: establishing trimester-specific reference intervals. Scand J Clin Lab Invest 2018;78:439–42. https://doi.org/10.1080/00365513.2018.1488177.Search in Google Scholar PubMed
© 2025 the author(s), published by De Gruyter, Berlin/Boston
This work is licensed under the Creative Commons Attribution 4.0 International License.
Articles in the same Issue
- Frontmatter
- Commentary
- The IAPM New Delhi 2025 Declaration on Svadharma and Professional Responsibility
- Reviews
- The use of laser therapy in fetal medicine: a narrative review
- Nutriepigenomics in perinatal medicine: maternal nutrition as a modulator of fetal gene expression and long-term health
- Original Articles – Obstetrics
- Community births in the United States, 2016–2024: post-pandemic patterns across racial and ethnic groups
- Preeclampsia is associated with increased NT-proBNP and altered lipid profiles in umbilical cord blood: a propensity score-matched analysis
- Ureaplasma parvum detected in umbilical cord tissues diagnosed with funisitis associated with adverse pregnancy outcomes and neonatal pneumonia
- Implementation of a universal low-dose aspirin protocol for the prevention of preeclampsia in a federally qualified health center
- Comparative evaluation of manual and VOCAL methods for amniotic sac volume measurement in early pregnancy
- McDonald vs. Shirodkar cerclage for the prevention of preterm birth in patients with obesity
- The incidence and outcomes of perinatal asphyxia in spontaneous extreme preterm birth: a retrospective cohort study
- Comparative effectiveness of oxytocin, carbetocin, and tranexamic acid for postpartum hemorrhage prevention in cesarean deliveries: a prospective cohort analysis
- Risk factors for primary cesarean delivery in women with gestational diabetes mellitus: a predictive model for clinical risk assessment
- Evaluation of Doppler parameters and obstetric outcomes in intrahepatic cholestasis of pregnancy
- Diagnostic yield and clinical impact of prenatal whole exome sequencing (WES) – four-year single center experience
- Associations between previous cesarean section and maternal and neonatal complications: the modification of long inter-pregnancy interval
- Maternal and neonatal outcomes of ultrasound-guided percutaneous nephrostomy for symptomatic hydronephrosis in pregnancy: a retrospective cohort study
- Original Articles – Fetus
- Abnormal Doppler and perinatal outcomes according to the placental lesions of maternal and fetal vascular malperfusion in preterm fetal growth restriction
- The additional value of fetal MRI to ultrasonography in prenatal diagnosis: an evaluation based on postnatal confirmation
- The fetal exposome and preterm birth: a systematic synthesis of environmental exposures and multi-omics evidence
- Original Articles – Neonates
- Pregnancy-associated anemia and its effects in term neonates
- Longitudinal changes of left ventricular hypoplasia and ventricular disproportion in congenital diaphragmatic hernia neonates
- Outcomes in early term neonates requiring extracorporeal membrane oxygenation
- Letters to the Editor
- Therapeutic trials of maternal position therapy are needed to clarify the causes of abnormal maternal hemodynamic profiles and reduced umbilical vein flow in fetal growth restriction
- Let’s use diverse technologies to assess maternal hemodynamics-- both before and during labor and to both predict and prevent bad outcomes!
- Corrigendum
- The FAIR framework: ethical hybrid peer review