Correlation of serum miR-203a-3p with the severity of neonates with necrotizing enterocolitis and analysis of its molecular mechanism
-
Fengna Zhu


Abstract
Objectives
The objective of this study was to examine the role of microRNA-203a-3p (miR-203a-3p) in the pathogenesis of necrotizing enterocolitis (NEC).
Methods
Quantitative real-time polymerase chain reaction (qRT-PCR) and receiver operating characteristic (ROC) curve analysis were employed to evaluate the relative abundances of miR-203a-3p as well as its diagnostic capacity. Logistic regression was applied to search for influential risk factors associated with NEC in neonates. Cell behaviors were assessed with flow cytometry and CCK-8 detection. The target genes of miR-203a-3p and its potential biological functions were analyzed via bioinformatic analysis.
Results
A significant reduction in serum levels of miR-203a-3p was observed in neonates with NEC. Notably, this miRNA exhibited exceptional diagnostic precision for differentiating NEC from non-NEC cases, as evidenced by an area under the curve (AUC) of 0.928. Furthermore, miR-203a-3p was established as an independent indicator for assessing the severity of NEC. In an NEC cell model, levels of miR-203a-3p were distinctly diminished; however, this decrease was significantly reversed following transfection with miR-203a-3p (p<0.001). Correspondingly, findings were noted regarding cell apoptosis, cell viability, inflammatory indicators, and antioxidant enzyme activities. MiR-203a-3p-related genes predominantly clustered within inflammatory-associated signaling pathways and proteins, particularly ataxia telangiectasia mutated (ATM). Notably, miR-203a-3p was found to directly target ATM. Importantly, heightened levels of ATM were detected in both neonates with NEC and LPS-triggered fetal human colon (FHC) cells (p<0.001).
Conclusions
MiR-203a-3p alleviates LPS-induced inflammatory damage in FHC cells through regulating ATM, thereby presenting a promising avenue for the development of novel therapeutic strategies for neonates with NEC.
Introduction
Necrotizing enterocolitis (NEC) constitutes a gastrointestinal emergency within the neonatal intensive care unit (NICU) [1]. This condition predominantly affects a significant proportion of preterm infants and remains a major contributor to mortality in the NICU [2]. The impact of NEC extends beyond immediate clinical outcomes, severely compromising the long-term prognosis and quality of life of neonates with NEC [3], 4]. Clinically, NEC manifests through various symptoms including abdominal distension, vomiting, diarrhea, and the presence of blood in the stool [5]. Alarmingly, despite improvements in neonatal medical technology, the incidence of NEC among preterm infants has continued to rise, coupled with a concerning decline in prognosis [6]. The long-term complications associated with NEC are manifold [7]. Therefore, it is necessary to explore potential biomarkers to detect NEC at an early stage.
MicroRNAs (miRNAs) are approximately 22-nucleotide-long single-stranded noncoding RNAs that exert regulatory effects at the posttranscriptional levels [8]. These molecules have been demonstrated to influence a wide array of cellular behaviors, encompassing cellular growth [9], inflammation [10], and oxidative stress [11]. Mounting evidence underscores the pivotal role that miRNAs play in the etiology of NEC, such as miR-301a, and miR-21 [12], 13]. MiRNA chip analysis identified the miR-429/200a/b and miR-141/200c clusters as differentially expressed, underscoring their substantial involvement in neonates affected by NEC [14]. In addition, a comprehensive assessment of miRNA landscape profiling indicated that miR-203a-3p was markedly reduced in neonates with NEC compared to control groups [15]. Nonetheless, the influences of miR-203a-3p in the pathogenesis of NEC remains to be elucidated.
In the present investigation, a cohort of 105 neonates with NEC and a control group of 88 preterm babies without gastrointestinal disorders were recruited as study subjects. A retrospective analysis of clinical data from neonates with NEC was undertaken to elucidate potential risk factors associated with the severity of this condition. Furthermore, the possible involvement of miR-203a-3p in the etiology of NEC by establishing a cellular model to assess cellular behaviors, inflammatory responses, and other relevant indicators.
Materials and methods
Study population
A total of 105 neonates with NEC who were hospitalized and treated in the author’s institution were enrolled as the study group. Additionally, 88 preterm infants without gastrointestinal disorders were selected as the control group during the same period. The sample size was determined by power analysis using G*Power 3.1 software, based on an effect size of d=0.5, with α=0.05 and power=90 %, yielding a minimum requirement of 64 subjects per group. Inclusion criteria for the study were as follows: 1) hospitalization at the same facility during the same period; 2) Availability of complete clinical information; 3) diagnosis and staging of NEC were strictly defined by Bell’s criteria as follows: Stage I (Suspected): temperature instability, apnea/bradycardia; abdominal distension; gastric residuals; occult blood in stool (no radiographic signs); Stage II (Definite): Stage I symptoms+radiographic signs (pneumatosis intestinalis, portal venous gas); thrombocytopenia; metabolic acidosis; Stage III (Advanced): Stage II symptoms+hemodynamic instability; intestinal perforation; abdominal tenderness/erythema; 4) for the control group: without gastrointestinal signs and symptoms, feeding intolerance, fecal and bowel abnormalities, or inherited metabolic disorders. Exclusion criteria included: 1) combined with digestive tract abnormalities; 2) with genetic metabolic disorders, chromosomal abnormalities, or immune deficiencies.
Peripheral blood of all participants was collected and subjected to centrifugation at 3,000 rpm for a duration of 10 min. Subsequent to this process, serum samples were preserved for the next experiments.
The study obtained the approval of the Ethics Committee of the author’s institution. All subjects’ legal guardians of all subjects involved have given informed consent.
Cell cultivation and transfection
The human normal colorectal fetal human colon (FHC) cells, purchased from the American Type Culture Collection (ATCC, Manassas, VA, USA), were maintained in a controlled environment at 37 °C and 5 % CO2. Dulbecco’s Modified Eagle Medium (DMEM) supplemented with 10 % serum fetal bovines was used as the culture medium. 1 % penicillin-streptomycin was added to the medium. FHC cells were treated with lipopolysaccharide (LPS) at different concentrations (0, 5, 10, 20, and 50 μg/mL) for 3 and 6 h, and the optimal LPS concentration was screened to establish the NEC cell model.
Lipofectamine 3,000 (Invitrogen) was utilized for transfecting miR-203a-3p mimic/mimic-NC, miR-203a-3p inhibitor/inhibitor-NC into FHC cells. Subsequently, the cells were stimulated with LPS for 4 h.
qRT-PCR assay
Based on the instruction provided by the manufacturer, TRIzol reagent was utilized for the extraction of total RNA from serum and cells. cDNA was reservedly transcribed with a TaqMan miRNA Reverse Transcription Kit (Applied Biosystems, Shanghai, China). The SYBR Premix Ex Taq II was employed for the detection of qRT-PCR on the BIO-RAD 7500 System. RNU6B was taken for the normalization of miR-203a-3p. Relative abundances of miR-203a-3p were computed by means of the equation of 2−ΔΔCT approaches. Three replications were carried out for each reaction.
Analysis of inflammatory mediators
Cell supernatants were obtained for the measurement of IL-6 (interleukin-6), IL-8, and IL-1β levels using the corresponding ELISA Kits (Beyotime, Beijing, China). The detection of the inflammatory mediators was carried out based on the direction of the manufacturer. The optical density (OD) values were calculated at 450 nm by a microplate reader.
Redox-stress response test
Furthermore, superoxide dismutase (SOD) and catalase (CAT) testing reagents (Biological Engineering Research Institute, Nanjing, China) were obtained for the detection of SOD and CAT levels in the cell supernatant following the manufacturers’ directions.
Flow cytometry assay
Flow cytometry (BD Biosciences, Heidelberg, Germany) was utilized for testing cell apoptosis. The cells were washed with PBS and re-suspended in phosphate-buffered saline (PBS). Annexin V-FITC (fluorescein isothiocyanate) and PI (propyl iodide) were added to the cell suspension and cultivated for 30 min at 4 °C in the dark. The apoptosis was monitored using FACScan flow cytometry (BD Biosciences).
Measurement of cell viability
MCF-7 cells were inoculated in 96-well plates and cultured overnight to allow for cell adhesion to the wall. At 48 h, 10 μL of CCK-8 reagent was added, and incubation continued for 1 h. After the incubation period, the cells were protected from light, and the absorbance at 450 nm was detected by an enzyme marker. Three wells were established for each group, and the cell proliferation viability of each group was quantified by the absorbance value.
Dual-luciferase reporter assay
The 3′-untranslated regions (3′-UTR) of ATM-WT and ATM-MUT of ATM were cloned and inserted into pmiRGLO vector and then co-transfected with miR-203a-3p mimic/inhibitor into FHC cells. After 48 h transfection, the cells were lysed and luciferase activity was detected with Dual luciferase Assay Kit (Vazyme, Nanjing, China). Luciferase activities were tested using a microplate reader, which was standardized by sea renilla luciferase.
Bioinformatic analysis
The miRPathDB, miRDB, and miRWalk databases were utilized for the prediction of miR-203a-3p target genes, and these miR-203a-3p-related genes were analyzed with Venn diagrams. Meanwhile, for the miR-203a-3p-regulated genes, the Gene Ontology (GO) and Kyoto Encyclopedia of Genes and Genomes (KEGG) enrichment analyses were executed for the exploration of potential molecular function and associated signaling pathways. As for the protein analysis, the Search Tool of the Retrieval of Interacting Genes/Proteins (STRING) database was employed for the online protein-protein interaction (PPI) prediction analysis.
Statistics
The data analysis was performed with the utilization of the statistical software package SPSS 23.0 in conjunction with the graphing software GraphPad Prism 7.0. The continuous variables were averaged and the standard deviation (SD) was computed accordingly. Student’s t-test was executed to examine two-group disparities, while a one-way ANOVA test was conducted for comparisons involving three or more groups. The association of categorical variables between the two groups was assessed using the Chi-square test. Logistic regression analysis was applied to identify risk factors for NEC. Additionally, receiver operating characteristic (ROC) curves were generated to ascertain the diagnostic property of miR-203a-3p. The relevance of miR-203a-3p with ATM was assessed using Pearson’s correlation coefficient analysis. A p value of less than 0.05 indicated the presence of a statistically significant difference.
Results
Baseline data of neonates with NEC and controls
As illustrated in Table 1, the fundamental clinical characteristics, including sex, gestational age, weight, delivery mode, feeding patterns, as well as laboratory parameters such as white blood cells (WBC), neutrophil (NEU), platelets (PLT), c-reactive protein (CRP), procalcitonin (PCT), albumin (ALB), were compared between neonates with NEC group and control group. Inter-group comparisons revealed no obvious differences in sex, gestational age, and weight of the study group and controls (all p>0.05). In contrast, the NEC group exhibited a notable decrease in the levels of WBC, NEU, PLT, and ALB when compared to the control group, suggesting a statistical significance (all p<0.05). Conversely, in the neonates with NEC, CRP and PCT levels were distinctly enhanced relative to their non-NEC counterparts (all p<0.001). Furthermore, a notable association was identified regarding delivery mode and feeding patterns between the two groups (all p<0.05). Additionally, it was observed that 60 (57.1 %) neonates with NEC were classified at Bell stage I, while 45 (42.9 %) neonates were categorized at Bell stage II/III.
Comparison of baseline information between case and control groups.
| Characteristics | Controls (n=88) | NEC (n=105) | p-Value |
|---|---|---|---|
| Sex (male/female) | 46/42 | 50/55 | 0.565 |
| Gestational age, weeks | 33.19 ± 2.14 | 32.98 ± 2.27 | 0.503 |
| Weight, g | 1885.31 ± 395.53 | 1862.18 ± 454.37 | 0.710 |
| Delivery mode n (%) | 0.012 | ||
| Cesarean delivery | 43 (48.9 %) | 71 (67.6 %) | |
| Spontaneous delivery | 45 (51.1 %) | 34 (32.4 %) | |
| Bell stage n (%) | / | ||
| I | / | 60 (57.1 %) | |
| II/III | / | 45 (42.9 %) | |
| Feeding patterns n (%) | 0.031 | ||
| Breast milk | 49 (55.7 %) | 42 (40.0 %) | |
| Infant formula | 39 (44.3 %) | 63 (60.0 %) | |
| WBC (×109/L) | 12.55 ± 2.80 | 9.16 ± 2.91 | <0.001 |
| NEU (×109/L) | 7.68 ± 3.10 | 5.54 ± 2.30 | <0.001 |
| PLT (×109/L) | 207.72 ± 20.13 | 199.86 ± 22.62 | 0.012 |
| CRP, mg/L | 2.38 ± 0.53 | 4.70 ± 0.75 | <0.001 |
| PCT, μg/L | 0.59 ± 0.23 | 3.45 ± 0.41 | <0.001 |
| ALB, g/L | 33.68 ± 2.93 | 29.81 ± 3.77 | <0.001 |
-
NEC, necrotizing enterocolitis; WBC, white blood cells; NEU, neutrophil; PLT, platelets; CRP, C-reactive protein; PCT, procalcitonin; ALB, albumin. p<0.05 was a significant difference.
Relative abundances of miR-203a-3p in neonates with NEC
To investigate the expression pattern and diagnostic potential of miR-203a-3p in neonates suffering from NEC, qRT-PCR assay was executed. The results demonstrated a significant reduction in miR-203a-3p levels in the NEC cohort against controls (p<0.001, Figure 1A). Furthermore, the AUC was determined to be 0.928, effectively differentiating between neonates with NEC and those with non-NEC, exhibiting a sensitivity of 80.7 % and a specificity of 92.4 % (Figure 1B).
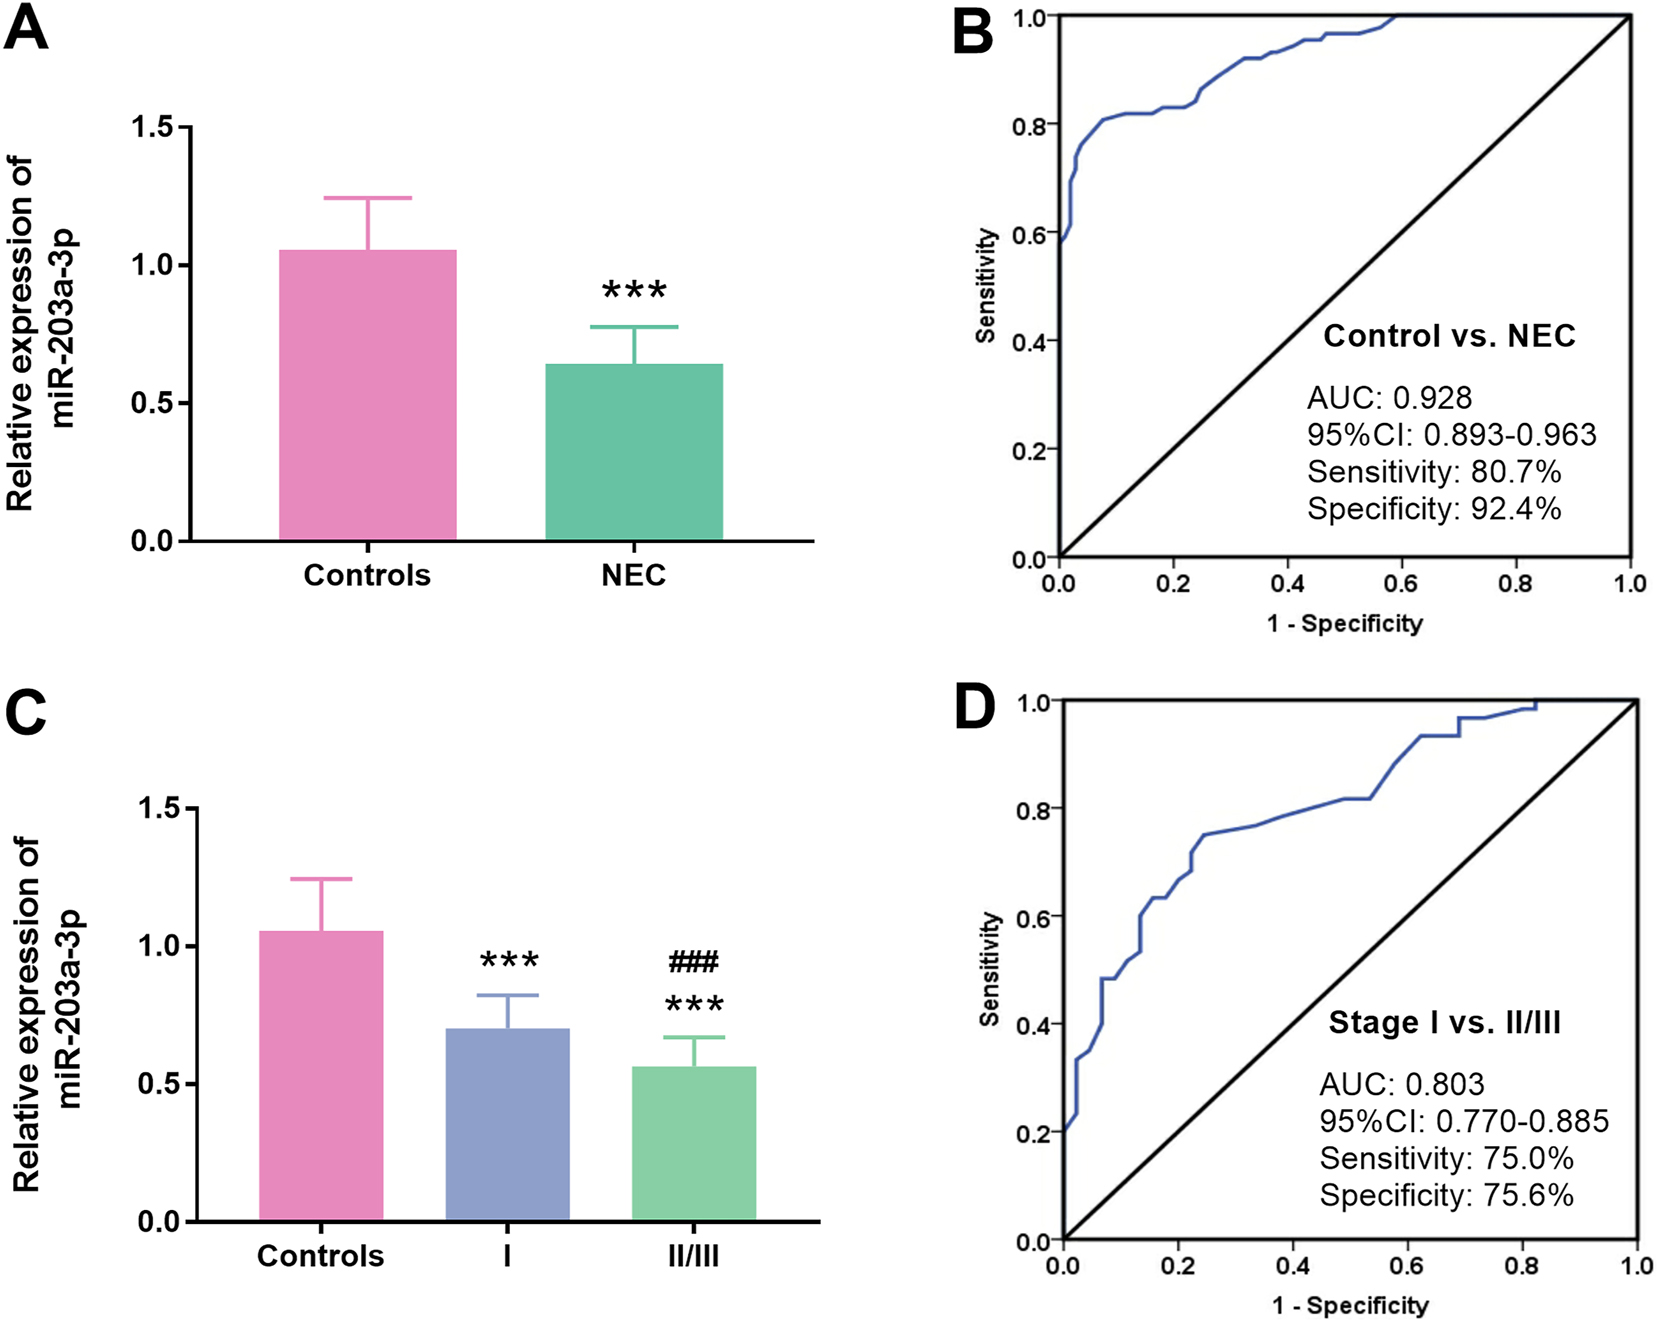
Relative abundances of miR-203a-3p in neonates with NEC. A. Serum miR-203a-3p was distinctly declined in neonates with NEC relative to control subjects (p<0.001). B. The AUC of miR-203a-3p was 0.928, highlighting its robust efficacy in discriminating neonates with NEC from those with non-NEC. C. A pronounced decrease in serum miR-203a-3p was found in neonates at the bell stage I and II/III compared to controls (p<0.001). D. A substantial diagnostic capability of serum miR-203a-3p was found in differentiating neonates at the bell stage II/III from those at the bell stage I. The AUC was 0.803 (NEC: Necrotizing enterocolitis; AUC: Area under the curve; ***: p<0.001 NEC vs. controls; ###: p<0.001 bell stage II/III vs. Bell stage I).
For the subgroup analysis, the NEC group was stratified into Bell stage I and Bell stage II/III subgroups. When compared to the control group, miR-203a-3p expression exhibited a significant decline across both the Bell stage I and Bell stage II/III groups, respectively (p<0.001). Notably, a substantial reduction in miR-203a-3p levels was noted in neonates classified within the Bell stage II/III subgroup, in contrast to those in Bell stage I (p<0.001, Figure 1C). Additionally, the diagnostic capacity of miR-203a-3p in differentiating neonates in the Bell stage II/III and those in the Bell stage I was evaluated using ROC analysis. The findings revealed a robust diagnostic potential, reflected by an AUC of 0.803. The sensitivity was 75.0 % and the specificity was 75.6 % (Figure 1D).
Comparison analysis of clinical information of different bell stages in neonates with NEC
Based on the Bell classification criteria, a cohort of 105 neonates with NEC was split into two groups: Bell stage I (n=60) and stage II/III (n=45). As detailed in Table 2, a statistically significant association was found across several clinical parameters, including gestational age (p<0.001), WBC (p=0.016), CRP (p=0.003), PCT (p<0.001) and ALB (p=0.009) when comparing the Bell stage I to stages II/III. Nevertheless, no statistically significant differences were found regarding sex, weight, delivery mode, feeding patterns, NEU, and PLT between the Bell stage I and stages II/III of neonates with NEC, as all comparisons yielding p>0.05.
Comparison of information of NEC patients with different Bell stages.
| Characteristics | Stage I (n=60) | Stage II/III (n=45) | p-Value |
|---|---|---|---|
| Sex (male/female) | 31/29 | 19/26 | 0.430 |
| Gestational age, weeks | 33.86 ± 2.15 | 31.82 ± 1.87 | <0.001 |
| Weight, g | 1914.35 ± 483.91 | 1792.64 ± 406.66 | 0.176 |
| Delivery mode n (%) | 0.535 | ||
| Cesarean delivery | 39 (65.0 %) | 32 (71.1 %) | |
| Spontaneous delivery | 21 (35.0 %) | 13 (28.9 %) | |
| Feeding patterns n (%) | 0.546 | ||
| Breast milk | 26 (43.3 %) | 16 (35.6 %) | |
| Infant formula | 34 (56.7 %) | 29 (64.4 %) | |
| WBC (×109/L) | 9.73 ± 2.95 | 8.38 ± 2.66 | 0.016 |
| NEU (×109/L) | 5.91 ± 2.15 | 5.06 ± 2.42 | 0.074 |
| PLT (×109/L) | 200.38 ± 20.98 | 199.11 ± 24.78 | 0.777 |
| CRP, mg/L | 4.51 ± 0.77 | 4.95 ± 0.63 | 0.003 |
| PCT, μg/L | 3.32 ± 0.37 | 3.64 ± 0.38 | <0.001 |
| ALB, g/L | 30.62 ± 3.32 | 28.71 ± 4.08 | 0.009 |
-
NEC, necrotizing enterocolitis; WBC, white blood cells; NEU, neutrophil; PLT, platelets; CRP, C-reactive protein; PCT, procalcitonin; ALB, albumin. p<0.05 was a significant difference.
Risk factors analysis for NEC bell stages
To evaluate the influencing factors for the severity of NEC as classified by Bell stages, logistic regression analysis was conducted utilizing the clinical information. An examination of the univariate regression results for Bell stage I and II/III in neonates with NEC revealed that several significant associations pertaining to the progression towards more severe stages of the condition. Specifically, gestational age (p<0.001; OR=0.182; 95%CI=0.078–0.426), WBC (p=0.006; OR=0.323; 95%CI=0.143–0.728), CRP (p=0.037; OR=2.321; 95%CI=1.052–5.125), ALB (p=0.027; OR=0.275; 95%CI=0.088–0.863) and miR-203a-3p (p=0.001; OR=0.234; 95%CI=0.096–0.569) emerged as highly significant predictors (Table 3).
Logistics regression analysis of influencing factors of Bell stage.
| Factors | Univariate | Multivariate | ||
|---|---|---|---|---|
| Or (95 % CI) | p-Value | Or (95 % CI) | p-Value | |
| Sex | 1.463 (0.671–3.187) | 0.338 | ||
| Gestational age | 0.182 (0.078–0.426) | <0.001 | 0.203 (0.076–0.540) | 0.001 |
| Weight | 0.767 (0.353–1.661) | 0.499 | ||
| Delivery mode | 0.754 (0.327–1.739) | 0.508 | ||
| Feeding patterns | 0.720 (0.326–1.599) | 0.421 | ||
| WBC | 0.323 (0.143–0.728) | 0.006 | 0.303 (0.109–0.838) | 0.021 |
| NEU | 0.614 (0.281–1.333) | 0.216 | ||
| PLT | 1.022 (0.472–2.216) | 0.955 | ||
| CRP | 2.321 (1.052–5.125) | 0.037 | 1.965 (0.753–5.130) | 0.168 |
| PCT | 1.750 (0.791–3.873) | 0.167 | ||
| ALB | 0.275 (0.088–0.863) | 0.027 | 0.341 (0.119–0.979) | 0.046 |
| miR-203a-3p | 0.234 (0.096–0.569) | 0.001 | 0.168 (0.055–0.514) | 0.006 |
-
NEC, necrotizing enterocolitis; WBC, white blood cells; NEU, neutrophil; PLT, platelets; CRP, C-reactive protein; PCT, procalcitonin; ALB, albumin. p<0.05 was a significant difference.
The factors associated with the condition were incorporated into a multivariate logistic regression analysis. The results showed that miR-203a-3p (p=0.006; OR=0.168; 95%CI=0.055–0.514) emerged as a significant independent risk indicator for NEC Bell stage II/III. Additionally, gestational age (p=0.001; OR=0.203; 95%CI=0.076–0.540), WBC (p=0.021; OR=0.303; 95%CI=0.109–0.838) and ALB (p=0.046; OR=0.341; 95%CI=0.119–0.979) were also identified as critical contributors to the risk assessment (Table 3).
Influences of miR-203a-3p on cellular activities
To establish the NEC cell model, five distinct concentrations of LPS, namely 0, 5, 10, 20, and 50 μg per milliliter, were utilized to stimulate FHC cells. After qRT-PCR examination, it was observed that the levels of miR-203a-3p levels progressively decreased in FHC cells subjected to increasing LPS concentrations (0, 5, 10, 20, and 50 μg/mL) over 3 and 6 h in respective order (p<0.001, Figure 2A). Moreover, following the transfection with miR-203a-3p mimic, a substantial increase in miR-203a-3p levels was noted in comparison to the mimic-NC group, indicating a high transfection efficiency (p<0.001). Notably, upon LPS treatment, miR-203a-3p expression in FHC cells was distinctly suppressed; however, this decrease was effectively mitigated by transfection with the miR-203a-3p mimic (Figure 2B).
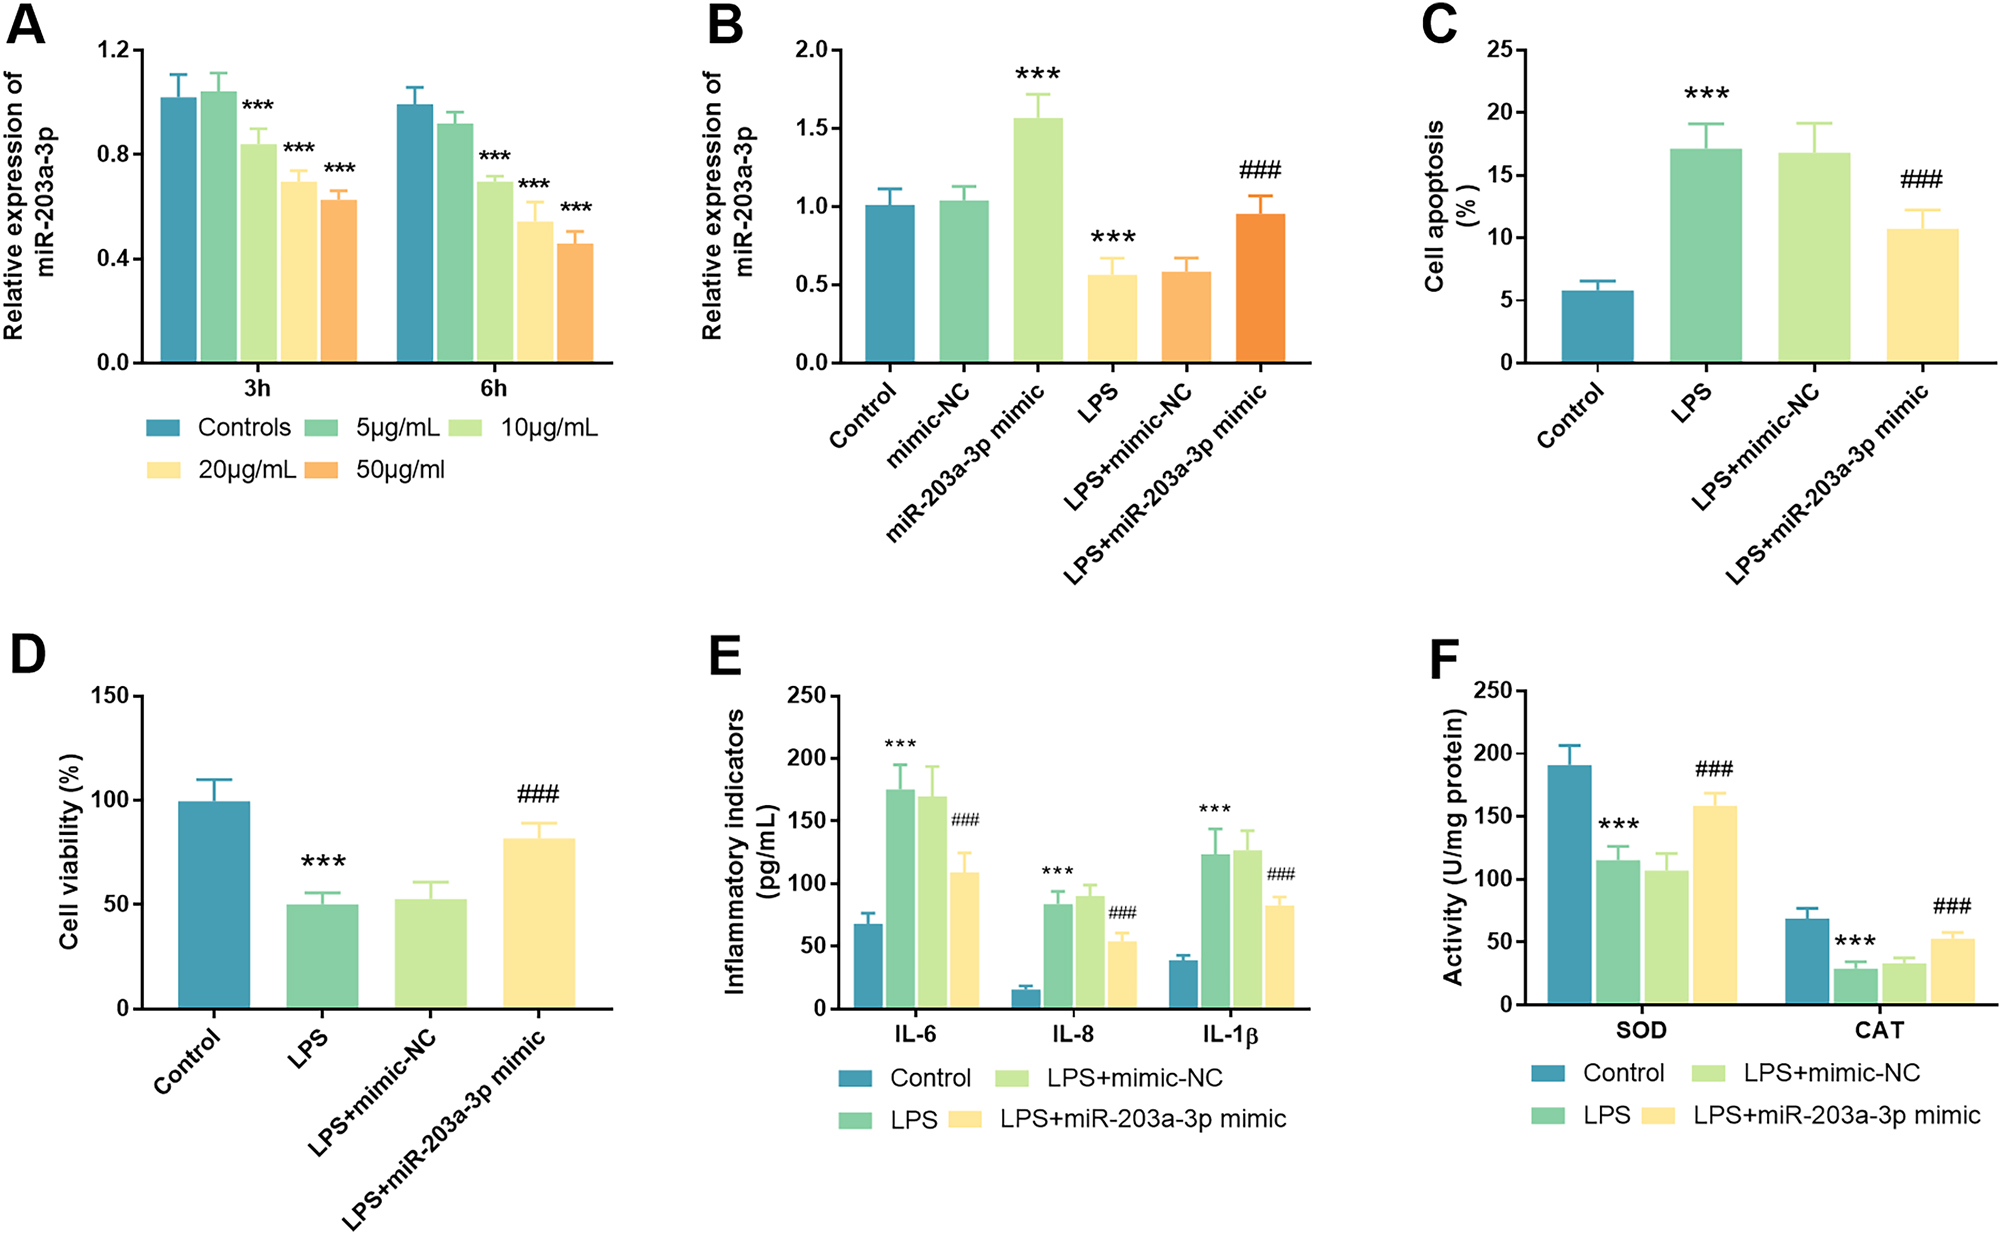
Influences of miR-203a-3p on cellular functions in an LPS-induced cell model. A. MiR-203a-3p expression was quantified in FHC cells subjected to varying concentrations of LPS (0, 5, 10, 20, and 50 μg/mL). B. Following transfection with miR-203a-3p, a significant increase in miR-203a-3p levels was observed in FHC cells relative to controls, confirming the efficacy of the transfection. MiR-203a-3p was declined in LPS-triggered cells, a decline that was successfully reversed in the LPS+miR-203a-3p mimic group. C. The assessment of cell apoptosis was conducted in LPS-triggered cells post-transfection with miR-203a-3p. D. In the NEC cell model, cell viability was evaluated after transfection with miR-203a-3p mimic. E. Inflammatory indicators were detected and analyzed across different experimental groups. F. The redox-stress response, including SOD and CAT enzymatic activities, was determined in the NEC cell model after transfection with the miR-203a-3p mimic (NEC: Necrotizing enterocolitis; LPS: Lipopolysaccharide; FHC: Fetal human cells; SOD: Superoxide dismutase; CAT: Catalase; ***: p<0.001 against mimic-NC/inhibitor-NC/controls; ###: p<0.001 against LPS+mimic-NC).
Furthermore, the evaluation of cell apoptosis and viability in FHC cells were conducted following transfection with the miR-203a-3p mimic and stimulation with LPS. Notably, the rate of cell apoptosis showed a significant increase in the LPS group compared to the control group, a phenomenon that was markedly alleviated by transfection with the miR-203a-3p mimic (p<0.001, Figure 2C). Regarding cell viability, a pronounced inhibition of cell growth was observed in the LPS group in contrast to the control group (p<0.001), with this detrimental effect similarly alleviated post-transfection with the miR-203a-3p mimic (Figure 2D). Concurrently, the levels of pertinent inflammatory indicators and antioxidant enzyme activities were assessed within the NEC cell model. The LPS-stimulated cells exhibited a substantial increase in levels of IL-6, IL-8, and IL-1β relative to control cells (p<0.001), with this elevation significantly diminishing following miR-203a-3p transfection (p<0.001, Figure 2E). As illustrated in Figure 2F (p<0.001), a significant decrease in the activities of SOD and CAT was detected in the LPS group relative to controls (p<0.001). In contrast to the LPS+mimic-NC group, the enzyme liveness of SOD and CAT was conspicuously augmented in the LPS+miR-203a-3p mimic group (p<0.001). This finding suggested that the reduction in SOD and CAT activities within the NEC cell model could be effectively counteracted by transfection with the miR-203a-3p mimic.
Bioinformatic analysis of miR-203a-3p-associated genes
Based on the prediction analysis conducted using the miRPathDB (8,765 predicted genes), miRDB (1,352 predicted genes), and miRWalk (1,393 predicted genes) databases, a Venn diagram was employed to ascertain the intersection of the three databases, revealing a total of 144 overlapping genes (Figure 3A). Moreover, GO and KEGG analyses were employed for the exploration of the functional roles and pathways associated with the predicted genes of miR-203a-3p. GO analysis demonstrated that the functions of miR-203a-3p-related genes primarily encompassed several critical domains: regulation of GTPase activity, histone mRNA catabolic process, and regulation of signaling receptor activity of biological process (BP); cation channel complex, guanyl-nucleotide exchange factor complex, ion channel complex of cellular component (CC); diacylglycerol kinase activity, ras guanyl-nucleotide exchange factor activity, NAD+ kinase activity of molecular function (MF) (Figure 3B). Concurrently, KEGG pathway analysis was conducted to gain insights into gene function, highlighting that the most significantly enriched pathways included the cAMP signaling pathway, choline metabolism in cancer, C-type lectin receptor signaling pathway, and so on (Figure 3C). Notably, of the aforementioned pathways, the MAPK signaling pathway exhibited the strongest correlation with NEC. These mined BP, CC, and MF terms and pathways are intricately associated with the pathophysiology of NEC.
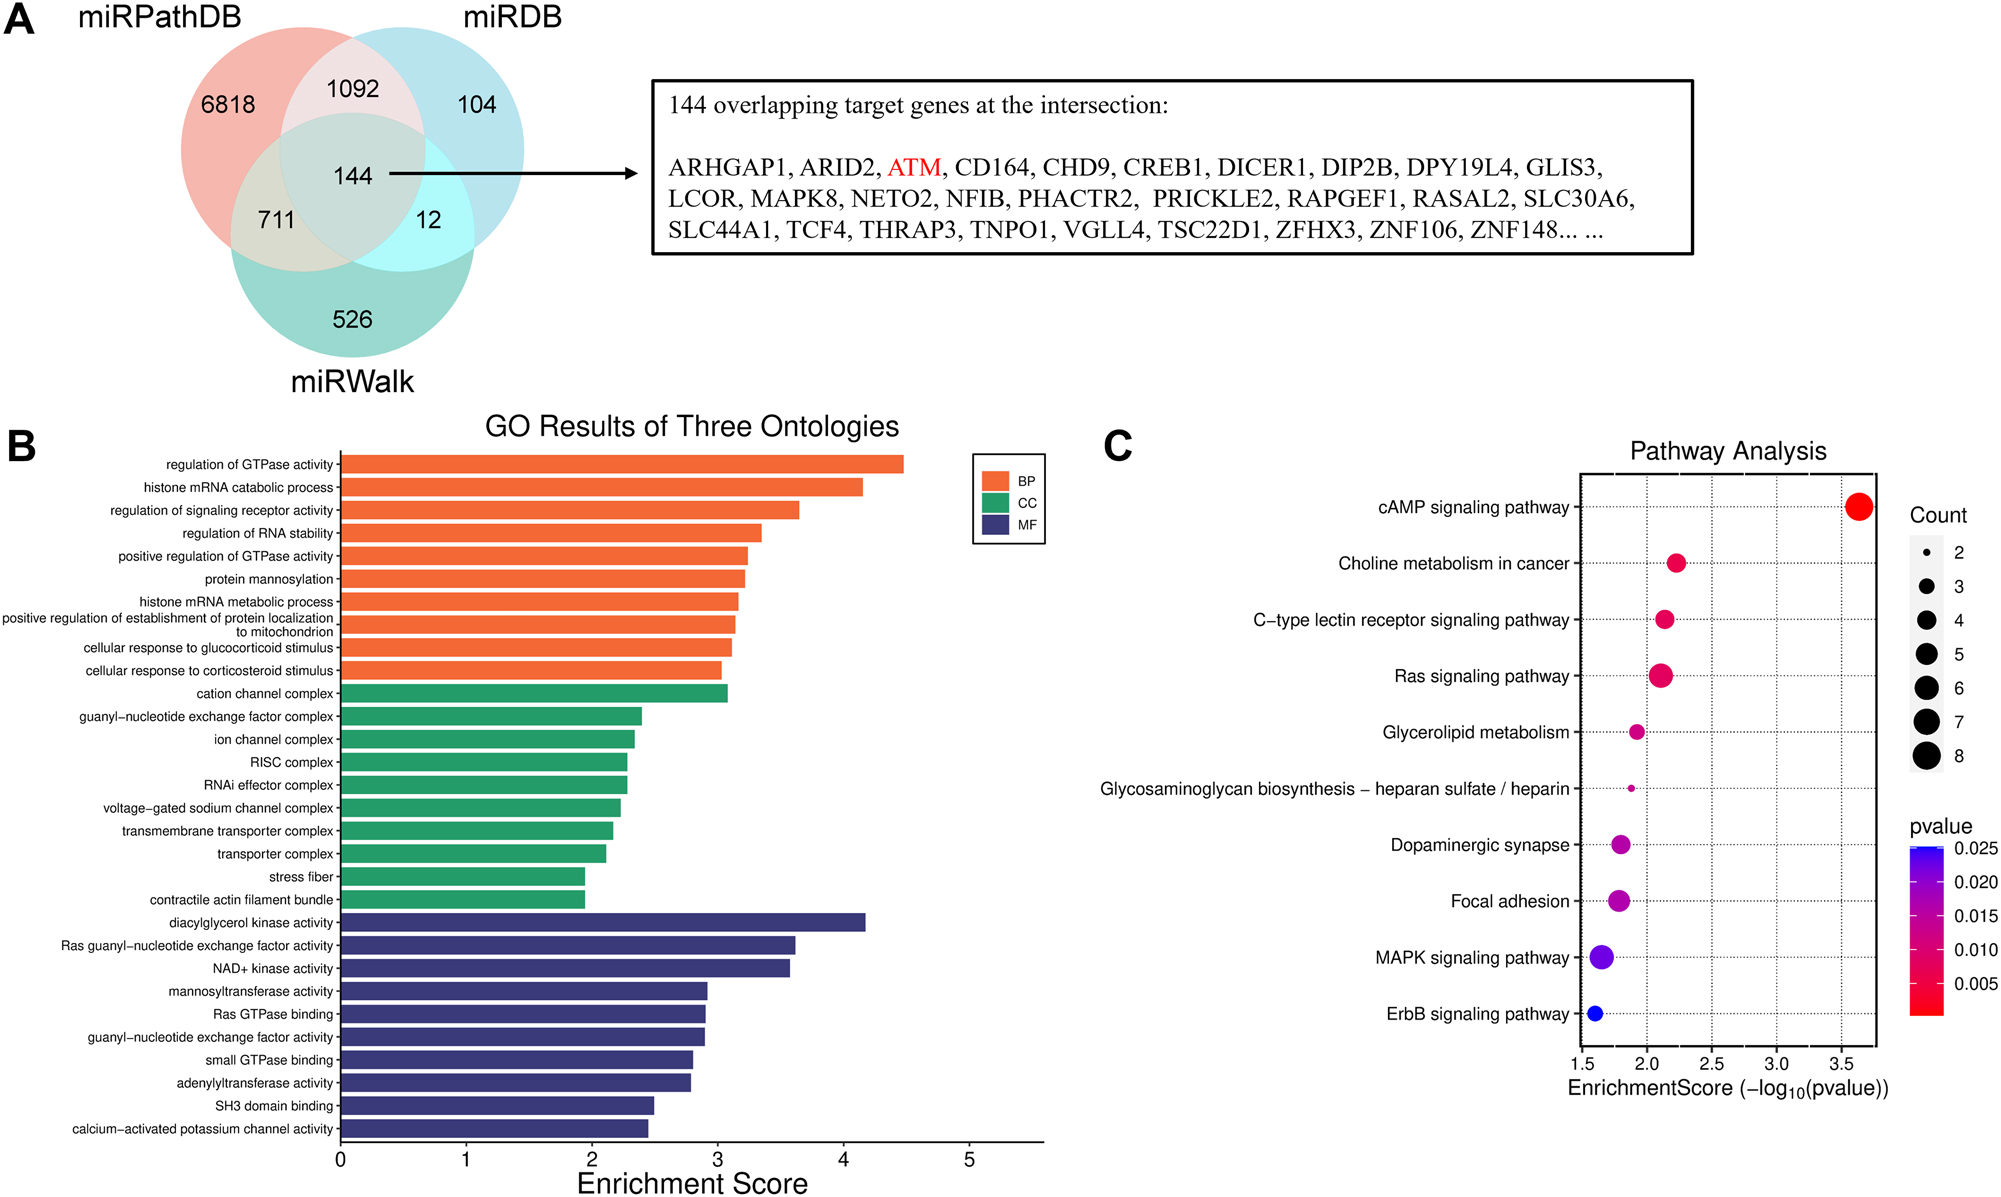
Bioinformatic analysis of miR-203a-3p-regulated genes. A. A venn diagram illustrated the overlapping genes affected by miR-203a-3p, as identified through the miRPathDB, miRDB, and miRWalk repositories. B. Gene ontology (GO) analysis of miR-203a-3p-regulated genes. C. Kyoto encyclopedia of genes and genomes (KEGG) enrichment analysis of miR-203a-3p-regulated genes.
Verification of target interaction of miR-203a-3p with ATM
To gain a deeper understanding of the potential molecular mechanisms through which miR-203a-3p influenced the pathogenesis of NEC, ATM was selected for further investigation in subsequent experiments, guided by bioinformatic analysis. The target sequences of miR-203a-3p with ATM were predicted via miRPathDB, miRDB, and miRWalk algorithms, as depicted in Figure 4A. In comparison to the mimic-NC group, a significant reduction in luciferase activities was observed in the WT-ATM group upon transfection with the miR-203a-3p mimic, indicating a remarkable enhancement in luciferase liveness (p<0.001). Conversely, no significant alterations of luciferase activities were noted in the MUT-ATM group (p<0.001, Figure 4B). Moreover, analysis of serum samples from neonates with NEC revealed a marked elevation of ATM levels when compared to control groups (p<0.001, Figure 4C). The relevance between serum miR-203a-3p and ATM was subsequently examined, revealing a negative correlation (r=−0.688, p<0.001, Figure 4D). Additionally, the relative expression of ATM across various experimental groups, including blank control, LPS, LPS+mimic-NC, and LPS+miR-203a-3p mimic groups, was investigated. Results indicated a substantial increase in ATM levels in the LPS group against the blank control group (p<0.001). Notably, an obvious reduction of ATM level was discovered in FHC cells following transfection with miR-203a-3p and subsequent LPS stimulation (p<0.001, Figure 4E).
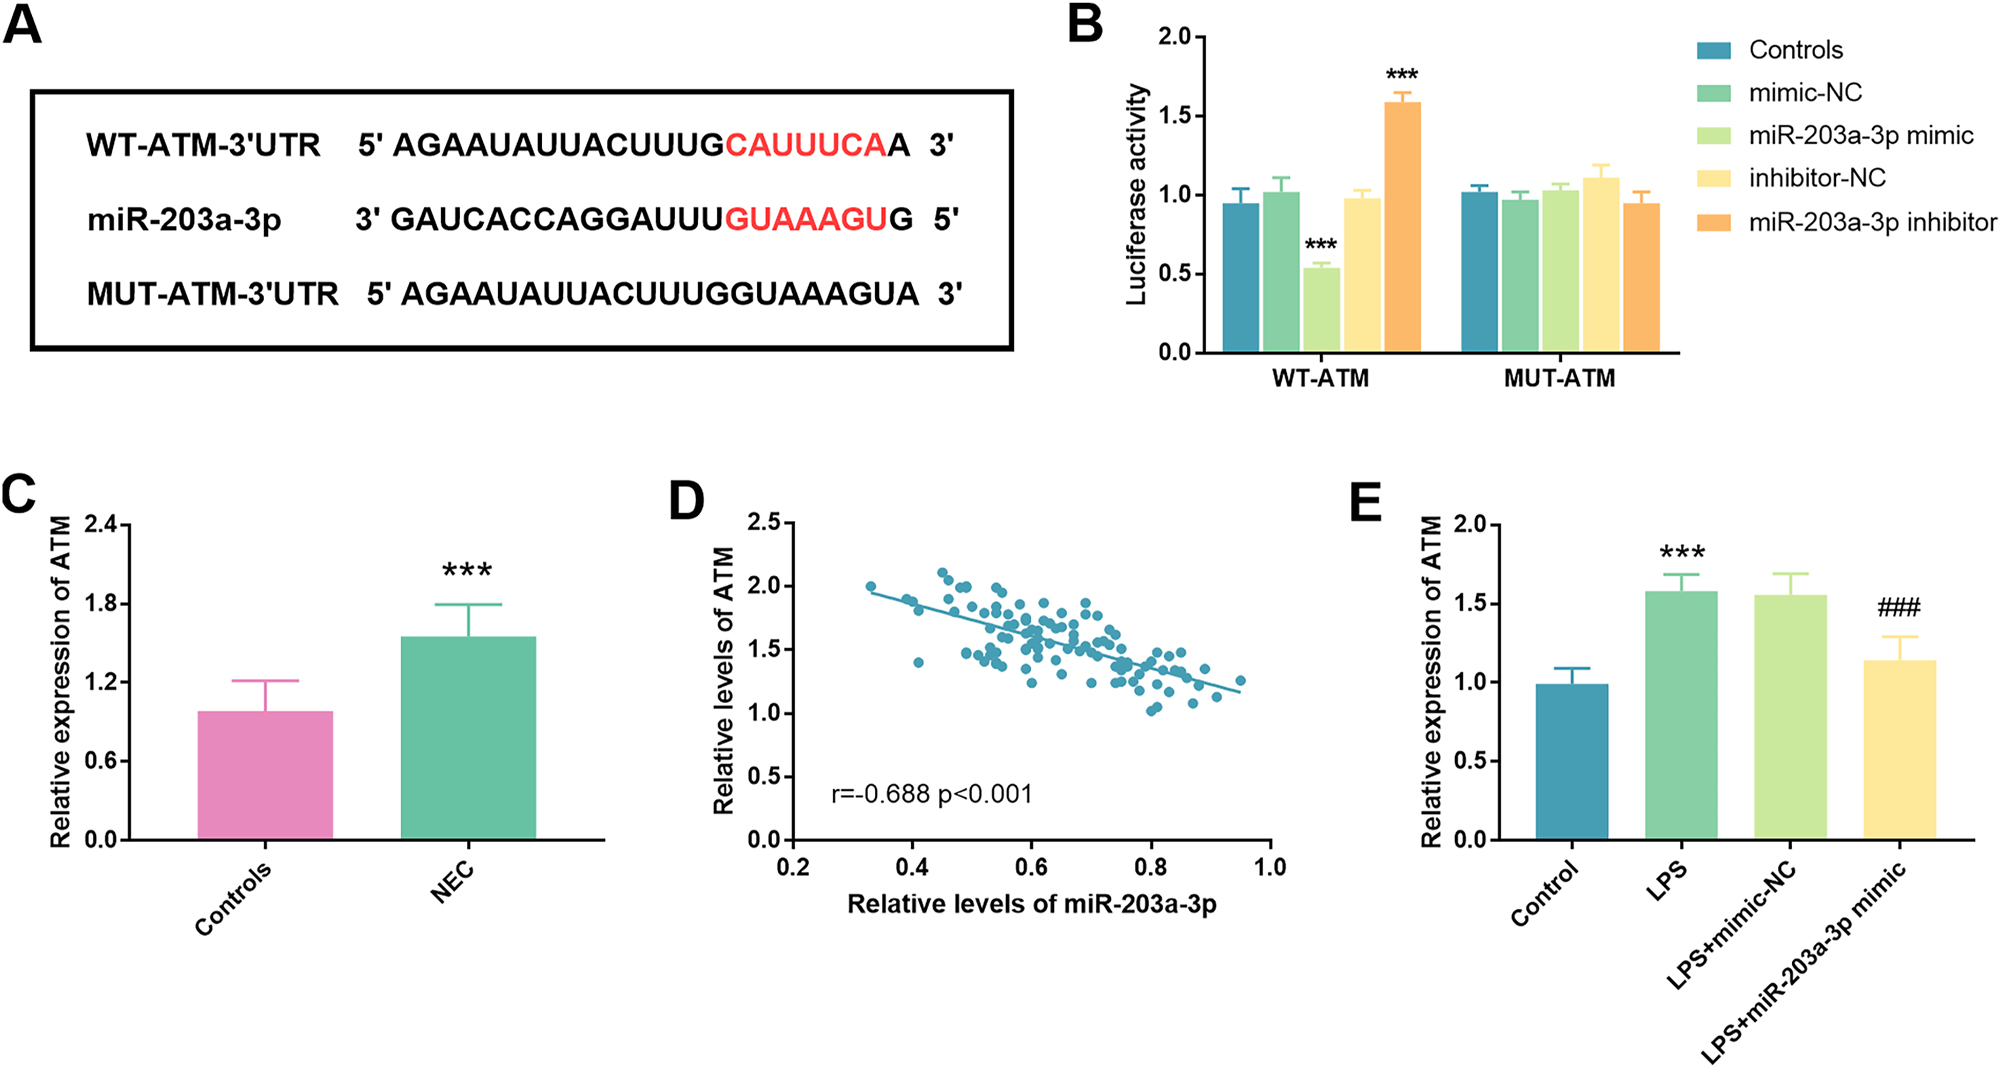
Illustration of ATM targeting by miR-203a-3p. A. The binding sites of miR-203a-3p and ATM were presented. B. Results from a luciferase assay conducted on FHC cells co-transfected with either ATM-WT or ATM-MUT reporter plasmid in conjunction with miR-203a-3p mimic or inhibitor. C. Measurement of the relative abundances of ATM in the serum of neonates with NEC and controls. D. Identification of a statistically significant negative correlation between miR-203a-3p and ATM, evidenced by a correlation coefficient of r=−0.688 (p<0.001). E. In LPS-treated cells, a notable increase in ATM expression was observed relative to controls, a phenomenon that was effectively mitigated upon transfection with miR-203a-3p mimic (NEC: Necrotizing enterocolitis; ATM: Ataxia telangiectasia mutated; ***: p<0.001 against mimic-NC/inhibitor-NC/controls; ###: p<0.001 against LPS+mimic-NC).
Discussion
NEC is characterized by intestinal inflammation that precipitates bacterial invasion, leading to cellular damage and death within the intestinal tract [16]. Due to the atypical early symptoms, the insidious onset of NEC often results in misdiagnosis or underdiagnosis [17]. Among those who survive postoperative interventions, many endure complications such as wound infections, intestinal stenosis, obstruction, and short bowel syndrome [18]. Consequently, the investigation of pathogenetic mechanisms underlying NEC, is of paramount importance for enhancing prevention and treatment strategies in clinical practice.
To investigate NEC conditions, an in vitro model was established using FHC cells exposed to LPS. It is well established that LPS, which is a component of Gram-negative bacteria, serves as a significant trigger for NEC [19]. This research revealed that the levels of miR-203a-3p were substantially declined in neonates with NEC, displaying a notable diagnostic value for discriminating neonates with NEC from those with non-NEC. Furthermore, overexpression of miR-203a-3p not only repressed cell apoptosis and inflammatory indicators but also facilitated cell viability and antioxidant enzyme activity in LPS-triggered cells.
A substantial body of evidence has underscored the implication of miR-203a-3p in the etiology of diverse inflammatory disorders, including neuroinflammatory conditions, tumor-associated inflammatory responses, and ulcerative colitis [20], [21], [22]. Xu et al. emphasized that hucMSC-Ex carrying miR-203a-3p.2 inhibited macrophage pyroptosis during the inflammatory response, contributing to the amelioration of colitis [23]. Notably, in neonates with NEC, miR-203a-3p was distinctly attenuated, a finding supported by bioinformatic analysis, which suggests its potential as an important index for the detection and management of NEC [15]. In our investigation, a marked reduction of serum miR-203a-3p levels was observed among neonates with NEC compared to their non-NEC counterparts. What’s more, the ROC curve analysis revealed that serum miR-203a-3p displayed high diagnostic performance for identifying neonates with NEC, indicating its potential utility as a screening biomarker. Furthermore, miR-203a-3p emerged as an independent risk factor for the onset of NEC among neonates.
An analysis of data derived from the miRPathDB, miRDB, and miRWalk databases has illuminated that ATM is directly regulated by miR-203a-3p. Following this discovery, the potential functional and pathway analyses were performed utilizing GO and KEGG enrichment assessments. The functional roles of these genes predominantly align with BP of regulation of GTPase activity; CC of cation channel complex; and MF of diacylglycerol kinase activity. It was demonstrated that miR-203a-5p targets mainly concentrated in the inflammatory-related pathway and proteins.
ATM has been implicated in the onset and formation of numerous inflammatory diseases, such as colitis [24], 25]. Our findings suggested that ATM may serve as a potential target for miR-203a-3p, revealing a negative correlation between their expression levels. Notably, serum samples from neonates with NEC exhibited significantly elevated levels of ATM. Moreover, in an NEC cell model transfected with the miR-203a-3p mimic, ATM expression was distinctly diminished. These findings underscored the notion that ATM played a pivotal role in both the initiation and progression of NEC.
While our study provides novel insights, several limitations should be acknowledged. Firstly, the cohort were recruited from a single institution, which may limit generalizability. Secondly, the LPS-induced FHC cell model does not fully replicate the complex pathophysiology of NEC, particularly the microbiome-host interactions seen in vivo. Thirdly, although the overall sample size met statistical power requirements, subgroup analyses may benefit from larger validation cohorts. Lastly, while we identified ATM as a target, further studies are needed to elucidate downstream signaling pathways in NEC progression.
In summary, miR-203a-3p was expressed at diminished levels in the pathogenesis of NEC. An increase in miR-203a-3p expression appeared to impede the progression of NEC by attenuating cell apoptosis, reducing inflammatory indicators, and enhancing both cell viability and the redox-stress response through the regulation of ATM.
-
Research ethics: The study was performed in line with the principles of the Declaration of Helsinki. The study had obtained the approval of the Ethic Committee of Maternal and Child Health Hospital of Hubei Province (No. 2021IECXM015, on April 28, 2021).
-
Informed consent: All subjects’ legal guardians have given informed consent.
-
Author contributions: Conceptualization, F.Z., Z.J., W.L. and H.L.; Data curation, Z.J. and W.L.; Formal analysis, W.L.; Funding acquisition, H.L.; Investigation, Z.J. and W.L.; Methodology, F.Z. and Z.J.; Project administration, H.L.; Resources, F.Z. and Z.J.; Software, W.L.; Supervision, H.L.; Validation, Z.J. and W.L.; Visualization, F.Z. and Z.J.; Roles/Writing – original draft, F.Z. and Z.J.; Writing – review & editing, H.L.
-
Use of Large Language Models, AI and Machine Learning Tools: Not applicable.
-
Conflict of interest: There is no conflict of interest in this study.
-
Research funding: No funding was received to assist with the preparation of this work.
-
Data availability: The datasets used and/or analysed during the current study are available from the corresponding author on reasonable request.
References
1. Choi, G, Je, BK, Kim, YJ. Gastrointestinal emergency in neonates and infants: a pictorial essay. Korean J Radiol 2022;23:124–38. https://doi.org/10.3348/kjr.2021.0111.Suche in Google Scholar PubMed PubMed Central
2. Xu, L, Barrett, JG, Peng, J, Li, S, Messadi, D, Hu, S. ITGAV promotes the progression of head and neck squamous cell carcinoma. Curr Oncol 2024;31:1311–22. https://doi.org/10.3390/curroncol31030099.Suche in Google Scholar PubMed PubMed Central
3. Kum, VTL, Chung, PHY, Wong, KKY. Quality of life in long-term survivors of surgical necrotizing enterocolitis. J Pediatr Surg 2024;59:553–6. https://doi.org/10.1016/j.jpedsurg.2023.11.023.Suche in Google Scholar PubMed
4. Canvasser, J, Patel, RM, Pryor, E, Green, L, Hintz, SR, Fagan, M, et al.. Long-term outcomes and life-impacts of necrotizing enterocolitis: a survey of survivors and parents. Semin Perinatol 2023;47:151696. https://doi.org/10.1016/j.semperi.2022.151696.Suche in Google Scholar PubMed PubMed Central
5. Tai, IC, Huang, YC, Lien, RI, Huang, CG, Tsao, KC, Lin, TY. Clinical manifestations of a cluster of rotavirus infection in young infants hospitalized in neonatal care units. J Microbiol Immunol Infect 2012;45:15–21. https://doi.org/10.1016/j.jmii.2011.09.023.Suche in Google Scholar PubMed
6. Goncalves-Ferri, WA, Ferreira, CHF, Couto, LCA, Souza, TR, de Castro Peres, T, Carmona, F, et al.. Low technology, mild controlled hypothermia for necrotizing enterocolitis treatment: an initiative to improve healthcare to preterm neonates. Eur J Pediatr 2021;180:3161–70. https://doi.org/10.1007/s00431-021-04014-1.Suche in Google Scholar PubMed
7. Bazacliu, C, Neu, J. Necrotizing enterocolitis: long term complications. Curr Pediatr Rev 2019;15:115–24. https://doi.org/10.2174/1573396315666190312093119.Suche in Google Scholar PubMed
8. Saliminejad, K, Khorram Khorshid, HR, Soleymani Fard, S, Ghaffari, SH. An overview of microRNAs: biology, functions, therapeutics, and analysis methods. J Cell Physiol 2019;234:5451–65. https://doi.org/10.1002/jcp.27486.Suche in Google Scholar PubMed
9. Hao, P, Yue, F, Xian, X, Ren, Q, Cui, H, Wang, Y. Inhibiting effect of MicroRNA-3619-5p/PSMD10 axis on liver cancer cell growth in vivo and in vitro. Life Sci 2020:254117632. https://doi.org/10.1016/j.lfs.2020.117632.Suche in Google Scholar PubMed
10. Jiang, Y, Xu, X, Xiao, L, Wang, L, Qiang, S. The role of microRNA in the inflammatory response of wound healing. Front Immunol 2022:13852419. https://doi.org/10.3389/fimmu.2022.852419.Suche in Google Scholar PubMed PubMed Central
11. Iantomasi, T, Romagnoli, C, Palmini, G, Donati, S, Falsetti, I, Miglietta, F, et al.. Oxidative stress and inflammation in osteoporosis: molecular mechanisms involved and the relationship with microRNAs. Int J Mol Sci 2023;24. https://doi.org/10.3390/ijms24043772.Suche in Google Scholar PubMed PubMed Central
12. Zou, D, Hu, F, Zhou, Q, Xu, X. miRNA-301 as a molecule promoting necrotizing enterocolitis by inducing inflammation. Acta Biochim Pol 2023;70:905–10. https://doi.org/10.18388/abp.2020_6806.Suche in Google Scholar PubMed
13. Li, W, Huang, X, Bi, D. miRNA-21 plays an important role in necrotizing enterocolitis. Arch Med Sci 2022;18:406–12. https://doi.org/10.5114/aoms.2019.88013.Suche in Google Scholar PubMed PubMed Central
14. Liu, H, Wang, YB. Systematic large-scale meta-analysis identifies miRNA-429/200a/b and miRNA-141/200c clusters as biomarkers for necrotizing enterocolitis in newborn. Biosci Rep 2019;39. https://doi.org/10.1042/bsr20191503.Suche in Google Scholar PubMed PubMed Central
15. Zhao, J, Yin, L, He, L. The MicroRNA landscapes profiling reveals potential signatures of necrotizing enterocolitis in infants. J Comput Biol 2020;27:30–9. https://doi.org/10.1089/cmb.2019.0183.Suche in Google Scholar PubMed
16. Duess, JW, Sampah, ME, Lopez, CM, Tsuboi, K, Scheese, DJ, Sodhi, CP, et al.. Necrotizing enterocolitis, gut microbes, and sepsis. Gut Microbes 2023;15:2221470. https://doi.org/10.1080/19490976.2023.2221470.Suche in Google Scholar PubMed PubMed Central
17. Bethell, GS, Hall, NJ. Recent advances in our understanding of NEC diagnosis, prognosis and surgical approach. Front Pediatr 2023:111229850. https://doi.org/10.3389/fped.2023.1229850.Suche in Google Scholar PubMed PubMed Central
18. Vallant, N, Haffenden, V, Peatman, O, Khan, H, Lee, G, Thakkar, H, et al.. Outcomes for necrotising enterocolitis (NEC) in babies born at the threshold of viability: a case-control study. BMJ Paediatr Open 2022;6. https://doi.org/10.1136/bmjpo-2022-001583.Suche in Google Scholar PubMed PubMed Central
19. Hackam, DJ, Sodhi, CP. Toll-like receptor-mediated intestinal inflammatory imbalance in the pathogenesis of necrotizing enterocolitis. Cell Mol Gastroenterol Hepatol 2018;6:229–38 e1. https://doi.org/10.1016/j.jcmgh.2018.04.001.Suche in Google Scholar PubMed PubMed Central
20. Nguyen, HD, Jo, WH, Hoang, NHM, Kim, MS. Curcumin-attenuated TREM-1/DAP12/NLRP3/Caspase-1/IL1B, TLR4/NF-kappaB pathways, and tau hyperphosphorylation induced by 1,2-Diacetyl benzene: an in vitro and in silico study. Neurotox Res 2022;40:1272–91. https://doi.org/10.1007/s12640-022-00535-1.Suche in Google Scholar PubMed
21. Fahim, SA, Abdullah, MS, Espinoza-Sanchez, NA, Hassan, H, Ibrahim, AM, Ahmed, SH, et al.. Inflammatory breast carcinoma: elevated microRNA miR-181b-5p and reduced miR-200b-3p, miR-200c-3p, and miR-203a-3p expression as potential biomarkers with diagnostic value. Biomolecules 2020;10. https://doi.org/10.3390/biom10071059.Suche in Google Scholar PubMed PubMed Central
22. Lu, C, Zhang, X, Luo, Y, Huang, J, Yu, M. Identification of CXCL10 and CXCL11 as the candidate genes involving the development of colitis-associated colorectal cancer. Front Genet 2022:13945414. https://doi.org/10.3389/fgene.2022.945414.Suche in Google Scholar PubMed PubMed Central
23. Xu, Y, Tang, X, Fang, A, Yan, J, Kofi Wiredu Ocansey, D, Zhang, X, et al.. HucMSC-Ex carrying miR-203a-3p.2 ameliorates colitis through the suppression of caspase11/4-induced macrophage pyroptosis. Int Immunopharmacol 2022:110108925. https://doi.org/10.1016/j.intimp.2022.108925.Suche in Google Scholar PubMed
24. Wei, S, Wu, X, Chen, M, Xiang, Z, Li, X, Zhang, J, et al.. Exosomal-miR-129-2-3p derived from fusobacterium nucleatum-infected intestinal epithelial cells promotes experimental colitis through regulating TIMELESS-Mediated cellular senescence pathway. Gut Microbes 2023;15:2240035. https://doi.org/10.1080/19490976.2023.2240035.Suche in Google Scholar PubMed PubMed Central
25. Westbrook, AM, Schiestl, RH. Atm-deficient mice exhibit increased sensitivity to dextran sulfate sodium-induced colitis characterized by elevated DNA damage and persistent immune activation. Cancer Res 2010;70:1875–84. https://doi.org/10.1158/0008-5472.can-09-2584.Suche in Google Scholar
© 2025 the author(s), published by De Gruyter, Berlin/Boston
This work is licensed under the Creative Commons Attribution 4.0 International License.