Sonographic surveillance and perinatal outcomes among pregnancies with periviable fetal growth restriction
-
Felicia V. LeMoine
 ,
Angela C. Ranzini
,
Angela C. Ranzini

Abstract
Objectives
This study compared adverse perinatal outcomes between pregnancies complicated by periviable fetal growth restriction (pFGR) that underwent weekly sonographic surveillance vs. serial growth surveillance.
Methods
In this retrospective cohort study, pFGR was defined as a 22 0/7–27 6/7-week singleton, <500 g, and ≤10 % for gestational age. The surveillance group initiated weekly Doppler surveillance while the serial growth (SG) group underwent growth assessment every 3–4 weeks between 22 and 27 6/7 weeks. Adverse perinatal outcomes were compared.
Results
Eighty-one (36.2 %) underwent weekly Doppler surveillance. Chronic hypertension (18.5 % vs. 9.1 %, p=0.04), a prior history of fetal demise (8.6 % vs. 2.1 %, p=0.02), and an estimated fetal weight <3 % (22.2 % vs. 10.5 %, p=0.02) and any abnormal umbilical artery Doppler pattern at diagnosis (25.8 % vs. 12.9 %, p=0.046) occurred more frequently in the weekly Doppler surveillance group than the SG group. Despite no difference in perinatal death, the surveillance group demonstrated a higher rate of obstetric (65.4 % vs. 42.7 %, p<0.05) and neonatal (60.8 % vs. 28.4 %, p<0.05) adverse outcome composites compared to the SG group.
Conclusions
The surveillance group experienced increased rates of obstetric and neonatal morbidity without difference in perinatal death though interpretation is limited by the observational nature of this study.
Introduction
Identification of fetuses with pathologically decreased in utero growth has remained a challenge in the field of prenatal diagnosis. Classifications have been proposed to aid in the differentiation between non-pathologically small fetuses (i.e., constitutionally-small fetuses) and fetuses with pathologically decreased growth (i.e., fetal growth restriction [FGR]) [1], 2].
Population-based studies have revealed that perinatal mortality significantly increases with EFW<50 % for gestational age (GA), or below +1 standard deviation (SD) from the mean, with the highest risk for perinatal mortality demonstrated <3 % for GA, or approximately −2 to −2.5 SD below the mean [3], [4], [5], [6]. Constitutionally-small fetuses and FGR have also been associated with a number of adverse perinatal outcomes. Adverse obstetric outcomes include hypertensive disorders of pregnancy (HDP), placental abruption, cesarean delivery (CD), and preterm delivery (PTD) [7], [8], [9], [10], [11], [12], [13]. Neonatal adverse outcomes include intrauterine fetal demise (IUFD), hypoglycemia, respiratory distress syndrome (RDS), hyperbilirubinemia, sepsis, hypocalcemia, hypothermia, intraventricular hemorrhage (IVH), necrotizing enterocolitis (NEC), neonatal seizures and death [14], [15], [16], [17], [18]. Adverse outcomes such as HDP, PTD, and neonatal adverse outcomes secondary to chronic fetal hypoxia are more likely in FGR diagnosed <32 weeks [19], [20], [21], [22], [23], [24], [25], [26], [27].
Previous studies have investigated the utility of fetal Doppler indices and biomarkers to monitor fetal status and predict obstetric and neonatal prognosis [21], 25], [28], [29], [30]. These studies have shown that an elevated umbilical artery (UA) Doppler pulsatility index (PI)≥95 % for GA is associated with worse prognosis. Prognosis progressively worsens when absent end diastolic flow (AEDF) and/or reversed end diastolic flow (REDF) of the UA is identified [21], 25], [28], [29], [30]. These findings are useful to guide the management of pregnancies beyond the limits of viability or, more specifically, beyond the limits at which active management of the pregnancy (i.e., delivery and neonatal support) would be considered. The clinical utility of these findings can be questioned near the limits of viability when delivery for fetal benefit may be futile if the GA and/or birthweight preclude neonatal resuscitative care. At the limits of periviability, often GA between 22 and 25 weeks and a birthweight (prenatally, EFW)<400 g, there is a dearth of evidence to guide the timing of initiation or frequency of UA Doppler surveillance among pregnancies with constitutionally-small fetuses or FGR [2], [30], [31], [32]. Figueras et al. (2014) proposed a management strategy for early-onset FGR; however, recommendations <26 weeks were omitted [28].
There is no standardized practice for timing and frequency of UA Doppler surveillance among pregnancies with constitutionally-small fetuses and FGR diagnosed at or below periviability at the study institutions. Management of pregnancies complicated by perviable FGR (pFGR) 1) an EFW<500 g and <10 % for GA and 2) a GA between 22 0/7 and 27 6/7 weeks has been individualized based on patient-specific characteristics. Management of pFGR has typically involved either initiation of weekly UA Doppler surveillance at pFGR diagnosis (irrespective of GA and EFW at diagnosis) or initiation of serial fetal growth assessments (every 3–4 weeks) until the fetus reaches an EFW≥500 g – a cutoff above which neonatal resuscitative efforts were more successfully implemented and neonatal prognosis improved after accounting for EFW variance from birthweight. This study aimed to compare antenatal surveillance strategies by comparing perinatal death and adverse outcomes between pregnancies with pFGR that underwent weekly UA Doppler surveillance between 22 0/7–27 6/7 weeks gestation vs. pregnancies that underwent serial fetal growth assessments during the same time frame.
Materials and methods
A retrospective cohort study was performed between January 2017 and June 2023 at two tertiary care centers in Cleveland, Ohio – The MetroHealth System and University Hospitals Cleveland Medical Center. IRB approvals were obtained from The MetroHealth IRB (IRB#00000382) and University Hospitals IRB (IRB#20230844). All complete (CPT code 76805), detailed fetal (CPT code 76811) and follow-up (CPT code 76816) obstetric ultrasounds were evaluated. Pregnant individuals with singleton gestations complicated by periviable fetal growth restriction (pFGR) were included. pFGR was defined as 1) EFW<500 g and <10 % for GA and 2) a GA between 22 0/7 and 27 6/7 weeks by best obstetric estimate. An EFW<10 % for GA was selected to represent growth restriction [1] as this was institutional practice. Classification of growth restriction by parameters of the Delphi consensus [2] was not standard institutional practice. Pregnancies were excluded if 1) delivery occurred outside of the included institutions, 2) gestational dating was confirmed at ≥16 weeks gestation, and/or 3) the fetus had a known structural or genetic anomaly. Pregnancies with abnormal cell-free DNA prenatal screening were also excluded. Among individuals with>1 pregnancy who met eligibility criteria within the study period, the earliest pregnancy was selected for inclusion. During the study period, neonatal resuscitation was offered at both institutions beginning at 22 0/7 weeks.
The primary outcome was a perinatal death which was comprised of IUFD or neonatal death prior to hospital discharge (NND). Secondary outcomes included IUFD, NND, an adverse neonatal outcome composite and its individual components, and an adverse obstetric outcome composite and its individual components. A pregnancy met criteria for the adverse neonatal adverse outcome composite if any one of the following were diagnosed in the neonate prior to hospital discharge: hypoglycemia, hypothermia, IVH, NEC, RDS, hyperbilirubinemia, hypocalcemia, seizures, and sepsis. A pregnancy met criteria for the adverse obstetric outcome composite if any one of the following were diagnosed prior to hospital discharge: HDP, hemolysis, elevated liver enzymes, low platelets (HELLP) syndrome, placental abruption, PTD, classical CD, and postpartum hemorrhage (PPH).
Baseline characteristics, prenatal and delivery outcomes, ultrasound findings, neonatal characteristics, the primary outcome, and secondary outcomes were compared between pregnancies that initiated weekly UA Doppler surveillance between 22 0/7 and 27 6/7 weeks (surveillance group) and pregnancies that underwent serial fetal growth surveillance without weekly UA Doppler surveillance between 22 0/7 and 27 6/7 weeks (serial growth group, SG group). Allocation to the surveillance group vs. the SG group was at the clinical discretion of the performing provider in conjunction with patient counseling and shared decision making. UA Doppler surveillance ≥28 weeks in the SG group was considered standard of care for the purposes of this study and did not alter the study group allocation.
Counts (%) and medians (interquartile ranges) were used, where applicable, for population description. Categorical characteristics and primary and secondary outcomes were compared between the surveillance and SG groups using Chi-squared tests. ANOVA and Kruskal-Wallis test were also used for comparison of parametric and non-parametric continuous variables, respectively. A p value of<0.05 was deemed significant. Post-hoc exploratory analyses were conducted. Uni- and multivariate, binomial logistic regression were performed to assess the association between weekly UA surveillance on the primary outcome and secondary outcome composites when adjusted for maternal history of pre-existing hypertension (CHTN) and a history of IUFD. Using Stata18 statistical software [33], time to delivery was analyzed via survival analysis between the surveillance and SG groups using competing risk regression with livebirth defined as the terminal event, stillbirth the competing event, and no instances of censoring.
Results
Between January 2017 and August 2023, 447 pregnancies met criteria for pFGR. Two hundred twenty-three pregnancies met exclusion criteria which resulted in 224 pregnancies (50.1 %) for final analyses. Eighty-one (36.2 %) pregnancies were in the surveillance group (Figure 1). In the surveillance group, weekly surveillance began at a median GA of 23 weeks (22, 24.5) and a median EFW of 428 g (349, 482.5).
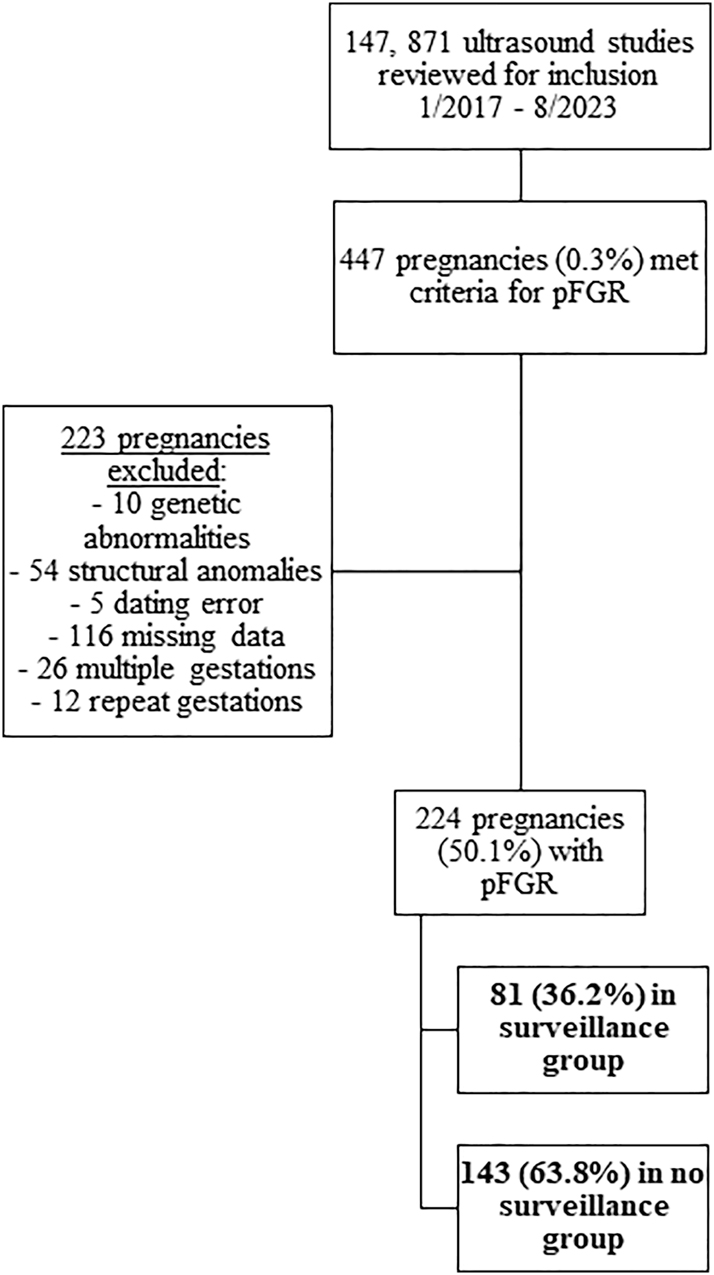
Study population selection.
There was no difference in maternal demographics between the surveillance and SG groups (Table 1). CHTN (18.5 % vs. 9.1 %, p=0.04) and a prior history of IUFD (8.6 % vs. 2.1 %, p=0.02) occurred more frequently in the surveillance group than the SG group (Table 1). There was no difference in the GA at pFGR diagnosis between the groups (Table 1). More ultrasounds were performed in the surveillance group (11 ultrasounds [6], 14]) when compared to the SG group (6 ultrasounds [3], 9]; p<0.05; Table 1). Aspirin had been prescribed more often in the surveillance group than the SG group (34.6 % vs. 18.9 %, p<0.05, respectively). First trimester pregnancy-associated plasma protein-A (PAPP-A) was performed in 42 % (94/224) of the study population with 49.4 % (40/81) performance in the surveillance group and 37.8 % (54/143) performance in SG group (p=0.09). Multiples of the median (MoM) for first trimester PAPP-A were lower in the surveillance group (0.6 MoM [0.4, 1]) than the SG group (0.8 MoM [0.4, 1.3], p=0.02; Table 1). Second trimester alpha-fetoprotein (AFP) was performed in 14.7 % (33/224) of the study population with less frequent performance in the surveillance group than the SG group (7.4 % vs. 18.9 %, p=0.03). MoM for AFP were higher in the surveillance group (1.6 MoM [1.2, 3.3]) than the SG group (0.8 MoM [0.6, 1.1], p<0.05).
Baseline characteristics, prenatal findings, and delivery outcomes of the study population.
| All (n=224) | Surveillance (n=81, 36.2 %) | Serial growth (n=143, 63.8 %) | p-Value | |
|---|---|---|---|---|
| Maternal demographics | ||||
|
|
||||
| BMI at first prenatal visit, BMI, kg/m2 | 27.8 (22.9, 33.5) | 30.5 (23.7, 35.2) | 26.9 (22.7, 33.1) | 0.10 |
| BMI at delivery, kg/m2 | 31.8 (27.8, 37.1) | 33.4 (28.8, 37.6) | 31 (27.4, 36.4) | 0.25 |
| Change in BMI from first prenatal visit to delivery | 3.6 (1.7, 5.3) | 3 (1.5, 4.7) | 3.8 (2.3, 5.4) | 0.07 |
| Insurance type | 0.61 | |||
| Private | 56 (25 %) | 23 (28.4 %) | 33 (23.1 %) | |
| Government-based | 153 (68.3 %) | 52 (64.2 %) | 101 (70.6 %) | |
| Other | 15 (6.7 %) | 6 (7.4 %) | 9 (6.3 %) | |
|
|
||||
| Maternal medical history | ||||
|
|
||||
| Hypertension | 28 (12.5 %) | 15 (18.5 %) | 13 (9.1 %) | 0.04 |
| Pre-gestational diabetes | 11 (4.9 %) | 7 (8.6 %) | 4 (2.8 %) | 0.05 |
| Substance use | 62 (27.7 %) | 20 (24.7 %) | 42 (29.4 %) | 0.45 |
| Tobacco use | 37 (16.5 %) | 11 (13.6 %) | 42 (29.4 %) | 0.37 |
| Gravida | 2 (1, 4) | 2 (1, 4) | 2 (1, 4) | 0.98 |
| Parity | 1 (0, 2) | 0 (0, 1) | 1 (0, 2) | 0.12 |
| History of preterm delivery | 35 (15.6 %) | 14 (17.3 %) | 21 (14.7 %) | 0.61 |
| Medically-indicated | 18 (51.4 %) | 9 (64.3 %) | 9 (42.9 %) | 0.21 |
| History of FGR | 11 (4.9 %) | 6 (7.4 %) | 5 (3.5 %) | 0.19 |
| History of HDP | 22 (9.8 %) | 8 (13.1 %) | 14 (9.8 %) | 0.98 |
| History of IUFD | 10 (4.5 %) | 7 (8.6 %) | 3 (2.1 %) | 0.02 |
|
|
||||
| Prenatal findings in index pregnancy | ||||
|
|
||||
| Number of ultrasounds performed | 8 (5, 12) | 11 (7, 15) | 6 (3, 10) | <0.05 |
| Aspirin prescribed | 55 (24.6 %) | 28 (34.6 %) | 27 (18.9 %) | <0.05 |
| First trimester PAPP-A MoM | 0.7 (0.4, 1.2) | 0.6 (0.4, 1) | 0.8 (0.4, 1.3) | 0.02 |
| Second trimester AFP MoM | 0.8 (0.7, 1.4) | 1.6 (1.2, 3.3) | 0.8 (0.6, 1.1) | <0.05 |
| GA at FGR diagnosis (weeks) | 20 (19, 22) | 20 (19, 22) | 22 (19, 22) | 0.79 |
| Oligohydramnios | 9 (4 %) | 4 (4.9 %) | 5 (3.5 %) | 0.60 |
|
|
||||
| Delivery outcomes in index pregnancy | ||||
|
|
||||
| Antenatal corticosteroids prior to delivery among preterm deliveries | 51 (65.4 %) | 35 (76.1 %) | 16 (50 %) | 0.02 |
| 1 dose | 3 (5.9 %) | 0 | 3 (18.8 %) | 0.01 |
| Completed course | 48 (94.1 %) | 35 (100 %) | 13 (81.3 %) | 0.23 |
| GA at delivery (weeks) | 37 (33.9, 38.8) | 34 (27, 37.5) | 37.2 (37, 39) | <0.05 |
| Cesarean delivery | 92 (41.1 %) | 46 (56.8 %) | 46 (32.2 %) | <0.05 |
| Low transverse | 67 (72.8 %) | 29 (63 %) | 38 (82.6 %) | 0.03 |
| Classical | 23 (25 %) | 16 (34.8 %) | 7 (15.2 %) | 0.03 |
| Other | 2 (2.2 %) | 1 (2.2 %) | 1 (2.2 %) | 1 |
| Indication for cesarean | 0.24 | |||
| Labor dystocia | 6 (6.5 %) | 1 (2.2 %) | 5 (10.9 %) | 0.09 |
| Fetal malpresentation | 16 (17.4 %) | 8 (17.4 %) | 8 (17.4 %) | 1 |
| Elective repeat | 17 (18.5 %) | 7 (15.2 %) | 10 (21.7 %) | 0.42 |
| Prior classical | 5 (5.4 %) | 1 (2.2 %) | 4 (8.7 %) | 0.17 |
| Non-reassuring fetal status | 41 (44.6 %) | 25 (54.3 %) | 16 (34.8 %) | 0.06 |
| Elective primary | 1 (1.1 %) | 1 (2.2 %) | 0 | 0.31 |
| Other | 6 (6.5 %) | 3 (6.5 %) | 3 (6.5 %) | 1 |
-
ANOVA or Kruskal Wallis tests were used to compare parametric and non-parametric continuous variables, respectively. Chi-square test was performed to compare quantitative variables. BMI, body mass index; FGR, fetal growth restriction; HDP, hypertensive disorder of pregnancy; IUFD, intrauterine fetal demise; PAPP-A, pregnancy-associated plasma protein-A; MoM, multiple of the median; AFP, alpha-fetoprotein; GA, gestational age. Bolded values indicate significant (p<0.05) differences between surveillance and serial growth groups.
Delivery occurred at an earlier GA in the surveillance group (34 weeks [27, 37.5]) than the SG group (37.2 weeks [37, 39], p<0.05; Table 1) which also correlated to a higher rate of PTD (56.8 % vs. 22.4 %, p<0.05, respectively). PTDs in the surveillance group were more likely to receive a course of antenatal corticosteroids when compared to those in the SG group (76.1 % vs. 50 %, p=0.02). Among all PTDs, the proportion of deliveries for fetal indications did not differ between the surveillance and SG groups when stratified by GA at delivery (Table 2). CD occurred more often in the surveillance group (56.8 %) than the SG group (32.2 %, p<0.05). Of the pregnancies culminating in CD, a larger proportion in the surveillance group received a classical hysterotomy (34.8 % vs. 15.2 %, p=0.03; Table 1).
Preterm deliveries that occurred for any one of the following indications a) abnormal fetal UA Dopplers, b) non-reassuring fetal tracing (non-laboring), or c) IUFD.
| All (n=78) | Surveillance (n=46) | Serial growth (n=32) | p-Value | |
|---|---|---|---|---|
| ≤28 weeks | 25 (32.1 %) | 15 (19.2 %) | 10 (12.8 %) | 0.32 |
| ≤32 weeks | 29 (37.2 %) | 18 (23.1 %) | 11 (14.1 %) | 0.25 |
| ≤34 weeks | 34 (43.6 %) | 21 (26.9 %) | 13 (16.7 %) | 0.31 |
| ≤36 weeks | 35 (44.9 %) | 22 (28.2 %) | 13 (16.7 %) | 0.53 |
-
ANOVA or Kruskal Wallis tests were used to compare parametric and non-parametric continuous variables, respectively. Chi-square test was performed to compare quantitative variables. UA, umbilical artery; IUFD, intrauterine fetal demise.
There was no difference in the distribution of neonatal sex within each group (Supplementary Table 1). Neonates born to pregnancies within the surveillance group had lower birthweights (1,935 g (665, 2,582.5) vs. 2,560 g ([2,130, 2,915], p<0.05), were more likely to be admitted to the neonatal intensive care unit (58.1 % vs. 21.6 %, p<0.05), and were less likely to be discharged from the hospital without a co-morbid diagnosis (23.9 % vs. 53.9 %, p<0.05). Among the neonates admitted to the neonatal intensive care unit, there was no difference in the length of stay between the groups (Supplementary Table 1).
There was no difference in the primary outcome – perinatal death – or in IUFD or NND between the surveillance and SG groups (Table 3). The neonatal adverse outcome composite occurred more frequently in the surveillance group (60.8 %) than the SG group (28.4 %, p<0.05; Table 3). Hypoglycemia (24.3 % vs. 11.2 %, p=0.01), RDS (41.9 % vs. 9.7 %, p<0.05), hyperbilirubinemia (36.5 % vs. 17.2 %, p<0.05), and hypocalcemia (5.4 % vs. 0.7 %, p=0.04) were diagnosed more often among neonates of the surveillance group than the SG group (Table 3). The obstetric adverse outcome composite occurred more frequently in the surveillance group (65.4 %) than the SG group (42.7 %, p<0.05; Table 3). Specifically, HDP (45.7 % vs. 25.2 %, p<0.05), PTD (56.8 % vs. 22.4 %, p<0.05) and classical CD (19.8 % vs. 4.9 %, p=0.03) occurred more frequently in the surveillance group than the SG group (Table 3).
Primary and secondary outcomes among the entire population and compared between the surveillance and serial growth groups.
| All | Surveillance | Serial growth | p-Value | |
|---|---|---|---|---|
| Primary outcome | ||||
|
|
||||
| Perinatal death | 25 (11.2 %) | 10 (12.3 %) | 15 (10.5 %) | 0.67 |
| Intrauterine demise | 16 (7.1 %) | 7 (8.6 %) | 9 (6.3 %) | 0.51 |
| Neonatal death prior to hospital discharge | 9 (4.3 %) | 3 (4.1 %) | 6 (4.5 %) | 0.89 |
|
|
||||
| Secondary outcomes | ||||
|
|
||||
| Neonatal outcome composite | 83 (39.9 %) | 45 (60.8 %) | 38 (28.4 %) | <0.05 |
| Hypoglycemia | 33 (15.9 %) | 18 (24.3 %) | 15 (11.2 %) | 0.01 |
| Hypothermia | 3 (1.4 %) | 0 | 3 (2.2 %) | 0.19 |
| IVH | 6 (2.9 %) | 3 (4.1 %) | 3 (2.2 %) | 0.45 |
| NEC | 0 | 0 | 0 | NA |
| RDS | 44 (21.2 %) | 31 (41.9 %) | 13 (9.7 %) | <0.05 |
| Hyperbilirubinemia | 50 (24 %) | 27 (36.5 %) | 23 (17.2 %) | <0.05 |
| Hypocalcemia | 5 (2.4 %) | 4 (5.4 %) | 1 (0.7 %) | 0.04 |
| Seizures | 2 (1 %) | 1 (1.4 %) | 1 (0.7 %) | 0.67 |
| Sepsis | 10 (4.8 %) | 4 (5.4 %) | 6 (4.5 %) | 0.76 |
| Obstetric outcome composite | 114 (50.9 %) | 53 (65.4 %) | 61 (42.7 %) | <0.05 |
| HDP | 73 (32.6 %) | 37 (45.7 %) | 36 (25.2 %) | <0.05 |
| Gestational hypertension | 25 (34.2 %) | 9 (24.3 %) | 16 (44.4 %) | 0.99 |
| Preeclampsia without severe features | 7 (9.6 %) | 4 (10.8 %) | 3 (8.3 %) | 0.24 |
| Preeclampsia with severe features | 41 (56.2 %) | 24 (64.9 %) | 17 (47.2 %) | <0.05 |
| HELLP syndrome | 1 (0.4 %) | 1 (1.2 %) | 2 (1.4 %) | 0.18 |
| Placental abruption | 6 (2.7 %) | 3 (3.7 %) | 3 (2.1 %) | 0.47 |
| PTD | 78 (34.8 %) | 46 (56.8 %) | 32 (22.4 %) | <0.05 |
| Classical CD | 23 (10.3 %) | 16 (19.8 %) | 7 (4.9 %) | 0.03 |
| PPH | 19 (8.5 %) | 8 (9.9 %) | 11 (7.7 %) | 0.57 |
-
ANOVA or Kruskal Wallis tests were used to compare parametric and non-parametric continuous variables, respectively. Chi-square test was performed to compare quantitative variables. IVH, intraventricular hemorrhage; NEC, necrotizing enterocolitis; RDS, respiratory distress syndrome; HDP, hypertensive disorder of pregnancy; HELLP, hemolysis, elevated liver enzymes and low platelets; PTD, preterm delivery; CD, cesarean delivery; PPH, postpartum hemorrhage. Bolded values indicate significant (p<0.05) differences between surveillance and serial growth groups.
Based on univariate analyses and clinical relevance, multivariate logistic regression analysis demonstrated no association between surveillance frequency and perinatal death (Table 4). When adjusted for weekly Doppler surveillance, CHTN, a prior history of IUFD, prescription of low-dose aspirin in index pregnancy, and pre-existing diabetes, this multivariate logistic regression analysis did demonstrate an association between a history of pregnancy-induced hypertension and perinatal death (adjusted odds ratio [aOR] 3.34, 95 % CI 1.00, 10.09, p=0.04). Both weekly Doppler surveillance (aOR 1.95, 95 % CI 1.06, 3.61, p=0.03) and CHTN (aOR 3.51, 95 % CI 1.38, 9.72, p=0.01) were associated with obstetric adverse composite outcome after adjusting for weekly Doppler surveillance, a prior history of IUFD, CHTN, a history of pregnancy-induced hypertension, prescription of low-dose aspirin in index pregnancy, and pre-existing diabetes (Table 4). Neonatal adverse outcome composite was not associated with weekly Doppler surveillance; however, regression analysis demonstrated an association between receipt of antenatal steroids (aOR 7.20, 95 % CI 1.75, 34.5, p=0.01), GA at delivery (aOR 0.72, 95 % CI 0.55, 0.92, p=0.01), and mode of delivery (aOR 2.39, 95 % CI 1.07, 5.33, p=0.03).
Multivariate logistic regression analyses for outcomes of interest.
| aOR | 95 % CI | p-Value | |
|---|---|---|---|
| Primary outcome, perinatal death | |||
|
|
|||
| Weekly Doppler surveillance | 0.78 | (0.27, 1.99) | 0.600 |
| CHTN | 1.98 | (0.57, 6.58) | 0.271 |
| History of IUFD | 1.73 | (0.20, 9.69) | 0.570 |
| Low-dose aspirin prescribed | 0.81 | (0.23, 2.55) | 0.726 |
| History of PIH | 3.34 | (1.00, 10.09) | 0.038 |
| Pre-existing diabetes | 2.96 | (0.67, 11.07) | 0.121 |
|
|
|||
| Obstetric outcome composite | |||
|
|
|||
| Weekly Doppler surveillance | 1.95 | (1.06, 3.61) | 0.033 |
| History of fetal demise | 3.30 | (0.68, 23.85) | 0.167 |
| Pre-existing hypertension | 3.51 | (1.38, 9.72) | 0.011 |
| History of PIH | 2.40 | (0.85, 7.44) | 0.109 |
| Low-dose aspirin prescribed | 1.49 | (0.65, 3.40) | 0.344 |
| Pre-existing diabetes | 4.50 | (1.07, 30.83) | 0.066 |
|
|
|||
| Neonatal outcome composite | |||
|
|
|||
| Weekly Doppler surveillance | 1.71 | (0.77, 3.72) | 0.180 |
| Antenatal receipt of magnesium | 0.38 | (0.07, 1.58) | 0.212 |
| Antenatal steroids | 7.20 | (1.75, 34.5) | 0.008 |
| Gestational age at delivery | 0.72 | (0.55, 0.92) | 0.014 |
| Neonatal birthweight | 1.00 | (0.99, 1.00) | 0.164 |
| Low-dose aspirin prescribed | 1.54 | (0.62, 3.74) | 0.342 |
| Cesarean delivery | 2.39 | (1.07, 5.33) | 0.033 |
-
aOR, adjusted odds ratio; CI, confidence interval; CHTN, chronic hypertension; IUFD, intrauterine fetal demise; PIH, pregnancy-induced hypertension.
Table 5 compares the fetal characteristics and UA Doppler findings between groups at pFGR diagnosis. More severe FGR (EFW<3 %) with abnormal Doppler indices was seen in the surveillance group (22.2 % vs. 10.5 %, p=0.02). Any abnormal UA Doppler finding was seen more frequently in the surveillance group (46.9 %) than the SG group (24.5 %, p<0.05; Tables 5 and 6). Further, severe UA Doppler findings (i.e., persistent REDF) were seen more often in the surveillance group than the SG group (42.1 % vs. 11.4 %, p<0.05; Tables 5 and 6). For all pregnancies with any abnormal UA Doppler index, the median time from worst UA Doppler finding to delivery was 4 weeks ([1, 10.1], Table 6). When stratified by UA Doppler abnormality, there were no differences in the interval from diagnosis of elevated PI, AEDF, or REDF to delivery. The interval (weeks) between diagnosis of intermittent absent end diastolic flow (iAEDF) and delivery was shorter in the surveillance group (1.3 weeks [0.9, 3.4]) than the SG group (12 weeks, p=0.02); however, only one pregnancy met criteria for iAEDF in the SG group. Competing risk regression did not identify differences in time to delivery of a livebirth between groups (p=0.093, Figure 2).
Fetal characteristics and UA Doppler findings at the time of diagnosis of fetal growth restriction, i.e., when the EFW and/or AC measured <10 % for GA.
| All | Surveillance | Serial growth | p-Value | |
|---|---|---|---|---|
| EFW<3 % at diagnosis | 33 (14.7 %) | 18 (22.2 %) | 15 (10.5 %) | 0.02 |
| UA Doppler interrogation performed | 147 (65.6 %) | 62 (76.5 %) | 85 (59.4 %) | <0.05 |
| Abnormal UA Doppler on initial interrogation | 27 (18.4 %) | 16 (25.8 %) | 11 (12.9 %) | 0.046 |
| Elevated | 18 (66.7 %) | 11 (68.8 %) | 7 (63.6 %) | 0.08 |
| Intermittent AEDF | 2 (7.4 %) | 1 (6.3 %) | 1 (9.1 %) | 0.82 |
| AEDF | 6 (22.2 %) | 3 (18.8 %) | 3 (27.3 %) | 0.69 |
| REDF | 1 (3.7 %) | 1 (6.3 %) | 0 | 0.24 |
| EFW<3 % and UA PI>95 % for GA | 17 (7.6 %) | 7 (8.6 %) | 3 (2.1 %) | 0.02 |
-
ANOVA or Kruskal Wallis tests were used to compare parametric and non-parametric continuous variables, respectively. Chi-square test was performed to compare quantitative variables. UA, umbilical artery; EFW, estimated fetal weight; AC, abdominal circumference; GA, gestational age; AEDF, absent end diastolic flow; REDF, reversed end diastolic flow; PI, pulsatility index. Bolded values indicate significant (p<0.05) differences between surveillance and serial growth groups.
UA Doppler findings within the study population and compared between the surveillance and serial growth groups.
| All (n=224) | Surveillance (n=81) | Serial growth (n=143) | p-Value | |
|---|---|---|---|---|
| Worst Doppler classification assigned during pregnancy | ||||
|
|
||||
| Abnormal Dopplersa | 73 (32.6 %) | 38 (46.9 %) | 35 (24.5 %) | <0.05 |
| Elevatedb | 36 (49.3 %) | 10 (26.3 %) | 26 (74.3 %) | <0.05 |
| Intermittent AEDFb | 7 (9.6 %) | 6 (15.8 %) | 1 (2.9 %) | 0.06 |
| Persistent AEDFb | 11 (15.1 %) | 6 (15.8 %) | 5 (13.5 %) | 0.86 |
| Persistent REDFb | 20 (27.4 %) | 16 (42.1 %) | 4 (11.4 %) | <0.05 |
|
|
||||
| Weeks from worst doppler to delivery | ||||
|
|
||||
| All (n=73)c | Surveillance (n=38)c | Serial growth (n=35)c | p-Value | |
|
|
||||
| Any abnormal Doppler finding | 4 (1, 10.1) | 2.8 (1, 6.1) | 6 (1, 13.3) | 0.05 |
| Elevated | 8 (2.2, 14) | 8.3 (5.2, 16.5) | 8 (1.2, 13.3) | 0.50 |
| Intermittent AEDF | 1.4 (1, 7.7) | 1.3 (0.9, 3.4) | 12 | 0.02 |
| Persistent AEDF | 3.5 (2.1, 7.9) | 2.8 (1, 7.2) | 5 (3.3, 12) | 0.47 |
| Reversed EDF | 0.9 (0.2, 3.1) | 1.4 (0.4, 3.8) | 0 (0, 0.75) | 0.09 |
|
|
||||
| Pregnancies with improved UA Doppler trend based on worst Doppler classification | ||||
|
|
||||
| All | 32 (43.8 %) | 16 (42 %) | 16 (45.7 %) | 0.76 |
| Elevated | 22 (61.1 %) | 8 (80 %) | 14 (53.8 %) | 0.15 |
| Intermittent AEDF | 6 (85.7 %) | 5 (83.3 %) | 1 (100 %) | 0.67 |
| Persistent AEDF | 3 (27.3 %) | 2 (33.3 %) | 1 (20 %) | 0.62 |
| Persistent REDF | 1 (4 %) | 1 (6.3 %) | 0 | 0.62 |
-
ANOVA or Kruskal Wallis tests were used to compare parametric and non-parametric continuous variables, respectively. Chi-square test was performed to compare quantitative variables. AEDF, absent end diastolic flow; REDF, reversed end diastolic flow. aAbnormal Dopplers indicates if any umbilical artery (UA) Doppler interrogation performed during the pregnancy was 1) elevated, i.e., >95 % for gestational age, 2) demonstrated intermittent absent end diastolic flow (iAEDF), 3) demonstrated persistent absent end diastolic flow (AEDF) or 4) demonstrated persistent reversed end diastolic flow (REDF). bA pregnancy qualified for these UA Doppler classifications based the worst UA Doppler finding obtained throughout the pregnancy. cThe population size is based on the total number of pregnancies with any classification of abnormal UA Doppler throughout the pregnancy. Bolded values indicate significant (p<0.05) differences between surveillance and serial growth groups.
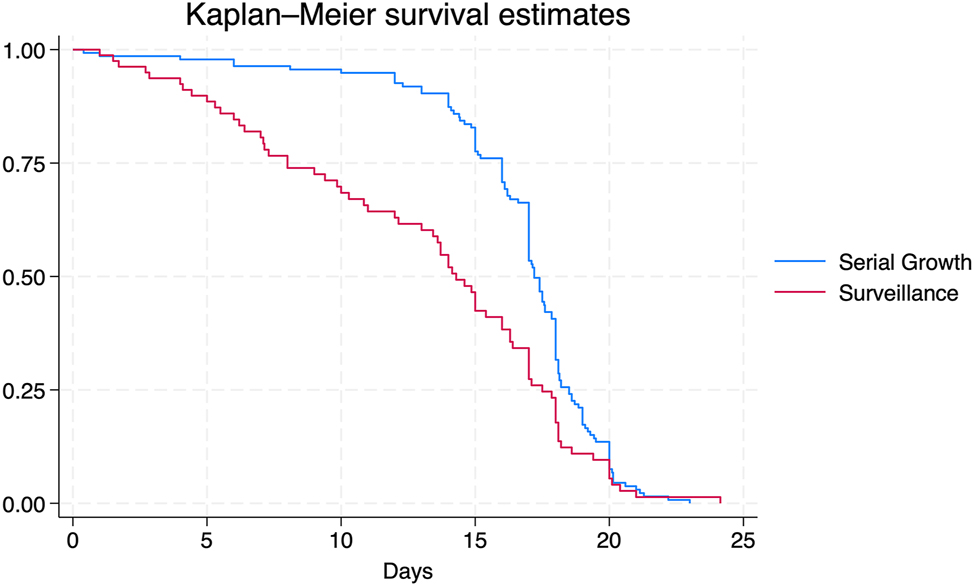
Time to delivery analysis: Time to delivery was analyzed via survival analysis between the surveillance and serial growth (SG) groups using competing risk regression with livebirth defined as the terminal event, stillbirth the competing event, and no instances of censoring. Figure 2 demonstrates that there were no differences in time (days) from periviable fetal growth restriction (pFGR) diagnosis to delivery of a liveborn between the surveillance and SG groups.
Discussion
This study demonstrated that there was no difference in perinatal death between fetuses with pFGR that underwent weekly UA Doppler surveillance vs. serial fetal growth evaluation from 22 0/7 to 27 6/7 weeks gestation. Adverse obstetric and neonatal outcomes occurred more frequently among pregnancies that underwent weekly UA Doppler surveillance. After adjusting for relevant clinical factors, the strength of the association between UA Doppler surveillance and neonatal outcomes was mitigated; however, an association between UA Doppler surveillance and adverse obstetric outcomes remained. These findings may suggest that baseline patient characteristics, rather than antenatal surveillance frequency, are the predominant determinant of the adverse outcomes that were observed. However, the independent association between weekly Doppler surveillance and adverse obstetric outcomes suggests that antenatal surveillance frequency may have an influence on perinatal management (e.g., delivery timing, route of delivery). Despite no difference in GA at pFGR diagnosis between the groups, fetuses in the surveillance group were more likely to demonstrate features of severe growth restriction at diagnosis – EFW<3 % for GA, UA PI>95 % for GA, EFW<3 % for GA and UA PI>95 % for GA – and were more likely to demonstrate abnormal UA Doppler findings, specifically REDF, by delivery. There was no difference in time from pFGR diagnosis to delivery of a livebirth between the groups.
Previous studies on periviable or early-onset FGR demonstrated similar prevalence of CHTN (12.5 % vs. 2–13.8 % when clearly stated) and history of prior IUFD (4.5 % vs. 4 %) [19], 20], 25]. Substance use has not been routinely reported in previous studies on early-onset FGR, though Meler et al. (2023) report on the prevalence of substance use with smoking being the most commonly-reported substance at approximately 16 % and Mendoza et al. (2021) report a smoking rate of 18.2 % [19], 20]. This appears similar to rates reported within this study – 27.7 % with any substance use and 16.5 % with tobacco use. For the primary outcome, this study demonstrated similar rates of IUFD (7.1 %) and NND (4.3 %) as reported in previous studies (2–12 % and 3–18 %, respectively) [19], [20], [21, [24], [25], [26]. When compared to previously reported adverse perinatal outcomes, components of both the secondary obstetric and neonatal outcome composites were similar (Supplementary Table 2). The GA at delivery reported in previous studies ranges from 27.7 to 37 weeks [19], [20], [21], [22, 25], 29]. The GA at delivery in this study lands at the higher end of previously reported rates. The cited studies include populations with more severe features upon FGR diagnosis (e.g., AC<3 %, abnormal UA Dopplers at diagnosis, etc.) when compared to this study which likely explains the earlier deliveries [19], [20], [21], [22, 25], 29].
Pre-existing maternal co-morbidities – CHTN and history of IUFD – were more prevalent among the surveillance group. This may have introduced selection bias in our study population, demonstrating a tendency to assign high-risk pregnancies into the surveillance group while lower-risk pregnancies were assigned to the SG group. This potential selection bias was further suggested by the following high-risk characteristics seen more frequently among the surveillance group: lower PAPP-A, higher AFP, more fetuses demonstrating an EFW<3 % and abnormal UA Dopplers at diagnosis. This bias may reflect a predisposition of the surveillance group to develop obstetric complications such as HDP, leading to increased rates of medically-indicated PTD, and subsequent neonatal morbidity, when compared to the SG group. This is supported by the persistent association between weekly surveillance and adverse obstetric and neonatal adverse composite outcomes after adjusting for CHTN and prior history of IUFD (Supplementary Table 1).
Alternatively, increased adverse obstetric and neonatal outcomes in the surveillance group with no difference in perinatal death between the groups may suggest that exposure to weekly UA Doppler surveillance allowed for timely delivery which may have been protective against IUFD. Timely intervention (delivery and antenatal corticosteroids) may also have been protective against severe fetal deterioration, supportive of improved immediate neonatal transition, and beneficial to neonatal survival rates. Nonetheless, these interventions are likely at the cost of obstetric (PTD, classical CD) and neonatal morbidity. Should this theory hold true, the authors assumed PTDs for fetal indications would occur more frequently among the surveillance group than the SG group. Investigation, however, revealed no difference in the rates of PTDs for fetal indications at ≤28, ≤32, ≤34, and ≤36 weeks (Table 2, Figure 2). Additionally, no differences were identified in time from pFGR diagnosis to delivery of liveborn. Therefore, the authors conclude that the increased baseline risk among the surveillance group more likely contributed to worse obstetric, fetal, and neonatal morbidities, though not at the cost of increased fetal or neonatal mortality.
The strengths of this study include the evaluation of pregnancies from multiple tertiary care centers and the considerable cohort size. Larger cohort studies have been published by both Li et al. (2014) and Gairabekova et al. (2021); however, both populations presented in these studies were selective of high-risk pregnancies only (i.e., history of HDP or IUFD) [22], 25] or included pregnancies with FGR diagnosis up to 32 weeks [25]. Most importantly, this study aims to address the gap in periviability management recommendations through investigation of the overall utility of weekly UA Doppler surveillance at the limits of periviability. Previous studies have, instead, described the pattern of various UA Doppler trends following periviable, or early onset, FGR or provided surveillance recommendations ≥26 weeks [20], 22], 25], 28], 29]. Limitations of this study include the retrospective design and, therefore, lack of case randomization. The included institutions did not universally interrogate middle cerebral artery (MCA) or ductus venosus (DV) Doppler profiles or computerized cardiotocography which may limit comparison to previous studies of early FGR [34]. Additionally, the study sample size precludes powered analysis of severe perinatal outcomes among this relatively rare clinical cohort, especially sub-analyses involving of individual maternal and fetal characteristics. Post-hoc calculation indicates that approximately 800–6,000 pregnancies would be required to detect between 20 % and 50 % decrease in the primary outcome of perinatal death from the population rate of 10.5 % in the SG group with 80 % power and 0.05 type I error. A multi-center, prospective, randomized controlled trial should be considered to investigate optimal Doppler initiation and frequency among pregnancies complicated by pFGR. However, based on available data, the authors propose that in pregnancies with increased baseline risk, weekly Doppler surveillance may be considered after a diagnosis of pFGR to help with prognostication. Nonetheless, decisions aimed at intervention (such as delivery) should be deferred until the fetus reaches an EFW that aligns with the institution’s resuscitation thresholds.
In conclusion, weekly surveillance was associated with a higher rate of perinatal complications despite no differences in perinatal death. As an observational, cohort study, these findings suggest that pre-existing maternal and obstetric risk factors may have driven surveillance stratification of higher-risk patients into the weekly surveillance group. Prospective studies are necessary to better understand the clinical benefits of weekly ultrasound surveillance among fetuses with pFGR.
Acknowledgments
The authors thank the sonographers and maternal-fetal medicine physicians at The MetroHealth Fetal Diagnostic Center and University Hospitals Cleveland Medical Center for acquisition and interpretation of the reviewed studies. This study did not involve any external funding sources. There are no conflicts of interests or financial support to disclose.
-
Research ethics: IRB approvals were obtained from The MetroHealth IRB (IRB#00000382) and University Hospitals IRB (IRB#20230844) in September 2023.
-
Informed consent: Not applicable.
-
Author contributions: All authors have accepted responsibility for the entire content of this manuscript and approved its submission. FVL contributed to study design and implementation, data collection, data analysis, manuscript drafting, editing, and publication. EJHS contributed to study design and implementation, data analysis, manuscript drafting, editing, and publication. MRI and EVG contributed to data collection. DNH contributed to data analysis and manuscript editing.
-
Use of Large Language Models, AI and Machine Learning Tools: None declared.
-
Conflict of interest: The authors state no conflict of interest.
-
Research funding: None declared.
-
Data availability: The data that support the findings of this study are available on request from the corresponding author, FVL. The data are not publicly available due to privacy/ethical/legal/commercial restrictions.
References
1. Fetal Growth Restriction. ACOG Practice Bulletin, Number 227. Obstet Gynecol 2021;137:e16–28. https://doi.org/10.1097/AOG.0000000000004251.Suche in Google Scholar PubMed
2. Gordijn, SJ, Beune, IM, Thilaganathan, B, Papageorghiou, A, Baschat, AA, Baker, PN, et al.. Consensus definition of fetal growth restriction: a Delphi procedure. Ultrasound Obstet Gynecol 2016;48:333–9. https://doi.org/10.1002/uog.15884.Suche in Google Scholar PubMed
3. Vasak, B, Koenen, SV, Koster, MP, Hukkelhoven, CW, Franx, A, Hanson, MA, et al.. Human fetal growth is constrained below optimal for perinatal survival. Ultrasound Obstet Gynecol 2015;45:162–7. https://doi.org/10.1002/uog.14644.Suche in Google Scholar PubMed
4. Francis, JH, Permezel, M, Davey, MA. Perinatal mortality by birthweight centile. Aust N Z J Obstet Gynaecol 2014;54:354–9. https://doi.org/10.1111/ajo.12205.Suche in Google Scholar PubMed
5. Glinianaia, SV, Rankin, J, Pearce, MS, Parker, L, Pless-Mulloli, T. Stillbirth and infant mortality in singletons by cause of death, birthweight, gestational age and birthweight-for-gestation, Newcastle upon Tyne 1961–2000. Paediatr Perinat Epidemiol 2010;24:331–42. https://doi.org/10.1111/j.1365-3016.2010.01119.x.Suche in Google Scholar PubMed
6. Vangen, S, Stoltenberg, C, Skjaerven, R, Magnus, P, Harris, JR, Stray-Pedersen, B. The heavier the better? Birthweight and perinatal mortality in different ethnic groups. Int J Epidemiol 2002;31:654–60. https://doi.org/10.1093/ije/31.3.654.Suche in Google Scholar PubMed
7. Zhang-Rutledge, K, Mack, LM, Mastrobattista, JM, Gandhi, M. Significance and outcomes of fetal growth restriction below the 5th percentile compared to the 5th to 10th percentiles on midgestation growth ultrasonography. J Ultrasound Med 2018;37:2243–9. https://doi.org/10.1002/jum.14577.Suche in Google Scholar PubMed
8. Sibai, B, Dekker, G, Kupferminc, M. Pre-eclampsia. Lancet 2005;365:785–99. https://doi.org/10.1016/S0140-6736-05-17987-2.Suche in Google Scholar
9. Downes, KL, Grantz, KL, Shenassa, ED. Maternal, labor, delivery, and perinatal outcomes associated with placental abruption: a systematic review. Am J Perinatol 2017;34:935–57. https://doi.org/10.1055/s-0037-1599149.Suche in Google Scholar PubMed PubMed Central
10. Rodriguez-Sibaja, MJ, Mendez-Piña, MA, Lumbreras-Marquez, MI, Acevedo-Gallegos, S, Velazquez-Torres, B, Ramirez-Calvo, JA. Intended delivery mode and neonatal outcomes in pregnancies with fetal growth restriction. J Matern Fetal Neonatal Med 2023;36:2286433. https://doi.org/10.1080/14767058.2023.2286433.Suche in Google Scholar PubMed
11. Gardosi, JO. Prematurity and fetal growth restriction. Early Hum Dev 2005;81:43–9. https://doi.org/10.1016/j.earlhumdev.2004.10.015.Suche in Google Scholar PubMed
12. Stewart, B, Karahalios, A, Pszczola, R, Said, J. Moderate to late preterm intrauterine growth restriction: a restrospective, observational study of the indications for delivery and outcomes in an Australian perinatal centre. Aust N Z J Obstet Gynaecol 2018;58:306–14. https://doi.org/10.1111/ajo.12721.Suche in Google Scholar PubMed
13. Kleuskens, DG, Van Veen, CMC, Groenendaal, F, Ganzevoort, W, Gordijn, SJ, Van Rijn, BB, et al.. Prediction of fetal and neonatal outcomes after preterm manifestations of placental insufficiency: systematic review of prediction models. Ultrasound Obstet Gynecol 2023;62:644–52. https://doi.org/10.1002/uog.26245.Suche in Google Scholar PubMed
14. Rebelo, F, Carrilho, TRB, Canuto, R, Schlussel, MM, Farias, DR, Ohuma, EO, et al.. Estimated fetal weight standards of the INTERGROWTH-21st project for the prediction of adverse outcomes: a systematic review with meta-analysis. J Matern Fetal Neonatal Med 2023;36:2230510. https://doi.org/10.1080/14767058.2023.2230510.Suche in Google Scholar PubMed
15. Kramer, MS, Olivier, M, McLean, FH, Willis, DM, Usher, RH. Impact of intrauterine growth retardation and body proportionality on fetal and neonatal outcome. Pediatrics 1990;86:707–13. https://doi.org/10.1542/peds.86.5.707.Suche in Google Scholar
16. Gilbert, WM, Danielsen, B. Pregnancy outcomes associated with intrauterine growth restriction. Am J Obstet Gynecol 2003;188:1596–9; discussion 1599-601. https://doi.org/10.1067/mob.2003.384.Suche in Google Scholar PubMed
17. Longo, S, Bollani, L, Decembrino, L, Di Comite, A, Angelini, M, Stronati, M. Short-term and long-term sequelae in intrauterine growth retardation (IUGR). J Matern Fetal Neonatal Med 2013;26:222–5. https://doi.org/10.3109/14767058.2012.715006.Suche in Google Scholar PubMed
18. Rosenberg, A. The IUGR newborn. Semin Perinatol 2008;32:219–24. https://doi.org/10.1053/j.semperi.2007.11.003.Suche in Google Scholar PubMed
19. Mendoza, M, Hurtado, I, Bonacina, E, Garcia-Manau, P, Serrano, B, Tur, H, et al.. Individual risk assessment for prenatal counseling in early-onset growth-restricted and small-for-gestational-age fetuses. Acta Obstet Gynecol Scand 2021;100:504–12. https://doi.org/10.1111/aogs.14032.Suche in Google Scholar PubMed
20. Meler, E, Mazarico, E, Peguero, A, Gonzalez, A, Martinez, J, Boada, D, et al.. Death and severe morbidity in isolated periviable small-for-gestational-age fetuses. BJOG 2023;130:485–93. https://doi.org/10.1111/1471-0528.17181.Suche in Google Scholar PubMed
21. Lawin-O’Brien, AR, Dall’Asta, A, Knight, C, Sankaran, S, Scala, C, Khalil, A, et al.. Short-term outcome of periviable small-for-gestational-age babies: is our counseling up to date? Ultrasound Obstet Gynecol 2016;48:636–41. https://doi.org/10.1002/uog.15973.Suche in Google Scholar PubMed
22. Li, N, Ghosh, G, Gudmundsson, S. Uterine artery Doppler in high-risk pregnancies at 23-24 gestational weeks is of value in predicting adverse outcome of pregnancy and selecting cases for more intense surveillance. Acta Obstet Gynecol Scand 2014;93:1276–81. https://doi.org/10.1111/aogs.12488.Suche in Google Scholar PubMed
23. Lingam, I, Okell, J, Maksym, K, Spencer, R, Peebles, D, Buquis, G, et al.. Neonatal outcomes following early fetal growth restriction: a subgroup analysis of the EVERREST study. Arch Dis Child Fetal Neonatal Ed 2023;108:599–606. https://doi.org/10.1136/archdischild-2022-325285.Suche in Google Scholar PubMed
24. Gupta, S, Naert, M, Lam-Rachlin, J, Monteagudo, A, Rebarber, A, Saltzman, D, et al.. Outcomes in patients with early-onset fetal growth restriction without fetal or genetic anomalies. J Matern Fetal Neonatal Med 2019;32:2662–6. https://doi.org/10.1080/14767058.2018.1445711.Suche in Google Scholar PubMed
25. Gairabekova, D, van Rosmalen, J, Duvekot, JJ. Outcome of early-onset fetal growth restriction with or without abnormal umbilical artery Doppler flow. Acta Obstet Gynecol Scand 2021;100:1430–8. https://doi.org/10.1111/aogs.14142.Suche in Google Scholar PubMed PubMed Central
26. Pels, A, Beune, IM, van Wassenaer-Leemhuis, AG, Limpens, J, Ganzevoort, W. Early-onset fetal growth restriction: a systematic review on mortality and morbidity. Acta Obstet Gynecol Scand 2020;99:153–66. https://doi.org/10.1111/aogs.13702.Suche in Google Scholar PubMed PubMed Central
27. Monier, I, Ancel, PY, Ego, A, Guellec, I, Jarreau, PH, Kaminski, M, et al.. Gestational age at diagnosis of early-onset fetal growth restriction and impact on management and survival: a population-based cohort study. BJOG 2017;124:1899–906. https://doi.org/10.1111/1471-0528.14555.Suche in Google Scholar PubMed
28. Figueras, F, Gratacós, E. Update on the diagnosis and classification of fetal growth restriction and proposal of a stage-based management protocol. Fetal Diagn Ther 2014;36:86–98. https://doi.org/10.1159/000357592.Suche in Google Scholar PubMed
29. Turan, OM, Turan, S, Gungor, S, Berg, C, Moyano, D, Gembruch, U, et al.. Progression of Doppler abnormalities in intrauterine growth restriction. Ultrasound Obstet Gynecol 2008;32:160–7. https://doi.org/10.1002/uog.5386.Suche in Google Scholar PubMed
30. Lees, CC, Romero, R, Stampalija, T, Dall’Asta, A, DeVore, GA, Prefumo, F, et al.. Clinical Opinion: the diagnosis and management of suspected fetal growth restriction: an evidence-based approach. Am J Obstet Gynecol 2022;226:366–78. https://doi.org/10.1016/j.ajog.2021.11.1357.Suche in Google Scholar PubMed PubMed Central
31. Lees, CC, Stampalija, T, Baschat, A, da Silva Costa, F, Ferrazzi, E, Figueras, F, et al.. ISUOG Practice Guidelines: diagnosis and management of small-for-gestational-age fetus and fetal growth restriction. Ultrasound Obstet Gynecol 2020;56:298–312. https://doi.org/10.1002/uog.22134.Suche in Google Scholar PubMed
32. Tyson, JE, Parikh, NA, Langer, J, Green, C, Higgins, RD. National Institute of Child Health and Human Development neonatal Research Network. Intensive care for extreme prematurity--moving beyond gestational age. N Engl J Med 2008;358:1672–81. https://doi.org/10.1056/NEJMoa073059.Suche in Google Scholar
33. StataCorp. Stata statistical software: release 18. College Station, TX: StataCorp LLC; 2023.Suche in Google Scholar
34. Lees, C, Marlow, N, Arabin, B, Bilardo, CM, Brezinka, C, Derks, JB, et al.. Perinatal morbidity and mortality in early-onset fetal growth restriction: cohort outcomes of the trial of randomized umbilical and fetal flow in Europe (TRUFFLE). Ultrasound Obstet Gynecol 2013;42:400–8. https://doi.org/10.1002/uog.13190.Suche in Google Scholar PubMed
Supplementary Material
This article contains supplementary material (https://doi.org/10.1515/jpm-2025-0078).
© 2025 the author(s), published by De Gruyter, Berlin/Boston
This work is licensed under the Creative Commons Attribution 4.0 International License.