Impact of birth weight to placental weight ratio and other perinatal risk factors on left ventricular dimensions in newborns: a prospective cohort analysis
-
Ashraf Gad

 ,
Dhafer Malouche
,
Dhafer Malouche

Abstract
Objectives
To investigate the association between birth weight to placental weight (BW/PW) ratio, and echocardiographic left ventricle (LV) morphology at birth, while accounting for other relevant perinatal factors.
Methods
A prospective cohort study was conducted on neonates at NewYork-Presbyterian Brooklyn Methodist Hospital from 2014 to 2018, categorized by their BW/PW percentile. Missing data were imputed with principal component analysis. Chi-squared and one-way analysis of variance were used to compare BW/PW groups and the best regression model was selected using a genetic and backward stepwise algorithm.
Results
We analyzed 827 neonates in three BW/PW groups: small (n=16), normal (n=488), and large (n=323). Placental thickness and smallest diameter were positively correlated with several LV parameters, including inter-ventricular septal thickness during diastole (IVSd) (p=0.002, p<0.001) and systole (IVSs) (p=0.001, p<0.001), LV posterior wall thickness at end of diastole (LVPWd) (p=0.003, p<0.001) and systole (LVPWs) (p<0.001, p<0.001), LV mass (p=0.017, p<0.001), and LV mass/volume (p=0.011, p<0.001). The BW/PW ratio correlated with an increased shortening fraction (estimate=0.29, 95 % CI 0.03–0.55, p=0.027). PW correlated with IVSs (p=0.019), while the longest placental diameter was linked to a decrease in LV internal dimension during diastole (LVIDd) (estimate=−0.07, p=0.039), LV mass (estimate=−0.11, p=0.024), and LV mass/volume (estimate=−0.55, p=0.005).
Conclusions
This study found that several placental factors, including the BW/PW ratio, can independently affect LV dimension and morphology, highlighting the importance of fetal growth and placental health in the physiological adaptation of the fetal heart. More research is needed to establish causation and inform newborn prevention strategies.
Introduction
The placenta is crucial for fetal development, serving not just as a regulator of nutrient transport but also as a factor in fetal programming and long-term health outcomes. Its weight is a key determinant of both fetal growth and birth weight (BW), particularly as it shows a positive correlation near term [1, 2]. This holds particular importance as both abnormally low and high placental sizes have been associated with adverse neonatal outcomes [3, 4]. Additionally, the ratio of BW to placental weight (BW/PW) serves as a valuable measure of placental efficiency in nutrient supply. Elevated ratios indicate more efficient nutrient transfer to the fetus, whereas reduced ratios are often linked to suboptimal nutrient delivery, contributing to increased risks of pregnancy complications and conditions such as fetal growth restriction and small-for-gestational-age (SGA) infants, especially earlier in gestation (6, 7, 8).
The left ventricle (LV) serves as a vital predictor of cardiac health in neonates. Alterations in LV dimensions or mass, potentially due to fetal programming, can pose a significant risk to cardiovascular health both immediately and in the long term [5]. Studies have shown that alterations in placental function and structure may lead to cardiovascular changes in the fetus, including the LV [6]. Studies have evaluated various anthropometric measures, such as height, weight, and body surface area (BSA), as determinants of cardiovascular structure size in children including the LV [7]. Among these, BSA has been identified as the primary predictive variable for cardiac parameters. It is commonly used to calculate z-scores for cardiac structures in neonates and infants [8, 9]. In our previous study, we have observed that BW is also a significant predictor of LV dimensions in SGA infants [10].
PW has been identified as the factor with the most influence on the BW. When examined in isolation, PW accounts for 48 % of the variability in BW [11]. Furthermore, after adjusting for relevant maternal and neonatal characteristics, the combined placental measurements account for a substantial 74 % of its variability [11]. This interrelationship suggests that placental metrics can serve as effective predictors of neonatal LV dimensions. Numerous factors such as maternal health, gestational age (GA), and environmental conditions are known to influence BW/PW ratio and, subsequently, neonatal outcomes [12]. However, the specific mechanisms by which the BW/PW ratio affects LV measurements remain less well understood. This has led to a research gap, warranting further investigation into the correlation between BW/PW ratio and neonatal cardiac health, particularly in the context of LV measurements.
Understanding the relationship between BW/PW ratio and LV dimensions may not only offer insights into immediate neonatal care but also into long-term cardiovascular health, as early cardiac changes have been linked to increased susceptibility to cardiovascular diseases in later life [13]. The primary aim of this study is to elucidate the association between the BW/PW ratio and LV dimensions in neonates, thereby contributing to a more nuanced understanding of factors influencing neonatal cardiac structure that may have implications for cardiovascular health into later life. The secondary objectives of this study are to investigate the associations between additional placental, maternal, and neonatal factors and their influence on LV parameters.
Subjects and methods
Study design and setting
This single-center prospective cohort study investigated the impact of key parameters, including placental factors, on echocardiographic LV dimensions and morphology in newborns. The primary objective of the study was to evaluate the relationship between the BW/PW ratio and different LV dimensions in newborns while considering other neonatal, maternal, and placental factors. Echo evaluations were conducted within 48–72 h after delivery and before hospital discharge. The study was conducted at NewYork-Presbyterian Brooklyn Methodist Hospital’s nursery ward and neonatal intensive care unit (NICU) from 2014 to 2018, adhering to the Helsinki Declaration and approved by the hospital’s Institutional Review Board (IRB). Data security was maintained by appointing distinct identification numbers to each participant and keeping the data securely in a protected repository. Reporting followed the strengthening the reporting of observational studies in epidemiology (STROBE) guidelines [14].
Eligibility criteria
This study included neonates who underwent echocardiographic evaluations at the hospital mostly for murmur evaluation as part of routine screening. Neonates below the 10th percentile or above the 90th percentile on the Fenton growth chart were selected for routine screening echocardiography [15]. Neonates with major cardiac pathology, significant congenital abnormalities, hypoxic respiratory failure, severe sepsis/shock, low 5 min APGAR score, genetic diagnosis, perinatal depression, or born before the 35th week of pregnancy were excluded. Significant cardiac pathologies, as exclusion criteria in our study, encompass any structural anomalies detected via echocardiography, irrespective of the clinical presentation. This includes, but is not limited to, congenital heart diseases such as septal defects, complex cyanotic heart conditions, and outflow tract obstructions, as well as valvular disorders like severe stenosis or regurgitation. Symptomatic newborns with conditions such as persistent pulmonary hypertension of the newborn and cardiac dysfunctions that lead to clinical instability were also excluded from the study. Conversely, neonates with trivial cardiac findings, which do not impact hemodynamics – like a patent ductus arteriosus that presents with minimal shunting or a patent foramen ovale measuring less than 3 mm – were not excluded and therefore participated in the study. These minor conditions are typically not associated with significant clinical consequences and are often considered normal variants in neonates. Parental consent was not obtained as echocardiography scans were part of routine screening protocols for newborns. Following echocardiography testing and discharge, no further follow-up was done for the included neonates.
Predictor variables
We used neonatal, maternal, and placental factors as predictor variables. The included population was divided into three categories based on their BW/PW ratio using reference ranges provided by the study conducted by Flatley et al. (2022) [16]. These reference ranges were adjusted for GA, sex, and parity. The three groups were categorized as follows: small BW/PW (less than the 10th percentile), normal BW/PW (between the 10th and 90th percentiles), and large BW/PW (more than the 90th percentile). Utilizing the same percentiles cutoff, we categorized the population into three size groups: SGA, appropriate for gestational age (AGA), and large for gestational age (LGA) based on Fenton charts [15].
Neonatal variables included sex, GA, birth weight, height, head circumference, chest circumference, size category, ponderal index, APGAR scores at 1 and 5 min, blood pressure (BP) measurements (diastolic, systolic, and mean PB), and NICU admissions. Maternal covariates included gravidity, parity, maternal age, body mass index (BMI), mode of delivery, gestational diabetes mellitus (GDM) diagnosis and management, ethnicity, and preeclampsia. GDM diagnosis followed the criteria set by the American Diabetes Association (ADA) collected from medical records at the time of delivery [17], and its management was divided into diet/lifestyle, medication, or insulin. The diagnosis of preeclampsia in our study was extracted from medical records at the time of delivery, which was primarily made using the criteria established by the American Congress of Obstetricians and Gynecologists (ACOG) during the study period, while BP readings and BMI (using height and weight) were extracted at the time of delivery by our institution nurses. Placental factors considered were PW, BW/PW ratio, BW/PW category, placental dimensions (largest and smallest), and placental thickness. Relevant maternal medical history was obtained from electronic medical records, while neonatal and placental information was collected after birth.
Outcome variables
The dependent variables included inter-ventricular septal thickness during diastole (IVSd) and systole (IVSs), left ventricular internal dimension during diastole (LVIDd) and systole (LVIDs), left ventricular posterior wall thickness at end of diastole (LVPWd) and systole (LVPWs), shortening fraction (FS), left ventricular mass (LVmass), left ventricular mass to volume ratio (LVmass/vol), and asymmetrical septal hypertrophy (ASH). The only binary variable, ASH, was derived from the IVSd to LVPWd ratio, while all other variables were continuous and either measured directly or estimated using echocardiography. LV morphology was evaluated using the 2D method for structural assessment and the M-mode method for functional evaluation. Echocardiography was conducted by a single board-certified cardiologist. In cases where the cardiologist is not available, the echo study is conducted by a technician and is subsequently re-reviewed and interpreted by the cardiologist. Most LV dimensions measures were conducted using the short-axis view, while some were done using the parasternal long-axis view. All echo LV dimensions measured were done in one single cycle. A Philips 5500 ECHO (Philips, Andover, MA, USA) device was used for examining the heart by echocardiography.
Data analysis
We utilized multiple imputations to handle missing data in two sub-datasets – one for numerical variables and another for categorical variables. For numerical variables, we normalized the data using a logarithm transformation and then utilized a technique called multiple imputations with principal component analysis (MIPCA) with PCA to fill in missing values, creating a complete dataset [18]. For categorical variables, we employed MIPCA with multiple correspondence analysis (MCA) [18, 19]. This approach has advantages in managing large datasets with missing values, accurately estimating missing values, reducing dataset complexity, and effectively analyzing categorical data [19].
Then, we compared the characteristics of three BW/PW categories at baseline using different statistical tests. For categorical variables, the Chi-squared test was used, while for continuous variables, a one-way analysis of variance (ANOVA) was employed [20]. For statistical modeling, a genetic algorithm was used for model selection based on the lowest Akaike information criterion (AIC) [21, 22]. The genetic algorithm iteratively searches for the optimal variable combination based on fitness criteria, inspired by natural selection and genetics. Afterward, a backward stepwise algorithm based on the F-test was applied to refine the model, retaining only significant variables at a 5 % significance level [23]. The backward stepwise algorithm starts with all the variables selected by the genetic algorithm and removes non-significant ones based on the F-test [23].
Baseline characteristics were analyzed and presented in tables with frequencies, percentages, mean, and standard deviations. Regression model results were also presented in tables, showing estimates, standard errors, 95 % confidence intervals (CI), and p-values for each predictor variable. Statistical significance was determined using a p-value threshold of less than 0.05. The model fit evaluation included R-squared (R2) and log-likelihood. Statistical analyses for Chi-squared and one-way ANOVA tests were conducted using Stata software (version 16.0, StataCorp LLC, College Station, TX). The missMDA package was used for imputing missing values, and the glmulti package was utilized for model selection using the genetic algorithm in RStudio Build 446 [18, 19, 22].
Results
Selection and inclusion process
Figure 1 presents an overview of the selection and inclusion process used in our study. Within the study period, a total of 908 neonates were admitted to the hospital. After excluding 81 neonates based on the selection criteria (reasons outlined in Figure 1), we included 827 neonates in our final analysis. Among these neonates, 16 were classified in the small BW/PW group (with BW/PW ratio less than the 10th percentile), 488 were in the large BW/PW group (with BW/PW ratio above the 90th percentile), and the remaining 323 neonates were categorized in the normal BW/PW group.
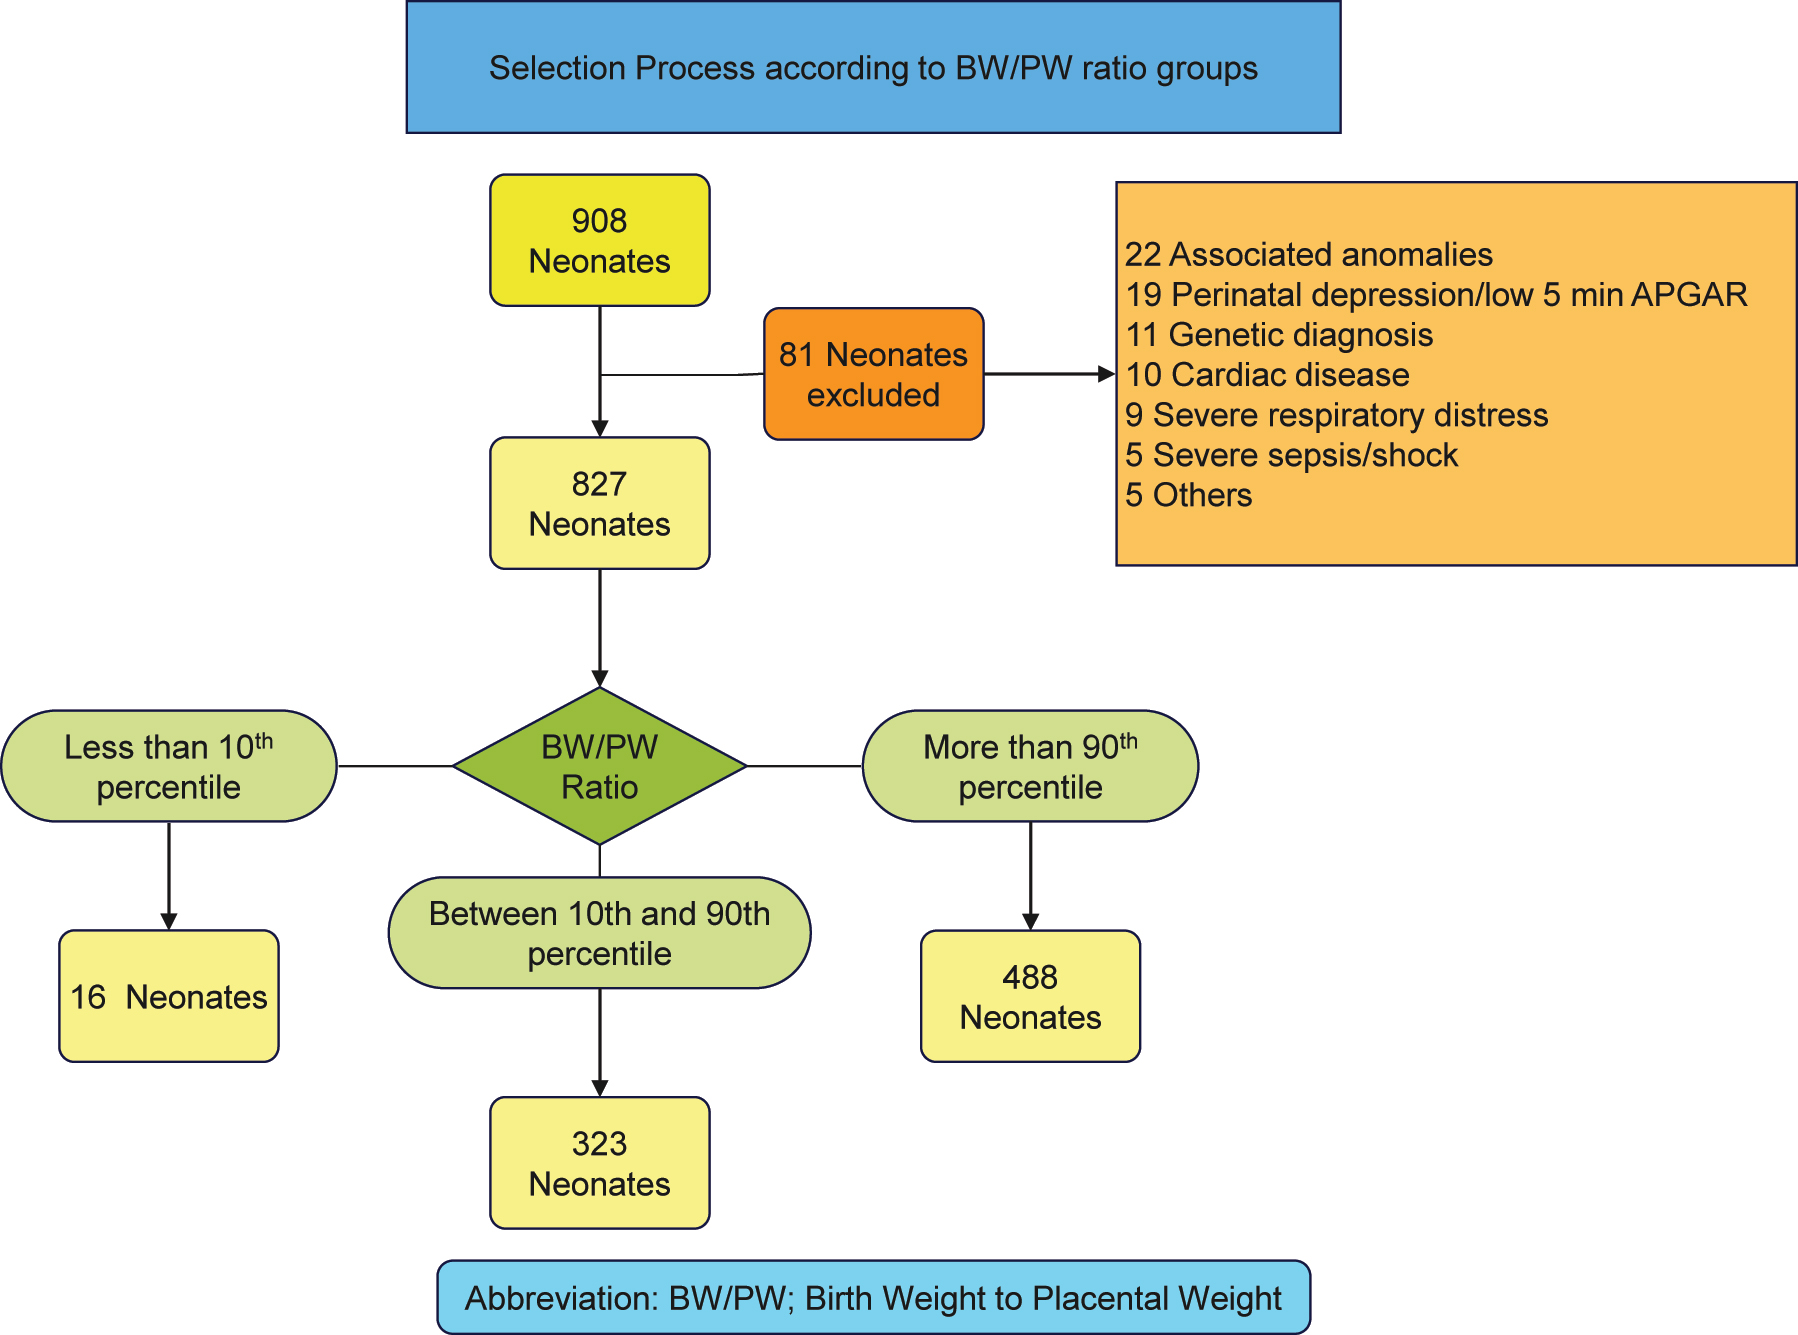
Overview of the selection process of neonates according to BW/PW ratio groups in our study.
Baseline characteristics
Table 1 presents the baseline characteristics of the neonates categorized based on their BW/PW ratio groups. The comparison of categorical variables among the groups revealed no statistically significant differences in sex, birth weight category, APGAR scores at 1 and 5 min, NICU admission, mode of delivery, gravidity, parity, preeclampsia, GDM status, GDM management, and ethnicity. Maternal insulin use for GDM was documented in 37 cases, while medication use was found in 66 cases (65 using glyburide and one using metformin). Notably, there were no significant variations in the distribution of these variables across the different BW/PW ratio groups.
Differences in baseline characteristics between BW/PW ratio groups in categorical variables.
| Small BW/PW ratio n=16 |
Normal BW/PW ratio n=323 |
Large BW/PW ratio n=488 |
Total n=827 |
|||||
|---|---|---|---|---|---|---|---|---|
| n | % | n | % | n | % | n | % | |
| Sex | ||||||||
| Male | 9 | 56.25 | 186 | 57.59 | 267 | 54.71 | 462 | 55.86 |
| Female | 7 | 43.75 | 137 | 42.41 | 221 | 45.29 | 365 | 44.14 |
| Birth weight category | ||||||||
| SGA | 2 | 12.5 | 54 | 16.72 | 73 | 14.96 | 129 | 15.6 |
| AGA | 11 | 68.75 | 210 | 65.02 | 303 | 62.09 | 524 | 63.36 |
| LGA | 3 | 18.75 | 59 | 18.27 | 112 | 22.95 | 174 | 21.04 |
| APGAR at 1 min | ||||||||
| Normal | 16 | 100 | 278 | 86.07 | 432 | 88.52 | 726 | 87.79 |
| Moderately depressed | 0 | 0 | 31 | 9.6 | 32 | 6.56 | 63 | 7.62 |
| Severely depressed | 0 | 0 | 14 | 4.33 | 24 | 4.92 | 38 | 4.59 |
| APGAR at 5 min | ||||||||
| Normal | 16 | 100 | 304 | 94.12 | 462 | 94.67 | 782 | 94.56 |
| Moderately depressed | 0 | 0 | 19 | 5.88 | 26 | 5.33 | 45 | 5.44 |
| NICU admission | ||||||||
| No | 10 | 62.5 | 169 | 52.32 | 258 | 52.87 | 437 | 52.84 |
| Yes | 6 | 37.5 | 154 | 47.68 | 230 | 47.13 | 390 | 47.16 |
| Mode of delivery | ||||||||
| Vaginal delivery | 8 | 50 | 161 | 49.85 | 214 | 43.85 | 383 | 46.31 |
| Cesarean section | 8 | 50 | 162 | 50.15 | 274 | 56.15 | 444 | 53.69 |
| Gravidity | ||||||||
| Primigravida | 3 | 18.75 | 89 | 27.55 | 114 | 23.36 | 206 | 24.91 |
| Multigravida | 13 | 81.25 | 234 | 72.45 | 374 | 76.64 | 621 | 75.09 |
| Parity | ||||||||
| Nulliparous | 13 | 81.25 | 219 | 67.8 | 336 | 68.85 | 568 | 68.68 |
| Multiparous | 3 | 18.75 | 104 | 32.2 | 152 | 31.15 | 259 | 31.32 |
| Preeclampsia | ||||||||
| No | 15 | 93.75 | 292 | 90.4 | 439 | 89.96 | 746 | 90.21 |
| Yes | 1 | 6.25 | 31 | 9.6 | 49 | 10.04 | 81 | 9.79 |
| GDM | ||||||||
| No | 14 | 87.5 | 216 | 66.87 | 315 | 64.55 | 545 | 65.9 |
| Yes | 2 | 12.5 | 107 | 33.13 | 173 | 35.45 | 282 | 34.1 |
| GDM management | ||||||||
| Diet or untreated | 16 | 100 | 282 | 87.31 | 426 | 87.3 | 724 | 87.54 |
| Medical | 0 | 0 | 24 | 7.43 | 42 | 8.61 | 66 | 7.98 |
| Insulin | 0 | 0 | 17 | 5.26 | 20 | 4.1 | 37 | 4.47 |
| Ethnicity | ||||||||
| White | 10 | 62.5 | 202 | 62.54 | 290 | 59.43 | 502 | 60.7 |
| African American | 4 | 25 | 81 | 25.08 | 140 | 28.69 | 225 | 27.21 |
| Asian | 1 | 6.25 | 11 | 3.41 | 7 | 1.43 | 19 | 2.3 |
| Hispanic | 0 | 0 | 9 | 2.79 | 25 | 5.12 | 34 | 4.11 |
| Others | 1 | 6.25 | 20 | 6.19 | 26 | 5.33 | 47 | 5.68 |
-
NICU, neonatal intensive care unit; GDM, gestational diabetes mellitus; SGA, small for gestational age; AGA, appropriate for gestational age; LGA, large for gestational age; BW/PW, birth weight to placental weight.
Table 2 presents the differences in baseline characteristics between the BW/PW ratio groups in continuous variables. Neonates in the small BW/PW ratio group had significantly lower birth weight, birth height, head circumference, chest circumference, and higher PW compared to those in the normal and large BW/PW ratio groups as shown in Table 2. Conversely, GA was significantly lower in the large BW/PW ratio group compared to the other groups. However, there were no significant differences in the ponderal index, maternal age, maternal BMI, maternal BP (systolic, diastolic, mean), placental diameter 1 (largest diameter), placental diameter 2 (smallest diameter), and placental thickness among the BW/PW ratio groups. Table 3 presents the differences in LV parameters between the BW/PW ratio groups. Upon analysis, no significant differences were observed in most of the LV parameters among the groups, including IVSd, IVSs, LVIDd, LVIDs, LVPWd, LVPWs, FS, LVmass, and LVmass/vol. The presence of ASH showed no significant difference among the BW/PW ratio groups as well (p=0.664).
Differences in baseline characteristics between BW/PW ratio groups in continuous variables.
| Small BW/PW ratio n=16 |
Normal BW/PW ratio n=323 |
Large BW/PW ratio n=488 |
Total n=827 |
|||||
|---|---|---|---|---|---|---|---|---|
| Mean | Std. Dev. | Mean | Std. Dev. | Mean | Std. Dev. | Mean | Std. Dev. | |
| Birth weight, g | 2,220.31 | 734.73 | 3,335.80 | 771.93 | 3,504.78 | 677.52 | 3,413.93 | 740.00 |
| Birth height, cm | 43.62 | 3.98 | 48.98 | 3.15 | 49.76 | 2.99 | 49.34 | 3.20 |
| Birth HC, cm | 31.31 | 1.63 | 34.19 | 1.99 | 34.34 | 2.16 | 34.22 | 2.13 |
| Birth CC, cm | 29.54 | 2.94 | 33.00 | 2.79 | 33.21 | 2.56 | 33.06 | 2.70 |
| Ponderal index, g/cm³ | 2.63 | 0.38 | 2.81 | 0.41 | 2.83 | 0.38 | 2.81 | 0.39 |
| Gestational age, weeks | 38.63 | 1.75 | 38.82 | 1.44 | 38.32 | 1.52 | 38.52 | 1.51 |
| Maternal age, years | 32.04 | 4.84 | 31.76 | 6.01 | 31.58 | 5.55 | 31.66 | 5.72 |
| Maternal BMI, kg/m2 | 31.48 | 7.13 | 32.84 | 7.13 | 32.05 | 6.50 | 32.35 | 6.77 |
| Maternal SBP, mm Hg | 128.78 | 17.99 | 124.61 | 14.81 | 123.55 | 14.09 | 124.07 | 14.46 |
| Maternal DBP, mm Hg | 78.30 | 11.43 | 74.31 | 11.91 | 74.72 | 10.41 | 74.63 | 11.04 |
| Maternal MBP, mm Hg | 97.23 | 10.55 | 90.54 | 11.02 | 90.55 | 10.36 | 90.68 | 10.65 |
| Placental weight, g | 603.36 | 184.05 | 577.59 | 136.70 | 482.16 | 102.10 | 521.78 | 127.75 |
| Placental diameter 1, cm | 19.75 | 2.80 | 18.34 | 2.67 | 18.18 | 2.66 | 18.27 | 2.68 |
| Placental diameter 2, cm | 16.37 | 2.06 | 15.83 | 1.96 | 15.83 | 2.00 | 15.84 | 1.98 |
| Placental thickness, cm | 2.48 | 0.91 | 2.43 | 0.60 | 2.49 | 0.66 | 2.46 | 0.64 |
-
Std. Dev., standard deviation; HC, head circumference; CC, chest circumference; BMI, body mass index; SBP, systolic blood pressure; DBP, diastolic blood pressure; MBP, mean blood pressure; BW/PW, birth weight to placental weight.
Differences in LV parameters between BW/PW ratio groups.
| Small BW/PW ratio n=16 |
Normal BW/PW ratio n=323 |
Large BW/PW ratio n=488 |
Total n=827 |
p-Value | |||||
|---|---|---|---|---|---|---|---|---|---|
| Mean | Std. Dev. | Mean | Std. Dev. | Mean | Std. Dev. | Mean | Std. Dev. | ||
| IVSd, mm | 3.93 | 0.55 | 4.12 | 0.85 | 4.17 | 1.05 | 4.15 | 0.97 | 0.506 |
| IVSs, mm | 5.17 | 0.70 | 5.38 | 1.00 | 5.47 | 1.26 | 5.43 | 1.15 | 0.377 |
| LVIDd, mm | 18.56 | 1.76 | 18.51 | 2.04 | 18.43 | 2.18 | 18.47 | 2.11 | 0.863 |
| LVIDs, mm | 11.88 | 1.48 | 11.89 | 1.44 | 11.76 | 1.63 | 11.81 | 1.55 | 0.484 |
| LVPWd, mm | 3.49 | 0.59 | 3.52 | 0.61 | 3.55 | 0.69 | 3.54 | 0.66 | 0.849 |
| LVPWs, mm | 4.85 | 0.71 | 4.85 | 0.69 | 4.87 | 0.81 | 4.86 | 0.77 | 0.959 |
| FS, % | 35.33 | 3.01 | 35.40 | 4.05 | 35.99 | 4.43 | 35.75 | 4.27 | 0.148 |
| LVmass, g | 9.93 | 2.75 | 10.58 | 3.50 | 10.66 | 3.79 | 10.62 | 3.66 | 0.719 |
| LVmass/vol, g/m2 | 49.01 | 10.88 | 50.80 | 12.80 | 50.66 | 12.03 | 50.69 | 12.31 | 0.849 |
| Presence of ASH (n, %) | 3 | 18.75 % | 94 | 29.10 % | 142 | 29.10 % | 239 | 28.90 % | a0.664 |
-
aChi-squared p-value, LVmass, left ventricular mass; LVmass/vol, LVmass to volume ratio; IVSd, inter-ventricular septal thickness during diastole; IVSs, inter-ventricular septal thickness during systole; LVIDd, LV internal dimension during diastole; LVIDs, LV internal dimension during systole; LVPWd, LV posterior wall thickness at end of diastole; LVPWs, LV posterior wall thickness at end of systole; FS, shortening fraction; ASH, asymmetrical septal hypertrophy, Std. Dev., standard deviation; BW/PW, birth weight to placental weight.
Regression results
Table 4 presents the regression analysis results, revealing significant associations between neonatal and maternal factors with various LV parameters. The IVSd model shows a strong fit with an R2 of 0.341 and an adjusted R2 of 0.333, explaining approximately 34.1 % of its variance. Its log-likelihood is −974.455, indicating a good model fit. IVSs also has a robust fit (R2=0.302, adjusted R2=0.295), while LVIDd has a slightly lower but still significant R2 of 0.266. In contrast, LVIDs and FS exhibit weaker fits with R2 values of 0.154 and 0.050, respectively. Notably, LVmass has the highest R2 at 0.406, indicating a strong relationship with the model, while ASH, though lacking an R2 value, shows an association with the model through a log-likelihood of −475.797.
Regression models for LV parameters included.
| LV parameter/predictor | Estimates | Standard error | CI | p | R2/R2 adjusted | Log-likelihood |
|---|---|---|---|---|---|---|
| IVSd a | 0.341/0.333 | −974.455 | ||||
| Gestational age | 0.05 | 0.02 | 0.01–0.09 | 0.011 | ||
| Placental diameter 2, cm | 0.08 | 0.02 | 0.04–0.11 | <0.001 | ||
| Placental thickness, cm | 0.14 | 0.05 | 0.05–0.23 | 0.002 | ||
| NICU admission | 0.15 | 0.06 | 0.03–0.27 | 0.018 | ||
| LGA | 0.78 | 0.08 | 0.62–0.94 | <0.001 | ||
| SGA | −0.38 | 0.09 | −0.56 to −0.21 | <0.001 | ||
| Primiparity | −0.15 | 0.06 | −0.27 to −0.03 | 0.016 | ||
| Insulin for GDM | 0.65 | 0.16 | 0.35–0.96 | <0.001 | ||
| IVS | 0.302/0.295 | −1,142.768 | ||||
| Gestational age | 0.10 | 0.02 | 0.06–0.15 | <0.001 | ||
| Ponderal index | 0.20 | 0.09 | 0.02–0.39 | 0.033 | ||
| Placental weight | −0.00 | 0.00 | −0.00 to −0.00 | 0.019 | ||
| Placental diameter 2, cm | 0.08 | 0.02 | 0.04–0.12 | <0.001 | ||
| Placental thickness, cm | 0.18 | 0.06 | 0.08–0.29 | 0.001 | ||
| LGA | 0.89 | 0.09 | 0.71–1.07 | <0.001 | ||
| SGA | −0.54 | 0.10 | −0.74 to −0.34 | <0.001 | ||
| GDM | 0.19 | 0.07 | 0.05–0.34 | 0.010 | ||
| LVIDd b | 0.266/0.255 | −1,663.77 | ||||
| Gestational age | 0.30 | 0.04 | 0.21–0.38 | <0.001 | ||
| Chest circumference | 0.07 | 0.02 | 0.02–0.12 | 0.004 | ||
| Maternal BMI | −0.03 | 0.01 | −0.05 to −0.01 | 0.002 | ||
| Placental diameter 1, cm | −0.07 | 0.03 | −0.13 to −0.00 | 0.039 | ||
| Placental diameter 2, cm | 0.21 | 0.05 | 0.12–0.30 | <0.001 | ||
| NICU admission | −0.36 | 0.15 | −0.65 to −0.07 | 0.014 | ||
| Male | 0.63 | 0.13 | 0.37–0.88 | <0.001 | ||
| LGA | 0.85 | 0.18 | 0.50–1.19 | <0.001 | ||
| SGA | −1.29 | 0.21 | −1.70 to −0.89 | <0.001 | ||
| Normal APGAR 5 | −0.90 | 0.35 | −1.57 to −0.22 | 0.01 | ||
| LVIDs | 0.154/0.145 | −1,468.951 | ||||
| Gestational age | 0.20 | 0.03 | 0.13–0.26 | <0.001 | ||
| Chest circumference | 0.05 | 0.02 | 0.02–0.09 | 0.006 | ||
| Maternal BMI | −0.02 | 0.01 | −0.04 to −0.01 | 0.005 | ||
| Placental diameter 2, cm | 0.07 | 0.03 | 0.01–0.13 | 0.016 | ||
| NICU admission | −0.38 | 0.11 | −0.60 to −0.17 | 0.001 | ||
| Male | 0.36 | 0.10 | 0.16–0.56 | <0.001 | ||
| LGA | 0.31 | 0.14 | 0.04–0.58 | 0.026 | ||
| SGA | −0.63 | 0.16 | −0.94 to −0.31 | <0.001 | ||
| LVPWd c | 0.300/0.292 | −678.978 | ||||
| Gestational age | 0.07 | 0.01 | 0.05–0.10 | <0.001 | ||
| Maternal age | 0.01 | 0.00 | 0.00–0.01 | 0.036 | ||
| Placental diameter 2, cm | 0.07 | 0.01 | 0.05–0.09 | <0.001 | ||
| Placental thickness, cm | 0.1 | 0.03 | 0.03–0.16 | 0.003 | ||
| Male | 0.08 | 0.04 | 0.00–0.16 | 0.044 | ||
| LGA | 0.44 | 0.05 | 0.33–0.54 | <0.001 | ||
| SGA | −0.22 | 0.06 | −0.33 to −0.10 | <0.001 | ||
| LVPWs d | 0.322/0.315 | −792.304 | ||||
| Gestational age | 0.06 | 0.02 | 0.03–0.09 | <0.001 | ||
| Placental diameter 2, cm | 0.08 | 0.01 | 0.05–0.11 | <0.001 | ||
| Placental thickness, cm | 0.14 | 0.04 | 0.07–0.22 | <0.001 | ||
| LGA | 0.49 | 0.06 | 0.37–0.61 | <0.001 | ||
| SGA | −0.43 | 0.07 | −0.57 to −0.30 | <0.001 | ||
| Hispanic ethnicity | 0.29 | 0.12 | 0.06–0.52 | 0.013 | ||
| Lvmass e | 0.406/0.398 | −2030.394 | ||||
| Gestational age | 0.44 | 0.07 | 0.30–0.57 | <0.001 | ||
| Placental diameter 1, cm | −0.11 | 0.05 | −0.21 to −0.02 | 0.024 | ||
| Placental diameter 2, cm | 0.47 | 0.07 | 0.33–0.61 | <0.001 | ||
| Placental thickness, cm | 0.40 | 0.17 | 0.07–0.73 | 0.017 | ||
| Male | 0.70 | 0.20 | 0.30–1.10 | 0.001 | ||
| LGA | 3.03 | 0.28 | 2.49–3.58 | <0.001 | ||
| SGA | −1.89 | 0.31 | −2.50 to −1.29 | <0.001 | ||
| Primiparity | −0.62 | 0.22 | −1.05 to −0.19 | 0.005 | ||
| Insulin for GDM | 1.09 | 0.56 | −0.00 to 2.18 | 0.051 | ||
| LVmass/vol | 0.191/0.184 | −3,161.363 | ||||
| Gestational age | 0.53 | 0.27 | 0.01–1.06 | 0.047 | ||
| Placental diameter 1, cm | −0.55 | 0.20 | −0.94 to −0.17 | 0.005 | ||
| Placental diameter 2, cm | 1.53 | 0.28 | 0.98–2.08 | <0.001 | ||
| Placental thickness, cm | 1.63 | 0.64 | 0.37–2.89 | 0.011 | ||
| LGA | 7.61 | 1.08 | 5.49–9.72 | <0.001 | ||
| SGA | −2.83 | 1.17 | −5.13 to −0.53 | 0.016 | ||
| Primiparity | −1.84 | 0.85 | −3.52 to −0.16 | 0.032 | ||
| FS | 0.050/0.047 | −2,351.251 | ||||
| BW/PW ratio | 0.29 | 0.13 | 0.03–0.55 | 0.027 | ||
| LGA | 1.81 | 0.36 | 1.10–2.53 | <0.001 | ||
| SGA | −1.00 | 0.41 | −1.80 to −0.19 | 0.015 | ||
| ASH f | 0.054 | −475.797 | ||||
| NICU admission | 1.65 | 0.29 | 1.18–2.32 | 0.004 | ||
| LGA | 1.62 | 0.32 | 1.10–2.38 | 0.015 | ||
| Hispanic ethnicity | 0.31 | 0.14 | 0.12–0.73 | 0.011 | ||
| White ethnicity | 0.50 | 0.09 | 0.35–0.70 | <0.001 | ||
| Other ethnicity | 0.45 | 0.17 | 0.20–0.92 | 0.038 |
-
aOther variables controlled for in this model: GDM control (diet and medical treatment), bother variables controlled for in this model: APGAR1 (normal and severly depressed), cother variables controlled for in this model: GDM control (diet, medical and insulin treatment), dother variables controlled for in this model: Ethnicity (Asian, Whites and others), eother variables controlled for in this model: GDM control (diet and medical treatment), fother variables controlled for in this model: SGA category and Asian ethnicity, LVmass, left ventricular mass; LVmass/vol, LVmass to volume ratio; IVSd, inter-ventricular septal thickness during diastole; IVSs, inter-ventricular septal thickness during systole; LVIDd, LV internal dimension during diastole; LVIDs, LV internal dimension during systole; LVPWd, LV posterior wall thickness at end of diastole; LVPWs, LV posterior wall thickness at end of systole; IVS/LVPW, inter-ventricular septal thickness to LV posterior wall thickness ratio in diastole; FS, shortening fraction; ASH, asymmetrical septal hypertrophy; NICU, neonatal intensive care unit; BMI, body mass index; LGA, large for gestational age; SGA, small for gestational age; GDM, gestational diabetes mellitus; BW/PW, birth weight to placental weight.
GA displayed strong correlations with multiple LV dimensions, showing significant relationships with IVSd (p=0.011), IVSs (p<0.001), LVIDd (p<0.001), LVIDs (p<0.001), LVPWd (p<0.001), LVPWs (p<0.001), LVmass (p<0.001), and LVmass/volume ratio (p=0.047). Neonatal size factors, including size category, BW, ponderal index, and chest circumference, also influenced LV parameters. Additionally, male sex, NICU admission, and APGAR scores were associated with specific LV dimensions.
Among maternal factors, primiparity showed associations with decreased IVSd (estimate=−0.15, p=0.016), LVmass (estimate=−0.62, p=0.005), and LVmass/volume ratio (estimate=−1.84, p=0.032). GDM exhibited a significant increase in IVSs (p=0.010), while insulin use was positively correlated with IVSd (p<0.001). Maternal BMI was linked to decreased LVID during diastole (p=0.002) and systole (p=0.005), whereas maternal age was associated with increased LVPWd (p=0.036). Furthermore, White and Hispanic ethnicities related to increased ASH.
Among the placental factors analyzed, placental thickness and smallest diameter exhibited significant associations with increased LV dimensions. Placental thickness was linked to substantial increases in IVSd (p=0.002), IVSs (p=0.001), LVPWd (p=0.003), LVPWs (p<0.001), LVmass (p=0.017), and LVmass/volume (p=0.011). Similarly, the shortest diameter of the placenta displayed significant positive correlations with IVSd (p<0.001), IVSs (p<0.001), LVIDd (p<0.001), LVIDs (p=0.016), LVPWd (p<0.001), LVPWs (p<0.001), LVmass (p<0.001), and LVmass/volume (p<0.001). Moreover, the BW/PW ratio was associated with an increase in FS, with an estimated coefficient of 0.29 (95 % CI 0.03–0.55, p=0.027). Additionally, PW showed a significant correlation with IVSs (p=0.019), while the longest diameter of the placenta was associated with a decrease in LVIDd (estimate =−0.07, p=0.039), LVmass (estimate =−0.11, p=0.024), and LVmass/volume (estimate =−0.55, p=0.005).
Discussion
The primary objective of this prospective cohort study was to investigate the relationship between the BW/PW ratio and LV dimensions in newborns while considering other neonatal, maternal, and placental factors. Our study found several significant associations between neonatal and maternal factors with various LV parameters. In our study, GA correlated with multiple LV dimensions, suggesting prematurity or delayed gestational development affects cardiac function. This association between GA multiple LV dimensions is well documented in the literature [24]. Neonatal factors (BW, ponderal index, chest circumference) were also linked in our study to specific LV dimensions, highlighting fetal growth’s influence on cardiac development. We have shown that primiparity is associated with decreased IVSd, LVmass, and LVmass/volume ratio, implying first-time mothers may impact a newborn’s cardiac development. This could possibly be due to physiological adaptations, hemodynamic changes, structural adjustments, maternal age, and genetic/environmental factors influencing the cardiac parameters during the first pregnancy.
In our study, we used the 10th and 90th percentile as the cutoff for dividing our population based on the BW/PW ratio. One study aimed to investigate the correlation between the BW/PW ratio and major congenital anomalies in 735 singleton infants born at 34–41 weeks of gestation [25]. Of these infants, 15 % showed major congenital anomalies. The study found that the BW/PW ratio was not significantly associated with the presence or absence of major anomalies, and the distribution pattern of the BW/PW ratio varied across different major anomaly subgroups [25]. However, major anomalies tended to aggregate in the 90th percentile of the BW/PW ratio [25]. Therefore, we recommend the use of such cutoffs in future research.
Neonates born to mothers with GDM are known to have larger LV dimensions compared to those born to non-diabetic mothers, indicating accelerated cardiac growth and temporary hypertrophy [26]. This is further compounded in cases of maternal type one or type two DM, where the risk of pathological ventricular hypertrophy in neonates is even higher [27]. These findings underscore the necessity of vigilant monitoring to manage perinatal complications. Studies have also shown that infants born to diabetic mothers have higher rates of ASH and increased IVS thickness, regardless of GA appropriateness [28]. In our research, we found that GDM significantly increased systolic IVS thickness (p=0.010), and maternal insulin use was positively correlated with diastolic IVS thickness (p<0.001). These results align with existing literature and highlight the impact of maternal diabetes and insulin use on neonatal cardiac development.
Many studies have attempted to identify the factors influencing LV parameters, and some neonatal factors have previously been linked to LV size and function. According to one research, LV dimensions can vary depending on age, sex, body size, and ethnicity [29]. A study found that low BW was associated with decreased left ventricular mass and increased wall stress in young adults [30]. It has also been reported that maternal age is significantly associated with poor LV function [31]. Another research group discovered that both maternal obesity and weight gain are linked to increased fetal LVmass [32]. Similarly, maternal ethnicity has been shown to influence fetal cardiovascular development, with South Asians being predisposed to altered heart structure and function [33]. One study examined 981 mother-offspring pairs from the Shanghai Birth Cohort to investigate the association between maternal gestational weight gain (GWG) and LV geometry and function in the offspring at four years of age [32]. The results showed that excessive maternal GWG, particularly in the second and third trimesters, was positively correlated with IVSd and LVmass. Additionally, excessive GWG during these trimesters increased the risk of LV eccentric and concentric hypertrophy in the offspring [32].
Interestingly in our paper, placental factors, such as placental thickness and smallest diameter, showed significant and independent associations with increased LV dimensions, indicating the potential role of placental health and efficiency in fetal cardiac development. The BW/PW ratio was associated with an increase in FS, which could imply a connection between placental efficiency and cardiac function. This might suggest that a more efficient placenta, as reflected in a lower BW/PW ratio, is associated with better cardiac function, possibly due to improved nutrient transfer during fetal development. However, PW had only a significant correlation with one LV parameter (IVSs), indicating that other placental measurements might have a more significant impact on cardiac development. Placental thickness and the shortest diameter of the placenta exhibited significant positive correlations with IVSd, IVSs, LVIDd, LVIDs, LVPWd, LVPWs, LV mass, and LV mass/volume, indicating substantial increases in these cardiac parameters. The notable associations between placental factors with increased LV dimensions raise intriguing questions about the impact of placental health and efficiency on cardiac development. The positive correlation between the BW/PW ratio and FS further supports the hypothesis that placental efficiency plays a role in fetal cardiac function.
It is well-known in the literature that the placenta plays an important role in the development of congenital heart disease (CHD). One study analyzed placental pathology from singleton neonates prenatally diagnosed with CHD and delivered at term [34]. Placental abnormalities, such as smaller-than-expected size, chorangiosis, hypomature villi, thrombosis, and infarction, were common in CHD cases, with newborns with transposition of the great arteries exhibiting the most significant placental abnormality [34]. Another retrospective cohort study investigated the relationship between neonatal BW, head circumference, PW, and placental pathology in pregnancies affected by CHD [35]. Placental pathology was found in 37 % of cases, and infants with CHD showed preserved BW and head circumferences despite small placentas and increased prevalence of placental pathology, indicating efficient placental function [35]. Abnormal placental growth may offer prenatal diagnostic value, and discordant placental and neonatal growth may suggest a vascular anomaly predisposing fetuses to CHD. One research group examined 6,975 men born in Helsinki between 1934 and 1944 to investigate the link between low BW and later risk of coronary heart disease [36]. Three different placental phenotypes were identified as predictors of the disease, depending on combinations of maternal height, BMI, and placental size [36]. Variations in three processes of normal placental development were hypothesized to lead to fetal malnutrition, possibly contributing to the increased risk of coronary heart disease in individuals with lower birth weights [36]. Based on our findings, we hypothesize that placental dimensions, thickness, and the BW/PW ratio may serve as potential indicators for the presence of CHD in newborns.
Strength and limitations
This study exhibits several notable strengths that contribute to its scientific merit. Firstly, it adopts a prospective cohort design, allowing for the exploration of associations and reducing the potential for bias inherent in retrospective studies. The inclusion of neonates with echocardiographic evaluations conducted primarily for murmur evaluation as part of routine screening adds clinical relevance to the findings, making them more generalizable to clinical settings. Comprehensive consideration of neonatal, maternal, and placental factors provides a holistic understanding. Meticulous handling of missing data with MIPCA, coupled with genetic algorithm-based model selection followed by a backward stepwise algorithm, ensures comprehensive exploration and statistical validity in assessing predictor variables’ impact on LV parameters.
Despite the valuable findings of this study, it is important to acknowledge its limitations. The single-center nature of the study may limit generalizability of the results to other populations [37]. Additionally, the use of routine screening echocardiography may introduce selection bias, as neonates with major cardiac pathologies were excluded, potentially affecting the representation of certain LV dimensions in the study. The imputation technique used to handle missing data may introduce imprecision in the results, as using MIPCA for missing data has limitations. Efforts to address missing data through transformations and MIPCA may introduce biases. PCA for imputing missing data assumes a multivariate normal distribution, potentially misaligned with real-world datasets. It also assumes missing values occur at random, introducing bias, and may result in information loss or noise. Furthermore, due to the study’s observational design, causality between the BW/PW ratio and LV dimensions cannot be established, and other confounding factors may influence the results.
In addition, the study has other limitations. The lack of long-term follow-up of participants after hospital discharge makes it challenging to assess the long-term outcomes of LV function and overall cardiovascular risk for SGA infants. Moreover, the incorporation of neonates undergoing echocardiography for murmurs, predominantly functional in nature, introduces a potential confounding factor, including the likelihood of detecting minor congenital heart defects. This complicates the derivation of clear conclusions and hinders generalizability to broader populations, thereby challenging the clinical applicability and utility of the findings. Ideally, the study should be conducted on a cohort of unselected and healthy children to enhance the robustness and relevance of the results. Therefore, caution must be taken when interpreting the findings of this study. The study design was not blinded, which could introduce bias in measurements and interpretation of the results. Additionally, important confounding variables like maternal smoking, a known risk factor for low birth weight and cardiac dysfunction, were not included in the analysis [38]. Another missing risk factor and a potential limitation of our study is the lack of records regarding pre-existing maternal type one and two diabetes, which is well-known to influence both neonatal size and increase the risk of CHDs. Moreover, our collected data lacks information on the timing of the diagnosis (preterm/term onset) and the severity of preeclampsia, potentially introducing bias into our results. Preeclampsia is a significant influencer of cardiac remodeling during development as it imposes strain on the placenta and, consequently, affects the size of the baby. This, in turn, can place a burden on the developing heart. Understanding the specific timing and severity of preeclampsia is crucial for a more comprehensive analysis of its impact on cardiac health in neonates, which was missing in our study. We also did not have records of other medications used during pregnancy. Furthermore, the reliance solely on echocardiography to evaluate LV function has inherent limitations [39], and advanced imaging techniques for assessing LV morphology were not employed in the study. Lastly, it is worth noting that a single cardiologist conducted the echocardiographic evaluations, which may impact interobserver variability.
Conclusions
This single-center prospective cohort study sheds light on the associations between neonatal, maternal, and placental factors with LV dimensions in newborns. We have shown that the BW/PW ratio can independently affect the LV dimensions and morphology. This study also underscores the significance of placental factors, such as placental thickness and smallest diameter, by revealing their correlations with increased LV dimensions, emphasizing the potential influence of placental health and efficiency on fetal cardiac growth. Additionally, significant relationships were observed between GA, neonatal size factors, maternal factors, and specific LV parameters, further highlighting the complex interplay of perinatal factors on cardiac development. Further research, including longitudinal and interventional multi-center studies, is required to fully understand the complex interplay between placental efficiency, maternal factors, and fetal cardiac development.
Acknowledgments
Open access funding provided by Qatar National Library. We would like to thank the Statistical Consulting Unit at Qatar University for their assistance through the statistical analysis of our research data.
-
Research ethics: Data collection and analysis were conducted in accordance with the Helsinki Declaration, and ethical approval was obtained from the IRB of NewYork-Presbyterian Brooklyn Methodist Hospital. All methods were performed in accordance with the relevant guidelines and regulations.
-
Informed consent: Since echocardiography, a minimal risk procedure, was performed based on clinical indications, obtaining consent from the neonates’ legal guardians was waivered by NewYork-Presbyterian Brooklyn Methodist Hospital’s IRB.
-
Author contributions: IE, DM and AG: formal analysis, data curation, methodology, validation, visualization, writing – original draft, writing – review & editing. AA: formal analysis, validation, writing – original draft, writing – review & editing. MC: conducted the echo studies. MH: supervised the data collection and organization of the data sheets. DH, DS, NR, BD, and FS: patient allocation and data collection. MG, AN, and PN: provided supervision and approval for the study. All authors have accepted responsibility for the entire content of this manuscript and approved its submission.
-
Competing interests: The authors state no conflict of interest.
-
Research funding: The publication of this article was funded by Qatar National Library. This research did not receive any grants from funding agencies in the public, commercial, or not-for-profit sectors.
-
Data availability: All data analyzed are presented in the tables of this manuscript. Original datasets used during the current study are available from the corresponding author upon reasonable request.
References
1. Díaz, P, Powell, TL, Jansson, T. The role of placental nutrient sensing in maternal-fetal resource allocation. Biol Reprod 2014;91:82. https://doi.org/10.1095/biolreprod.114.121798.Search in Google Scholar PubMed PubMed Central
2. Roland, MCP, Friis, CM, Voldner, N, Godang, K, Bollerslev, J, Haugen, G, et al.. Fetal growth versus birthweight: the role of placenta versus other determinants. PLoS One 2012;7:e39324. https://doi.org/10.1371/journal.pone.0039324.Search in Google Scholar PubMed PubMed Central
3. Wallace, J, Horgan, G, Bhattacharya, S. Placental weight and efficiency in relation to maternal body mass index and the risk of pregnancy complications in women delivering singleton babies. Placenta 2012;33:611–8. https://doi.org/10.1016/j.placenta.2012.05.006.Search in Google Scholar PubMed
4. Naeye, RL. Do placental weights have clinical significance? Hum Pathol 1987;18:387–91. https://doi.org/10.1016/s0046-8177(87)80170-3.Search in Google Scholar PubMed
5. Alexander, BT, Dasinger, JH, Intapad, S. Fetal programming and cardiovascular pathology. Compr Physiol 2015;5:997–1025. https://doi.org/10.1002/cphy.c140036.Search in Google Scholar PubMed PubMed Central
6. Benagiano, M, Mancuso, S, Brosens, JJ, Benagiano, G. Long-term consequences of placental vascular pathology on the maternal and offspring cardiovascular systems. Biomolecules 2021;11:1625. https://doi.org/10.3390/biom11111625.Search in Google Scholar PubMed PubMed Central
7. Sluysmans, T, Colan, SD. Theoretical and empirical derivation of cardiovascular allometric relationships in children. J Appl Physiol 2005;99:445–57, https://doi.org/10.1152/japplphysiol.01144.2004.Search in Google Scholar PubMed
8. Cantinotti, M, Scalese, M, Murzi, B, Assanta, N, Spadoni, I, Festa, P, et al.. Echocardiographic nomograms for ventricular, valvular and arterial dimensions in Caucasian children with a special focus on neonates, infants and toddlers. J Am Soc Echocardiogr 2014;27:179–91.e2. https://doi.org/10.1016/j.echo.2013.10.001.Search in Google Scholar PubMed
9. Pettersen, MD, Du, W, Skeens, ME, Humes, RA. Regression equations for calculation of z scores of cardiac structures in a large cohort of healthy infants, children, and adolescents: an echocardiographic study. J Am Soc Echocardiogr 2008;21:922–34. https://doi.org/10.1016/j.echo.2008.02.006.Search in Google Scholar PubMed
10. Elmakaty, I, Amarah, A, Henry, M, Chhabra, M, Hoang, D, Suk, D, et al.. Perinatal factors impacting echocardiographic left ventricular measurement in small for gestational age infants: a prospective cohort study. BMC Pediatr 2023;23:393. https://doi.org/10.1186/s12887-023-04204-w.Search in Google Scholar PubMed PubMed Central
11. Nascente, LMP, Grandi, C, Aragon, DC, Cardoso, VC. Placental measurements and their association with birth weight in a Brazilian cohort. Rev Bras Epidemiol 2020;23:e200004. https://doi.org/10.1590/1980-549720200004.Search in Google Scholar PubMed
12. Hayward, CE, Lean, S, Sibley, CP, Jones, RL, Wareing, M, Greenwood, SL, et al.. Placental adaptation: what can we learn from birthweight:placental weight ratio? Front Physiol 2016;7:28. https://doi.org/10.3389/fphys.2016.00028.Search in Google Scholar PubMed PubMed Central
13. Lewandowski, AJ, Levy, PT, Bates, ML, McNamara, PJ, Nuyt, AM, Goss, KN. Impact of the vulnerable preterm heart and circulation on adult cardiovascular disease risk. Hypertension 2020;76:1028–37. https://doi.org/10.1161/hypertensionaha.120.15574.Search in Google Scholar
14. von Elm, E, Altman, DG, Egger, M, Pocock, SJ, Gøtzsche, PC, Vandenbroucke, JP. The Strengthening the Reporting of Observational Studies in Epidemiology (STROBE) statement: guidelines for reporting observational studies. J Clin Epidemiol 2008;61:344–9. https://doi.org/10.1016/j.jclinepi.2007.11.008.Search in Google Scholar PubMed
15. Fenton, TR. A new growth chart for preterm babies: Babson and Benda’s chart updated with recent data and a new format. BMC Pediatr 2003;3:13. https://doi.org/10.1186/1471-2431-3-13.Search in Google Scholar PubMed PubMed Central
16. Flatley, C, Sole-Navais, P, Vaudel, M, Helgeland, Ø, Modzelewska, D, Johansson, S, et al.. Placental weight centiles adjusted for age, parity and fetal sex. Placenta 2022;117:87–94. https://doi.org/10.1016/j.placenta.2021.10.011.Search in Google Scholar PubMed
17. Rani, PR, Begum, J. Screening and diagnosis of gestational diabetes mellitus, where do we stand. J Clin Diagn Res 2016;10:Qe01–4. https://doi.org/10.7860/jcdr/2016/17588.7689.Search in Google Scholar
18. Josse, J, Chavent, M, Liquet, B, Husson, F. Handling missing values with regularized iterative multiple correspondence analysis. J Classif 2012;29:91–116. https://doi.org/10.1007/s00357-012-9097-0.Search in Google Scholar
19. Josse, J, Husson, F. missMDA: a package for handling missing values in multivariate data analysis. J Stat Software 2016;70:1–31. https://doi.org/10.18637/jss.v070.i01.Search in Google Scholar
20. Lee, S, Lee, DK. What is the proper way to apply the multiple comparison test? Kor J Anesthesiol 2018;71:353–60. https://doi.org/10.4097/kja.d.18.00242.Search in Google Scholar PubMed PubMed Central
21. Leardi, R, Lupiáñez González, A. Genetic algorithms applied to feature selection in PLS regression: how and when to use them. Chemometr Intell Lab Syst 1998;41:195–207. https://doi.org/10.1016/s0169-7439(98)00051-3.Search in Google Scholar
22. Calcagno, V, de Mazancourt, C. Glmulti: an R package for easy automated model selection with (generalized) linear models. J Stat Software 2010;34:1–29. https://doi.org/10.18637/jss.v034.i12.Search in Google Scholar
23. Heinze, G, Wallisch, C, Dunkler, D. Variable selection – a review and recommendations for the practicing statistician. Biom J 2018;60:431–49. https://doi.org/10.1002/bimj.201700067.Search in Google Scholar PubMed PubMed Central
24. Lu, DF, Tong, XM, Liu, YF, Zhang, H. Reference values for point-of-care echocardiographic measurements of preterm infants in China. Front Pediatr 2022;10:894152. https://doi.org/10.3389/fped.2022.894152.Search in Google Scholar PubMed PubMed Central
25. Takemoto, R, Anami, A, Koga, H. Relationship between birth weight to placental weight ratio and major congenital anomalies in Japan. PLoS One 2018;13:e0206002. https://doi.org/10.1371/journal.pone.0206002.Search in Google Scholar PubMed PubMed Central
26. Bogo, MA, Pabis, JS, Bonchoski, AB, Santos, DCD, Pinto, TJF, Simões, MA, et al.. Cardiomyopathy and cardiac function in fetuses and newborns of diabetic mothers. J Pediatr 2021;97:520–4. https://doi.org/10.1016/j.jped.2020.10.003.Search in Google Scholar PubMed PubMed Central
27. Ullmo, S, Vial, Y, Di Bernardo, S, Roth-Kleiner, M, Mivelaz, Y, Sekarski, N, et al.. Pathologic ventricular hypertrophy in the offspring of diabetic mothers: a retrospective study. Eur Heart J 2007;28:1319–25. https://doi.org/10.1093/eurheartj/ehl416.Search in Google Scholar PubMed
28. Vela-Huerta, MM, Amador-Licona, N, Villagomez, HVO, Ruiz, AH, Guizar-Mendoza, JM. Asymmetric septal hypertrophy in appropriate for gestational age infants born to diabetic mothers. Indian Pediatr 2019;56:314–6. https://doi.org/10.1007/s13312-019-1522-6.Search in Google Scholar
29. Pfaffenberger, S, Bartko, P, Graf, A, Pernicka, E, Babayev, J, Lolic, E, et al.. Size matters! Impact of age, sex, height, and weight on the normal heart size. Cir Cardiovasc Imag 2013;6:1073–9. https://doi.org/10.1161/circimaging.113.000690.Search in Google Scholar PubMed
30. Sjöholm, P, Pahkala, K, Davison, B, Niinikoski, H, Raitakari, O, Juonala, M, et al.. Birth weight for gestational age and later cardiovascular health: a comparison between longitudinal Finnish and indigenous Australian cohorts. Ann Med 2021;53:2060–71. https://doi.org/10.1080/07853890.2021.1999491.Search in Google Scholar PubMed PubMed Central
31. Zhu, D, Chen, W, Pan, Y, Li, T, Cui, M, Chen, B. The correlation between maternal age, parity, cardiac diastolic function and occurrence rate of pre-eclampsia. Sci Rep 2021;11:8842. https://doi.org/10.1038/s41598-021-87953-x.Search in Google Scholar PubMed PubMed Central
32. Wang, J, Du, B, Wu, Y, Li, Z, Chen, Q, Zhang, X, et al.. Association of maternal gestational weight gain with left ventricle geometry and function in offspring at 4 years of age: a prospective birth cohort study. Front Pediatr 2021;9:722385. https://doi.org/10.3389/fped.2021.722385.Search in Google Scholar PubMed PubMed Central
33. Khan, S, Whatmore, A, Perchard, R, Khan, A, Vyas, A, Dua, J, et al.. Maternal factors in pregnancy and ethnicity influence childhood adiposity, cardiac structure, and function. Front Pediatr 2022;10:900404. https://doi.org/10.3389/fped.2022.900404.Search in Google Scholar PubMed PubMed Central
34. Rychik, J, Goff, D, McKay, E, Mott, A, Tian, Z, Licht, DJ, et al.. Characterization of the placenta in the newborn with congenital heart disease: distinctions based on type of cardiac malformation. Pediatr Cardiol 2018;39:1165–71. https://doi.org/10.1007/s00246-018-1876-x.Search in Google Scholar PubMed PubMed Central
35. Desmond, A, Imany-Shakibai, H, Wong, D, Kwan, L, Satou, G, Sklansky, M, et al.. Prenatal congenital heart disease and placental phenotypes: preserved neonatal weight despite small placentas. JACC Adv 2023;2:100383. https://doi.org/10.1016/j.jacadv.2023.100383.Search in Google Scholar
36. Eriksson, JG, Kajantie, E, Thornburg, KL, Osmond, C, Barker, DJP. Mother’s body size and placental size predict coronary heart disease in men. Eur Heart J 2011;32:2297–303. https://doi.org/10.1093/eurheartj/ehr147.Search in Google Scholar PubMed PubMed Central
37. He, Z, Tang, X, Yang, X, Guo, Y, George, TJ, Charness, N, et al.. Clinical trial generalizability assessment in the big data era: a review. Clin Transl Sci 2020;13:675–84. https://doi.org/10.1111/cts.12764.Search in Google Scholar PubMed PubMed Central
38. Jaddoe, VW, Troe, EJ, Hofman, A, Mackenbach, JP, Moll, HA, Steegers, EA, et al.. Active and passive maternal smoking during pregnancy and the risks of low birthweight and preterm birth: the Generation R Study. Paediatr Perinat Epidemiol 2008;22:162–71. https://doi.org/10.1111/j.1365-3016.2007.00916.x.Search in Google Scholar PubMed
39. Potter, E, Marwick, TH. Assessment of left ventricular function by echocardiography: the case for routinely adding global longitudinal strain to ejection fraction. JACC Cardiovasc Imaging 2018;11:260–74. https://doi.org/10.1016/j.jcmg.2017.11.017.Search in Google Scholar PubMed
© 2024 the author(s), published by De Gruyter, Berlin/Boston
This work is licensed under the Creative Commons Attribution 4.0 International License.
Articles in the same Issue
- Frontmatter
- Corner of Academy
- The outcome of reduced and non-reduced triplet pregnancies managed in a tertiary hospital during a 15-year-period – a retrospective cohort study
- Original Articles – Obstetrics
- Parental refusal of prenatal screening for aneuploidies
- Analysis of maternal mortality in Berlin, Germany – discrepancy between reported maternal mortality and comprehensive death certificate exploration
- Second twin outcome at birth: retrospective analysis in a single tertiary centre in Malaysia
- Incidence and first trimester risk factors of stillbirth in Indonesia
- Correlation of fetal heart rate dynamics to inflammatory markers and brain-derived neurotrophic factor during pregnancy
- Preliminary assessment of the Healthy Early Life Moments (HELMS) webinars in empowering Developmental Origins of Health and Disease (DOHaD) concept among healthcare professionals – a pragmatic serial cross-sectional study
- Original Articles – Fetus
- The changing Doppler patterns and perinatal outcomes of monochorionic diamniotic twins with selective fetal growth restriction
- Effects of umbilical vein flow on midbrain growth and cortical development in late onset fetal growth restricted fetuses: a prospective cross-sectional study
- Original Articles – Neonates
- Prediction of bronchopulmonary dysplasia by the chest radiographic thoracic area on day one in infants with exomphalos
- Impact of birth weight to placental weight ratio and other perinatal risk factors on left ventricular dimensions in newborns: a prospective cohort analysis
- Changes in regional tissue oxygen saturation values during the first week of life in stable preterm infants
- Letters to the Editor
- Optimal closure of the uterus during cesarean section: beyond the two layers
- Reply to: “Optimal closure of the uterus during cesarean section: beyond the two layers” commenting on “The effect of uterine closure technique on cesarean scar niche development after multiple cesarean deliveries”