
Expression of genes involved in inflammation and growth – does sampling site in human full-term placenta matter?
-
Marianne Allbrand
 ,
Jan Åman
,
Jan Åman
 and
Maria Lodefalk
and
Maria Lodefalk

Abstract
Objective
To investigate the placental gene expression of substances in the inflammatory cascade and growth factors at nine different well-defined sampling sites in full-term placentas from 12 normal weight healthy non-smoking women with an uncomplicated singleton pregnancy.
Methods
All placentas (six girls and six boys) were delivered vaginally. Quantitative real-time polymerase chain reaction was used to analyze toll receptor-2 and -4, interleukin-6 and -8, tumor necrosis factor-α, leptin, ghrelin, insulin-like growth factor-1 and -2, hepatocyte growth factor, hepatocyte growth factor receptor and insulin receptor (IR).
Results
The leptin gene and the IR gene showed higher expression in lateral regions near the chorionic plate compared to central regions near the basal plate (P = 0.028 and P = 0.041, respectively).
Conclusion
Our results suggest that the sampling site may influence the gene expression for leptin and IR in placental tissue obtained from full-term normal pregnancies. We speculate that this may be due to differences in placental structure and perfusion and may be important when future studies are designed.
Introduction
The placenta plays a central role in maternal adaptation to pregnancy and in fetal development and growth [1]. Substances produced by the placenta influence the placenta itself, the pregnant woman and the fetus. Such substances include inflammatory markers and growth factors [2], [3]. Toll receptor-2 and -4 (TLR-2 and -4), interleukin-6 and -8 (IL-6 and IL-8), and tumor necrosis factor-α (TNF-α) produced by the placenta decrease maternal insulin sensitivity among other things, which is crucial for the flow of nutrients to the fetus [3], [4]. The placental expression of the leptin, insulin-like growth factor-1 and -2 (IGF-1 and IGF-2), insulin receptor (IR), hepatocyte growth factor (HGF) and hepatocyte growth factor receptor (HGFR) genes have significant impact on placental function and the developing fetus [5], [6], [7]. In addition, ghrelin produced by the placenta seems to be involved in the course of pregnancy [8]. Thus, the study of inflammatory and growth-promoting substances in the placenta is essential for our understanding of pregnancy-induced maternal adaptation, fetal growth and development, and pregnancy complications. However, the placental sampling site may influence the results of such studies.
The placenta contains several cell types, which are not uniformly distributed, and they express genes differently [9]. For example, inflammatory substances and growth-promoting factors are expressed by trophoblasts covering the villus tree, endothelial cells and placental macrophages found in the villus core [3], [6]. Furthermore, some genes, such as leptin may be expressed simultaneously in all these cell types, whereas other genes, for example, TNF-α, may be expressed in only one of the cell types at the time, to generate pleiotropic biological effects [3]. Earlier studies evaluating the importance of the sampling site in the placenta have shown divergent results. The expression of genes encoding human chorionic gonadotropin, human placental lactogen, placental growth hormone, genes related to hypoxia and genes with aberrant expression in intrauterine growth restriction (IUGR), and pre-eclampsia (PE) were all found to be dependent on the sampling site [10], [11], [12], [13]. However, the expression of genes involved in local hemostasis and angiogenesis were not [14]. To the best of our knowledge, the impact of the sampling site on the placental expression of genes encoding inflammatory or growth factors has not been explored. This study aimed at investigating this issue in full-term placentas from healthy women with uncomplicated pregnancies. To minimize the possible influence of the fetal sex [15], we included an equal number of placentas from girls and boys. Our hypothesis was that the gene expression of inflammatory substances or growth factors differ by sampling site.
Materials and methods
Subjects
We included 12 women in this study. For estimation of the sample size needed, we reviewed previous publications on the subject [10], [11]. One study found differences in gene expression according to sampling site using 10 placentas [10] and another using six placentas [11]. The women in this study gave birth between May 2013 and April 2015, all with Nordic ethnicity. To be included in the study, the woman had to be healthy, have normal weight [body mass index (BMI) 18.5–25 kg/m2] and gain weight during the pregnancy within the recommendation of the Institute of Medicine (11–16 kg) [16]. Furthermore, the pregnancy had to be uncomplicated and singleton. The delivery had to be vaginal as placental gene expression seems to be affected by delivery mood [15], [17]. It also had to be uneventful and spontaneous at full term (38–42 weeks of gestation). The newborn baby had to be healthy with an Apgar score above 7 at 5 min of age and without any signs of malformation. The infant’s birth weight was not restricted in the study. The newborns’ birth weight and length z-scores were calculated using a Swedish reference population [18]. We included an equal number of female and male placentas. Women who smoked during the pregnancy were not eligible for the study. Written informed consent was obtained from all participating women, and the study was approved by the Ethical Review Board in Uppsala, Sweden (2012/531).
Placental tissue sample collection
Only placentas with a centrally inserted umbilical cord (i.e. located within the inner third of the placental disk radius) and placentas without any macroscopic abnormalities were included in the study. The same person (MA) collected all samples. She was present at the delivery of all children included in the study to avoid delayed collection of tissue samples as this may impact gene expression [15]. Thus, all samples were taken immediately after delivery. The samples were taken from nine well-defined sites in each placenta as described previously by Wyatt et al. [11] (Figure 1). To obtain these samples, a triangular segment of each placenta was excised with its base located 2 cm from the lateral edge and its apex near the cord insertion. The decidual layer along with the basal plate, as well as the chorionic surface and membranes, were removed. The samples, approximately 0.5 g each, were rinsed in saline (Gibco, Life Technologies, Stockholm, Sweden) to remove blood and stored at −80°C in RNAlater (Ambion, Stockholm, Sweden) until analysis.
![Figure 1: Locations of sampling sites 1A–3C within the placenta.A=mean of 1A, 2A, 3A; B=mean of 1B, 2B, 3B; C=mean of 1C, 2C, 3C. 1=mean of 1C, 1B, 1A; 2=mean of 2C, 2B, 2A; 3=mean of 3C, 3B, 3A. Original artwork by Wyatt et al. [11] reproduced with permission.](/document/doi/10.1515/jpm-2018-0290/asset/graphic/j_jpm-2018-0290_fig_001.jpg)
Locations of sampling sites 1A–3C within the placenta.
A=mean of 1A, 2A, 3A; B=mean of 1B, 2B, 3B; C=mean of 1C, 2C, 3C. 1=mean of 1C, 1B, 1A; 2=mean of 2C, 2B, 2A; 3=mean of 3C, 3B, 3A. Original artwork by Wyatt et al. [11] reproduced with permission.
RNA extraction and cDNA synthesis
The procedures for RNA preparation and cDNA synthesis have been described previously [19]. Fifteen to 20 mg of placental tissue was homogenized in batches using TissueLyser LT (Qiagen, Nordic, Sollentuna, Sweden) for 4 min at 30 Hz and then placed in −80°C until RNA isolation with Allprep DNA/RNA/protein Mini Kit, (Qiagen) was completed according to the manufacturer’s instructions. The RNA concentrations were measured by a Thermo Scientific NanoDrop 2000 (Fisher Scientific, Göteborg, Sweden). cDNA was synthesized from 100 ng of RNA using a High Capacity cDNA Reverse Transcription Kit (Applied Biosystems, Foster City, CA, USA) according to the manufacturer’s instructions. For each sample, four cDNA reactions were performed. They were pooled and stored at −20°C until further analysis.
Quantitative real-time PCR and choice of reference gene
Quantitative real-time PCR (qPCR) was performed using a 7900HT Fast Real-Time polymerase chain reaction (PCR) System (Applied Biosystems, Foster City, CA, USA). The probes used and their assay IDs are presented in Table 1. The PCR reagents and the well plates were obtained from Applied Biosystems. Samples from the same placenta were run in duplicate with a TaqMan® Fast Universal PCR Master Mix (2×), no AmpErase® UNG (Applied Biosystems™) in 384-well plates. Crossing threshold (Ct) values were calculated by 7900HT Fast Real-Time PCR System software using the second-derivative maximum method. Transcription of reference genes may differ between clinical groups [21]. Cytochrome c-1 (CYC1), glyceraldehyde-3-phosphate dehydrogenase (GAPDH), tyrosine 3-monooxygenase/tryptophan 5-monooxygenase activation protein, zeta polypeptide (YWHAZ), and topoisomerase 1 (TOP1) were selected as possible reference genes. The expression stability value (Table 1) was calculated using the “NormFinder” algorithm [20], and CYC1 was chosen for normalization of the genes of interest as it showed the best stability value in our samples. The ΔCt method was used to normalize the expression level of the gene of interest to the reference gene CYC1 [22]. The ΔΔCt method was used to determine fold change in gene expression normalized to CYC1 and relative to a control site [22]. Ct values reported as >35 or as “not detected” were considered to be negative, according to the manufacturer’s recommendation.
The probes used together with assay IDs of the genes of interest and the stability values of the reference genes.
| Stability valuea | Assay ID | |
|---|---|---|
| Inflammatory and growth factor genes | ||
| Toll-like receptor 2 (TLR-2) | Hs00152932_m1 | |
| Toll-like receptor 4 (TLR-4) | Hs01060206_m1 | |
| Interleukin 6 (IL-6) | Hs00985639_m1 | |
| Interleukin 8 (IL-8) | Hs00174103_m1 | |
| Tumor necrosis factor alpha (TNFα) | Hs00174128_m1 | |
| Leptin | Hs00174877_m1 | |
| Ghrelin | Hs01074053_m1 | |
| Insulin-like growth factor 1 (IGF-1) | Hs01547656_m1 | |
| Insulin-like growth factor 2 (IGF-2) | Hs00171254_m1 | |
| Hepatocyte growth factor (HGF) | Hs00300159_m1 | |
| Hepatocyte growth factor receptor (HGFR) | Hs01565584_m1 | |
| Insulin receptor (IR) | Hs00961554_m1 | |
| Reference genes | ||
| Cytochrome c-1 (CYC1) | 0.004 | Hs00357718_g1 |
| Glyceraldehyde-3-phosphate dehydrogenase (GAPDH) | 0.006 | Hs99999905_m1 |
| Tyrosine 3-monooxygenase/tryptophan 5-monooxygenase activation protein, zeta polypeptide (YWHAZ) | 0.014 | Hs03044281_g1 |
| Topoisomerase 1 (TOP1) | 0.015 | Hs00243257_m1 |
aAccording to NormFinder [20]. The top-ranked genes are those with the lowest values.
Statistical analysis
Data are given as the mean±standard error of the mean (SEM) or as proportions (%). To reduce the number of comparisons needed, the nine sampling sites were collected into three variables (r1, r2 and r3). This accomplished in two steps. First, the mean values of the expression at the horizontal and the vertical axes were calculated. This gave rise to three horizontal mean values (sites A, B and C) and three vertical mean values (sites 1, 2 and 3), where site A represents the mean basal expression, site B represents the mean middle horizontal expression and site C represents the mean chorionic expression. Site 1 represents the mean central expression, site 2 represents the mean middle vertical expression, and site 3 represents the mean lateral expression (see Figure 1). Three transverse values also exist: the expression at sites 1A, 2B and 3C (see Figure 1). Second, the r value was calculated using Pearson’s correlation test. r1 is the correlation between the values at sites 1, 2 and 3 (vertical location). r2 is the correlation between the values at sites A, B and C (horizontal location) and r3 is the correlation between the expression value at 1A, 2B and 3C (transverse location). This was performed for every normalized gene of interest in each placenta. Finally, r1 was compared with r2, r2 was compared with r3, and r1 was compared with r3 using a Wilcoxon signed ranks test. Statistical analyses were performed with SPSS version 22 (IBM Corporation, Armonk, NY, USA) and the level of statistical significance was set at a two-sided P<0.05.
Results
Clinical characteristics
The clinical characteristics of the study subjects, divided into female and male newborns, are summarized in Table 2. The mean birth weight was approximately 200 g higher in girls than in boys, and a trend towards higher placental weight was seen in the female group of children. However, these differences did not reach statistical significance. Neither birth weight nor birth weight z-score correlated with placental weight (r=0.063, P=0.845 and r=0.093, P=0.778, respectively).
Clinical characteristics of women and their newborns divided into female and male infants.
| Female infant (n=6) | Male infant (n=6) | P-value | |
|---|---|---|---|
| Women | |||
| Maternal age, year | 32.5±1.7 | 30.0±2.2 | 0.393 |
| Early pregnancy BMI (kg/m2)a | 21.3±0.5 | 20.7±0.5 | 0.440 |
| Gestational weight gain, kg | 13.2±0.8 | 13.2±0.8 | 1.000 |
| Multiparous, % | 100 | 67 | 0.455 |
| Infants | |||
| Gestational age, week | 40.4±0.3 | 40.0±0.4 | 0.467 |
| Birth weight, g | 3,615±84 | 3,414±168 | 0.310 |
| Birth length, cm | 49.7±0.4 | 50.3±0.8 | 0.496 |
| Birth weight z-score | 0.3±0.2 | −0.3±0.3 | 0.107 |
| Birth length z-score | −0.2±0.2 | −0.2±0.4 | 0.972 |
| Placental weight, g | 596±33 | 519±16 | 0.062 |
Data are means±SEM or proportions (%). P-value was calculated by independent-samples T-test or chi-square test. Statistical significance was set at P<0.05. aEarly pregnancy weight was measured, and BMI was calculated in gestational weeks 6–10.
The gene expression of inflammatory substances and growth factors according to sample site
The expression of all genes was successfully analyzed and no Ct values exceeded 35. The coefficients of variation (CVs) were below 11% for all transcripts. High CVs were obtained for leptin expression, with a mean CV of 7%. The mean CVs for the other transcripts were 2% or below. The expression of the leptin and the IR gene were high at sites 2C and 3C and differed significantly by sampling site (for leptin: r1 vs. r2, P=0.028, and for IR: r2 vs. r3, P=0.041). The comparison between r2 and r3 almost reached statistical significance for leptin (P=0.050) (Figure 2). In one of the placentas, the leptin expression was very high at site 2C (Figure 3). However, the difference between r1 and r2 in leptin expression was still statistically significant when that outlier was excluded from the calculations (P=0.028). Furthermore, the difference between r2 and r3 in leptin expression reached statistical significance when the outlier was omitted (P=0.019).
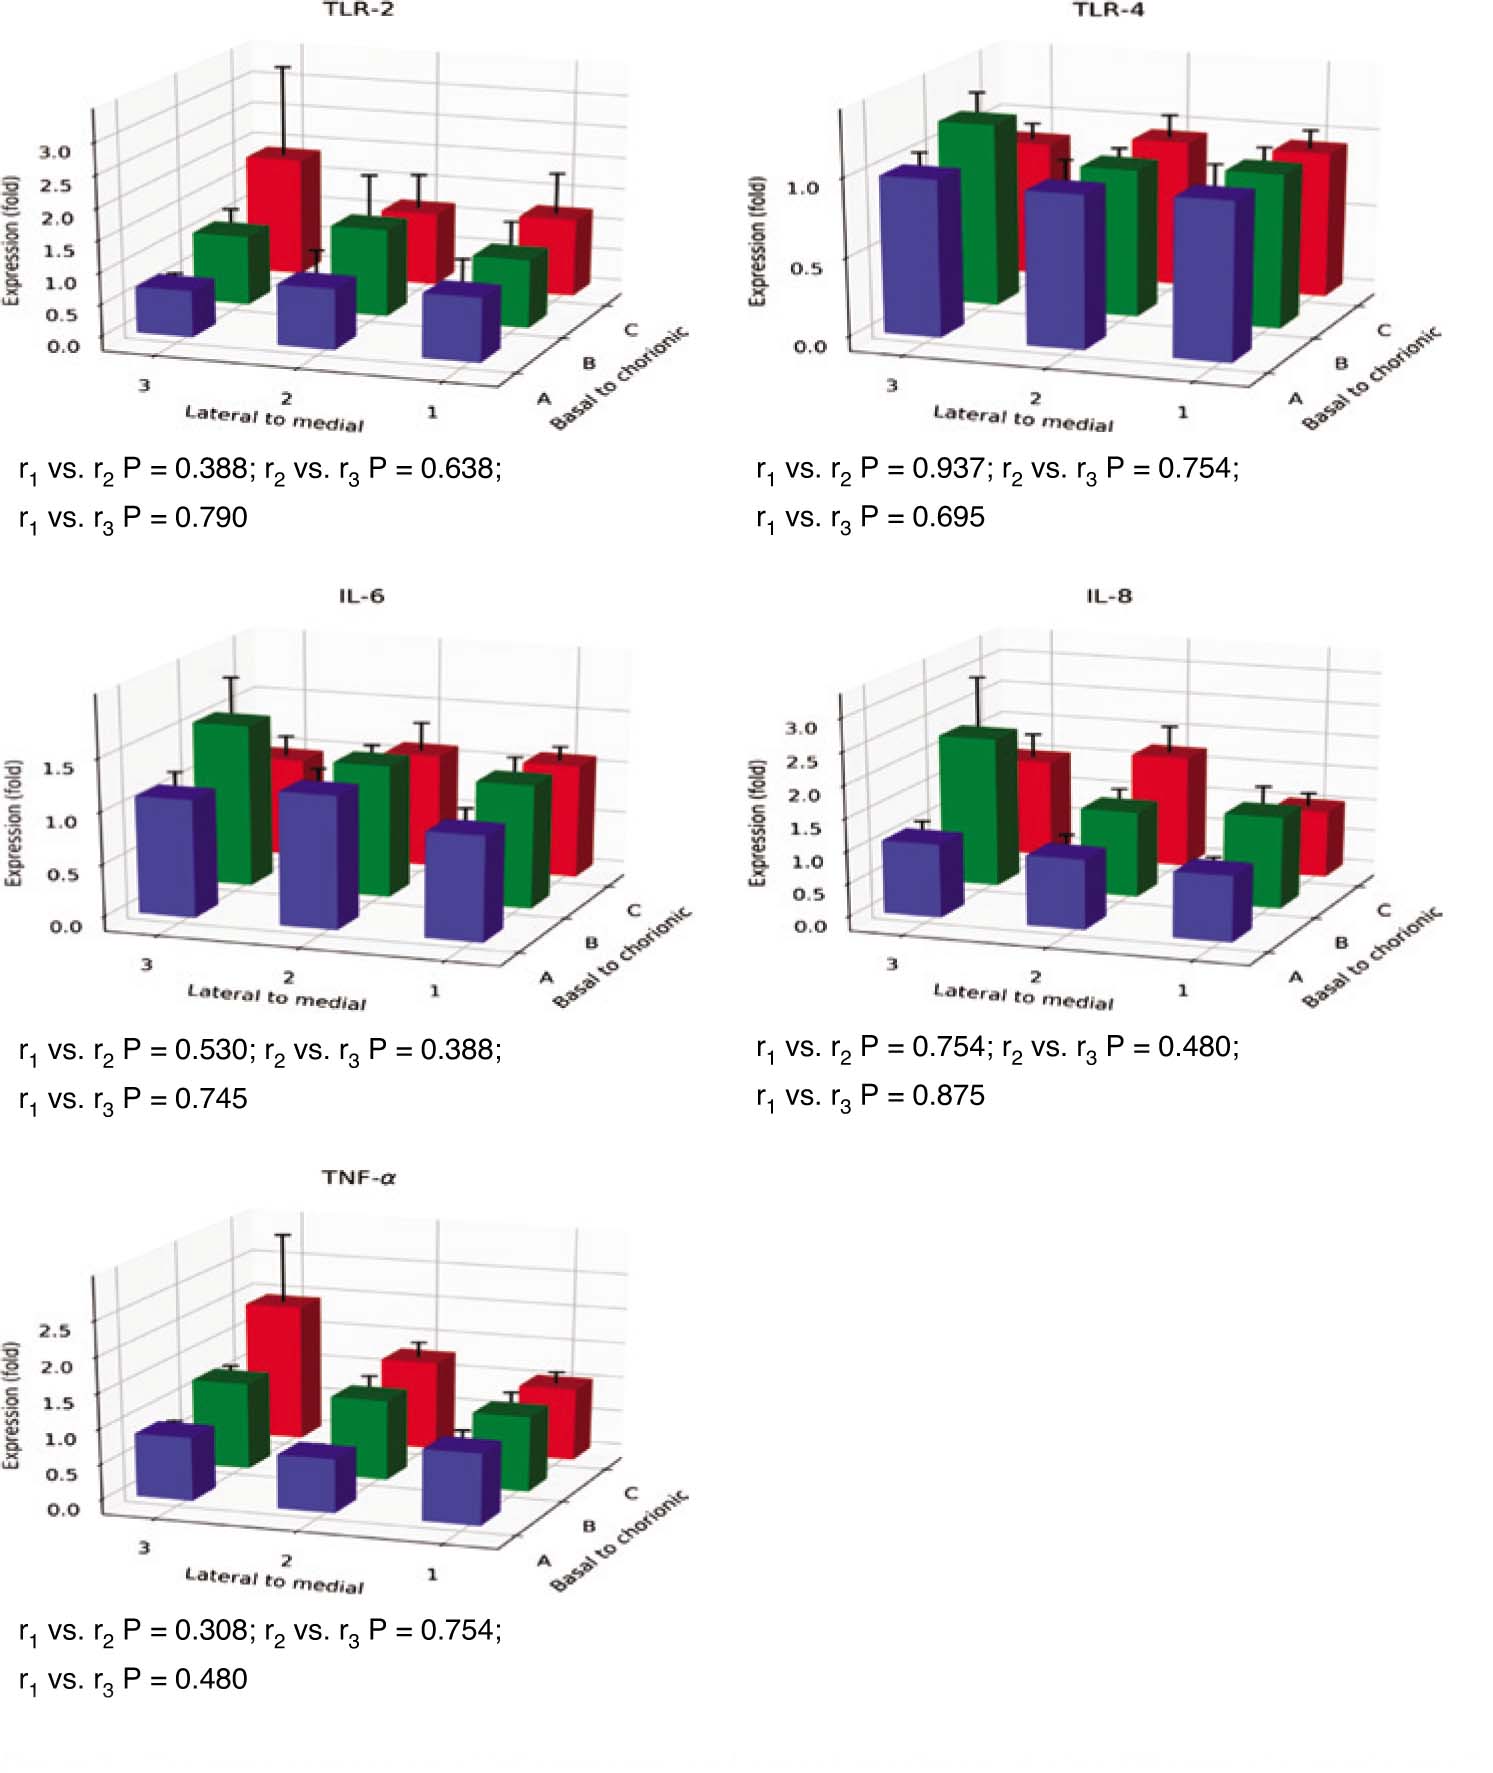
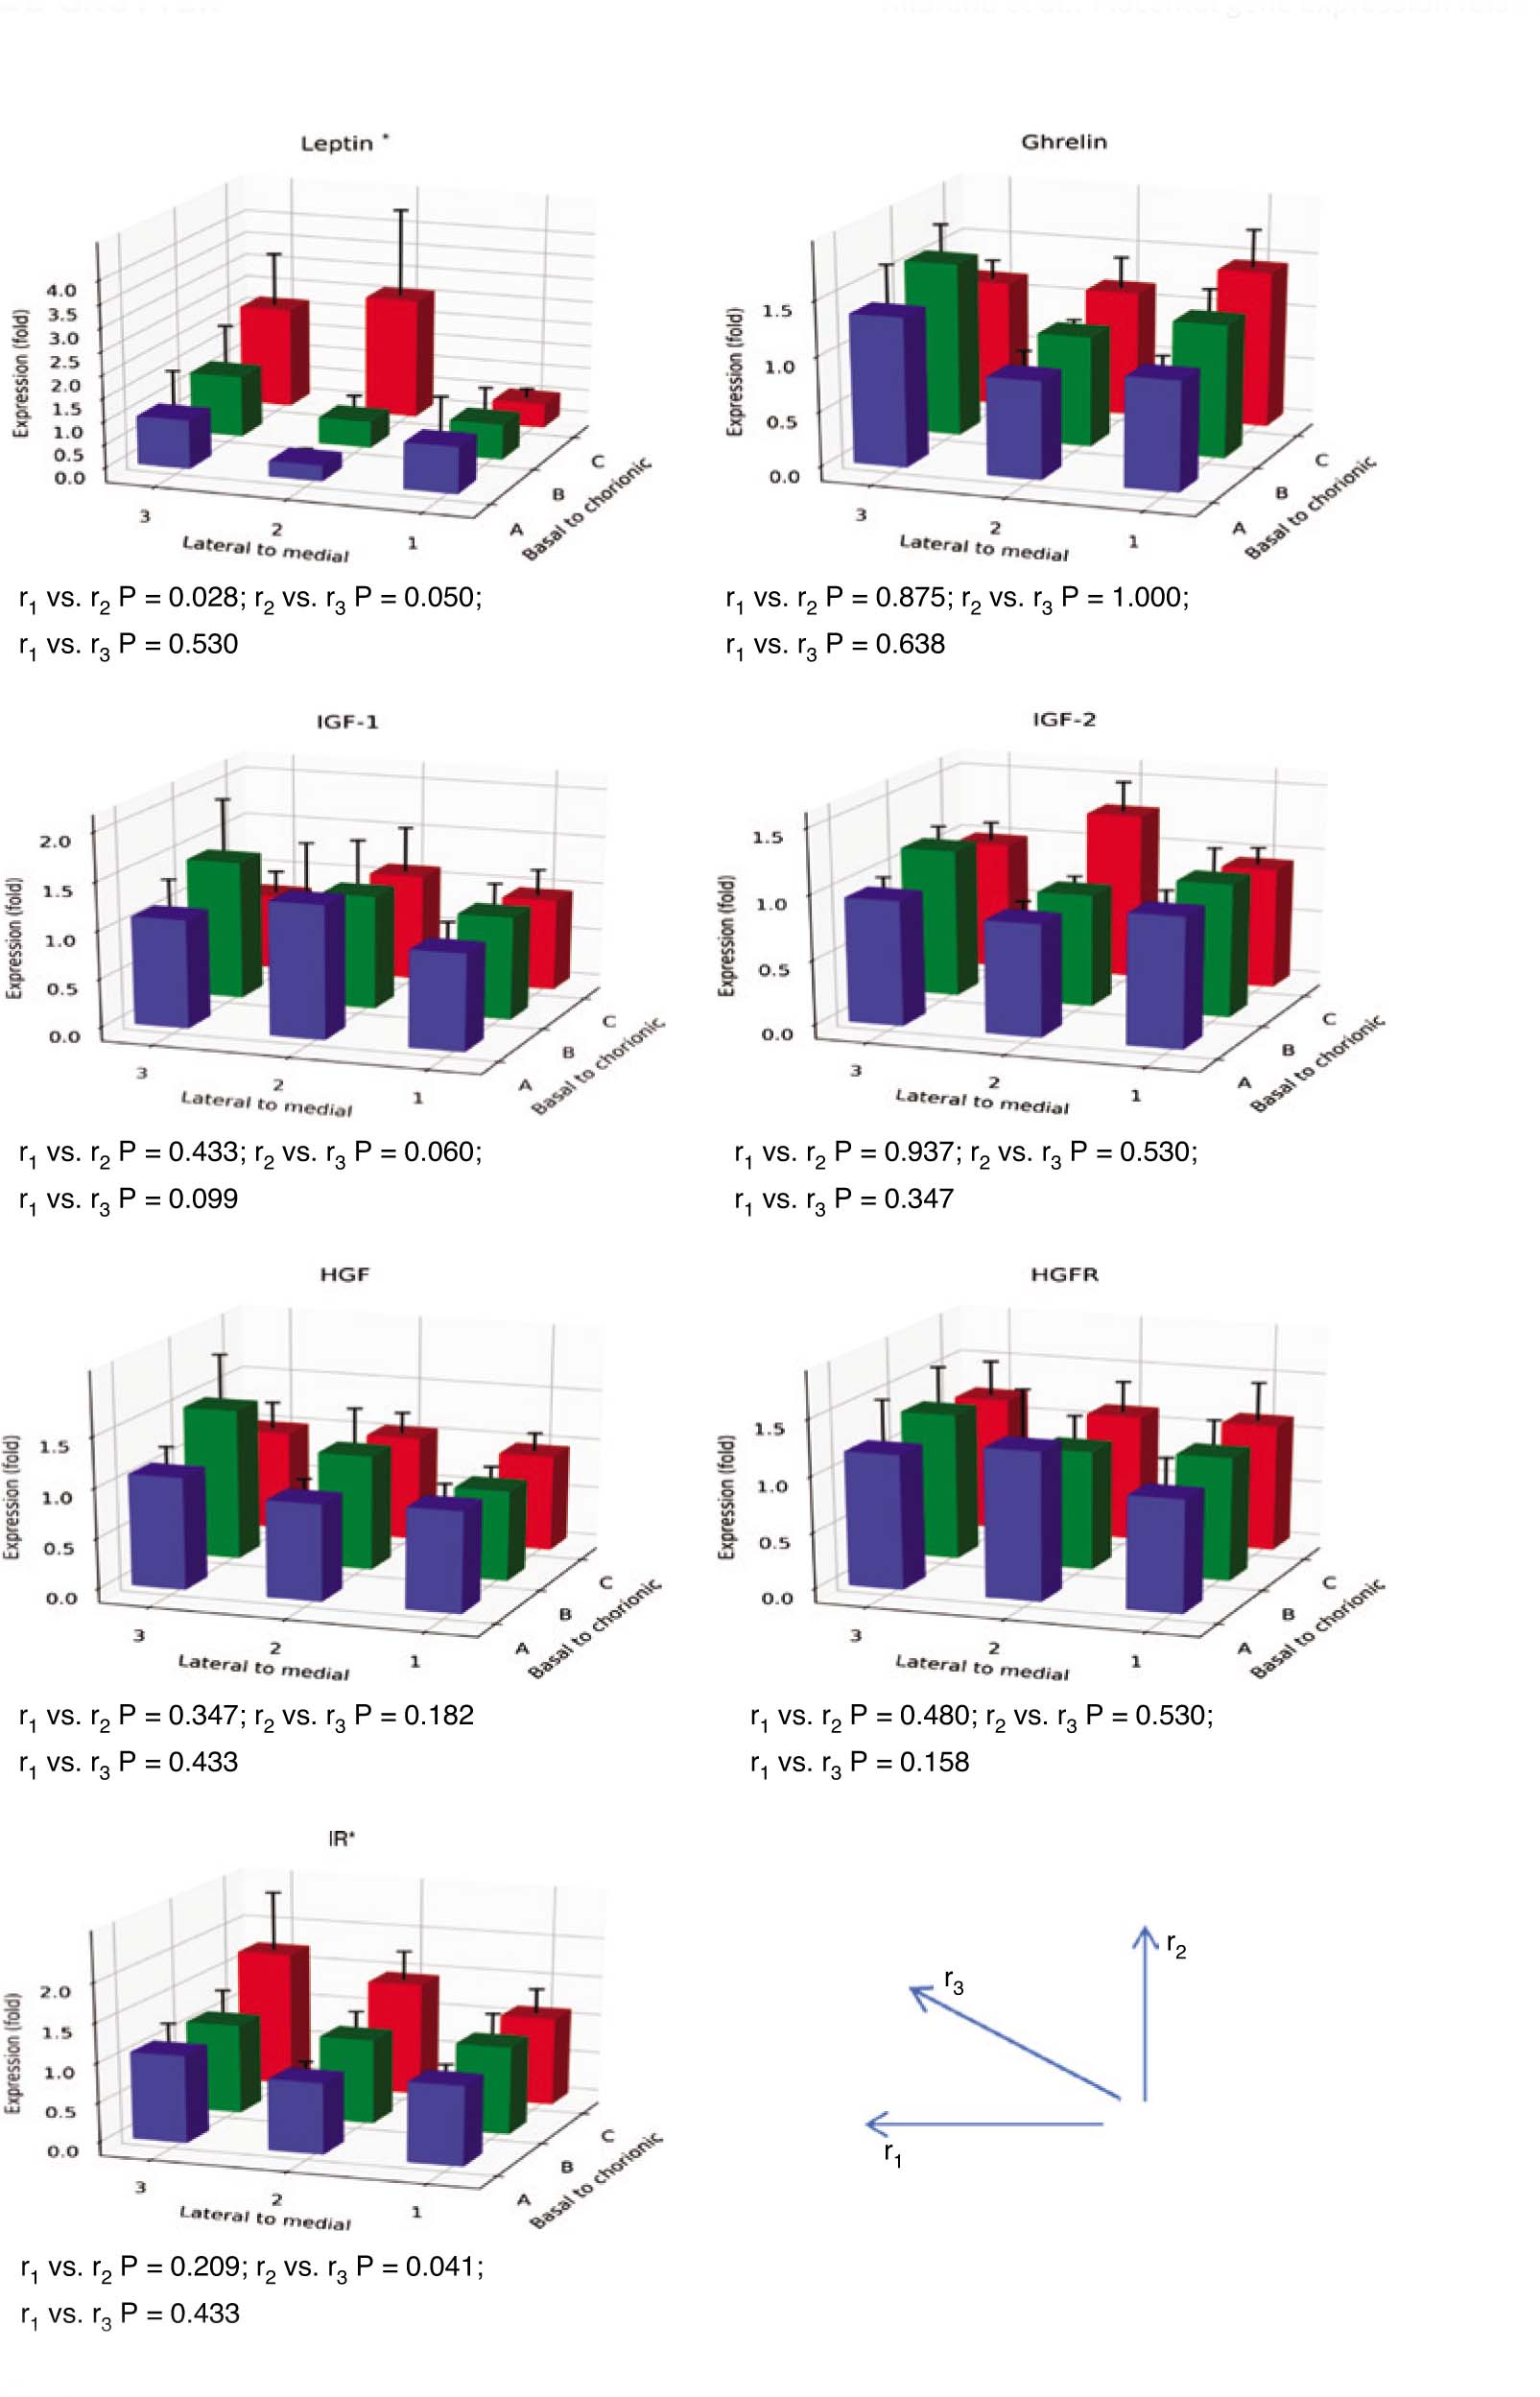
The gene expression of inflammatory and growth mediators at nine different placental sampling sites (1A–3C according to Figure 1, n=12).
The expression at each site is given as the mean fold change (±SEM) in relation to the expression at site 1A. r1, the trend of gene expression from the placental medial to lateral sites; r2, the trend of gene expression from the placental basal to chorionic sites; r3, the trend of placental transversal gene expression at the sampling sites 1A, 2B, and 3C. The comparisons between the trends (r-values) were performed with the Wilcoxon signed ranks test. *P<0.05.
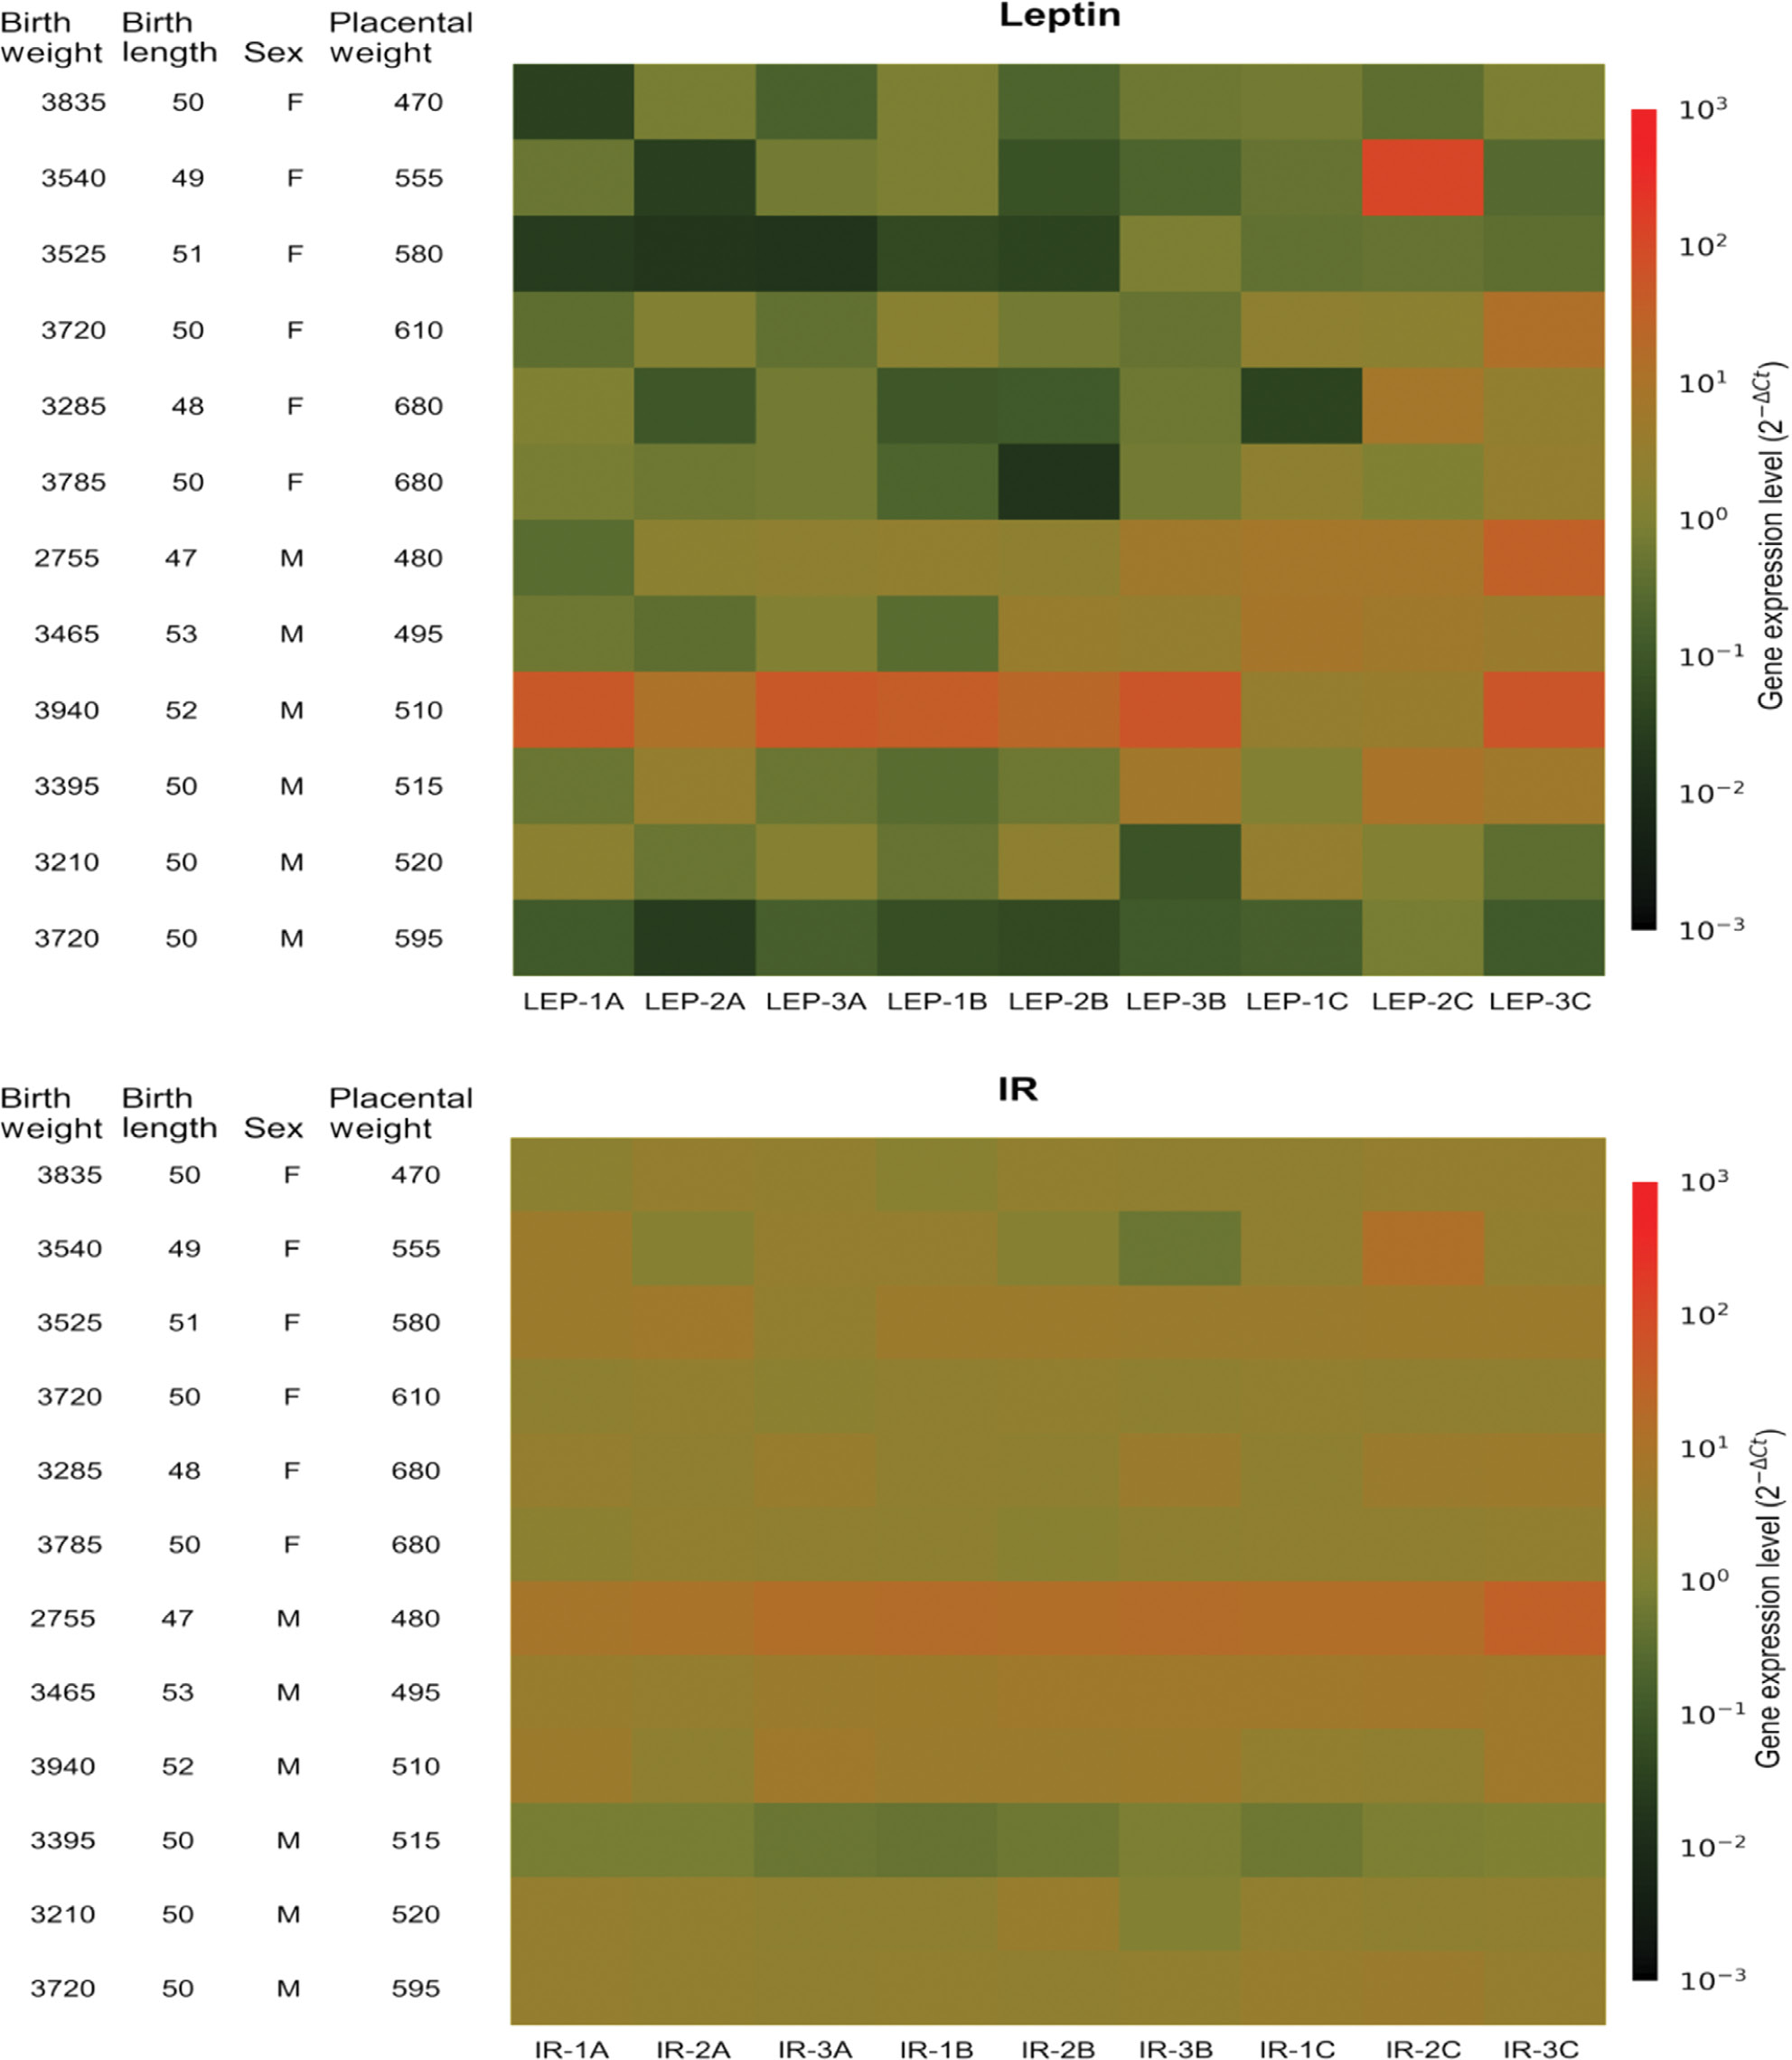
Heatmaps visualizing the expression of leptin and IR genes at nine sampling sites (1A–3C) in 12 different placentas.
Rows, different placentas. Columns, different sites. F, female, M, male. Birth weights in grams. Birth lengths in centimetres. Placental weights in grams. Colour: red, higher gene expression, green, lower gene expression. Gene expression related to the reference gene cytochrome c-1 (CYC1).
When separating data by sex, gene expression of leptin showed significant difference between r1 and r2 only in female placentas (P=0.028). When the outlier with high leptin expression at site 2C was excluded, a significant difference in leptin expression was seen also between r2 and r3 in female placentas (P=0.046), but not in male placentas. Gene expression of IR showed a trend towards different expression when comparing r2 vs. r3 in male placentas (P=0.075). No significant difference in gene expression of IR between r1, r2 or r3 was seen in female placentas.
The expression of the other genes did not differ significantly by site (Figure 2). The heat maps of the expression profiles of leptin and IR showed that in addition to differing expression by site, low or high expression generally occurred in different placentas (Figure 3).
Discussion
In this study, we compared the expression of 12 genes involved in inflammation or growth at nine different locations in placentas from uncomplicated singleton pregnancies delivered vaginally at full term. We chose to include an equal number of placentas from each sex. We found significant differences by sampling sites in the expression of two of the studied genes (leptin and IR), but not in the other genes. Both the leptin gene and the IR gene showed higher expression in the lateral regions near the chorionic plate compared to the central regions near the basal plate. The lateral-chorionic region is associated with impaired perfusion compared with the centro-basal region [11], and this may explain the increased expression of leptin and the IR found here since both leptin and IR are up-regulated by hypoxia [23], [24]. Increased IR expression by low-oxygen tension has been shown in preterm placental mesenchymal stem cells [24] indicating that the IR expression may be affected by oxygenation. IR is found mainly in endothelial cells in the placenta at full term [25]. Here, fetal insulin regulates insulin-dependent processes in the placenta, such as angiogenesis [6]. Increased insulin signaling increases the amount of nitric oxide [26], which in turn may increase the expression of the vascular endothelial growth factor (VEGF) gene [6]. VEGF is a well-known initiator of angiogenesis, and increased expression of its gene has been reported in the lateral-chorionic site of the placenta compared to the centro-basal site [11]. Thus, our finding of increased expression of the IR gene in the lateral-chorionic site of the placenta may reflect the poorer oxygenation in that part of the placenta and a means to manage it. Leptin is an important placental hormone with multiple functions regulating placental growth and development [5]. It is known to stimulate the synthesis of proteins, hormones and cytokines [27] and to inhibit apoptosis in placental cells by downregulating p53 during stress [28]. Perhaps the increased gene expression of leptin at the lateral-chorionic region found in this study is a result of impaired perfusion and reflects a regulatory attempt to reduce apoptosis in this region of the placenta. Our finding of regional differences in leptin expression agrees with an earlier report investigating children born appropriate-for-gestational age (AGA) or afflicted by IUGR [12]. That study found a difference in leptin expression between central and lateral regions in the AGA placentas [12]. However, the AGA children in that study had a wider gestational age range than the children in our study, and some of the mothers were smokers [12]. Our findings indicate that the placental expression of leptin may be dependent on the sampling site even in non-smoking women with an uncomplicated full-term pregnancy.
A limitation of this study is the small sample size. We cannot exclude that more statistically significant differences between sampling sites may have been found if we had examined more placentas. The strengths of this study are that the placentas were strictly selected to exclude as many confounding factors as possible and that all samples were taken immediately after delivery by the same person. Furthermore, we attempted to avoid too many comparisons by using only three variables representing the horizontal, vertical and transverse gene expression of the nine sampling sites. Likewise, we examined four reference genes and chose the one most appropriate according to the stability values in our samples for normalization of the expression of the genes of interest.
The differences in expression we found between sampling sites were modest. They were all below 3-fold, which is consistent with the results of Wyatt et al. [11]. Furthermore, in 10 of our 12 investigated genes, no significant differences by sampling site were found. However, for two of our studied genes, the sampling site influenced the expression. This finding should be confirmed in future studies, and their causes should be explored. Special attention should be paid to the sampling procedure in future placental research as the placenta is a heterogeneous organ. Larger sample sets may overcome differences in placental structures between different sites, but we suggest that the lateral-chorionic part of the placenta should be avoided in sampling, when examining gene expression susceptible to impaired perfusion and oxygenation.
We conclude that sampling site may influence the placental expression of the leptin and IR genes, but not the expression of the other studied genes involved in the inflammatory cascade or growth in normal full-term pregnancy.
Acknowledgments
We thank Senior Biostatistician Nils-Gunnar Pehrsson, Statistiska Konsultgruppen, Gothenburg, Sweden, for statistical advice and Elisabet Tina and Lena Jansson at the Clinical Research Laboratory at Örebro University Hospital for their long-term support. We also thank Daniel Eklund at the School of Medical Sciences, Örebro University for reviewing our analysis.
Author contributions: All the authors have accepted responsibility for the entire content of this submitted manuscript and approved submission.
Research funding: This work received grants from the Research Committee of Region Örebro County and from Nyckelfonden, Örebro University Hospital.
Employment or leadership: None declared.
Honorarium: None declared.
Competing interests: The funding organization(s) played no role in the study design; in the collection, analysis, and interpretation of data; in the writing of the report; or in the decision to submit the report for publication.
References
1. Gude NM, Roberts CT, Kalionis B, King RG. Growth and function of the normal human placenta. Thromb Res 2004;114:397–407.10.1016/j.thromres.2004.06.038Search in Google Scholar PubMed
2. Sood R, Zehnder JL, Druzin ML, Brown PO. Gene expression patterns in human placenta. Proc Natl Acad Sci USA 2006;103:5478–83.10.1073/pnas.0508035103Search in Google Scholar PubMed PubMed Central
3. Hauguel-de Mouzon S, Guerre-Millo M. The placenta cytokine network and inflammatory signals. Placenta 2006;27:794–8.10.1016/j.placenta.2005.08.009Search in Google Scholar PubMed
4. Shoelson SE, Herrero L, Naaz A. Obesity, inflammation, and insulin resistance. Gastroenterology 2007;132:2169–80.10.1053/j.gastro.2007.03.059Search in Google Scholar PubMed
5. Hauguel-de Mouzon S, Lepercq J, Catalano P. The known and unknown of leptin in pregnancy. Am J Obstet Gynecol 2006;194:1537–45.10.1016/j.ajog.2005.06.064Search in Google Scholar PubMed
6. Hiden U, Glitzner E, Hartmann M, Desoye G. Insulin and the IGF system in the human placenta of normal and diabetic pregnancies. J Anat 2009;215:60–8.10.1111/j.1469-7580.2008.01035.xSearch in Google Scholar PubMed PubMed Central
7. Somerset DA, Li XF, Afford S, Strain AJ, Ahmed A, Sangha RK, et al. Ontogeny of hepatocyte growth factor (HGF) and its receptor (c-met) in human placenta: reduced HGF expression in intrauterine growth restriction. Am J Pathol 1998;153:1139–47.10.1016/S0002-9440(10)65658-1Search in Google Scholar PubMed PubMed Central
8. Telejko B, Kuzmicki M, Zonenberg A, Modzelewska A, Niedziolko-Bagniuk K, Ponurkiewicz A, et al. Ghrelin in gestational diabetes: serum level and mRNA expression in fat and placental tissue. Exp Clin Endocrinol Diabetes 2010;118: 87–92.10.1055/s-0029-1238313Search in Google Scholar PubMed
9. Bowen JM, Chamley L, Mitchell MD, Keelan JA. Cytokines of the placenta and extra-placental membranes: biosynthesis, secretion and roles in establishment of pregnancy in women. Placenta 2002;23:239–56.10.1053/plac.2001.0781Search in Google Scholar PubMed
10. Pidoux G, Gerbaud P, Laurendeau I, Guibourdenche J, Bertin G, Vidaud M, et al. Large variability of trophoblast gene expression within and between human normal term placentae. Placenta 2004;25:469–73.10.1016/j.placenta.2003.10.016Search in Google Scholar PubMed
11. Wyatt SM, Kraus FT, Roh CR, Elchalal U, Nelson DM, Sadovsky Y. The correlation between sampling site and gene expression in the term human placenta. Placenta 2005;26:372–9.10.1016/j.placenta.2004.07.003Search in Google Scholar PubMed
12. Tzschoppe AA, Struwe E, Dorr HG, Goecke TW, Beckmann MW, Schild RL, et al. Differences in gene expression dependent on sampling site in placental tissue of fetuses with intrauterine growth restriction. Placenta 2010;31:178–85.10.1016/j.placenta.2009.12.002Search in Google Scholar PubMed
13. Surmon L, Bobek G, Makris A, Chiu CL, Lind CA, Lind JM, et al. Variability in mRNA expression of fms-like tyrosine kinase-1 variants in normal and preeclamptic placenta. BMC Res Notes 2014;7:154.10.1186/1756-0500-7-154Search in Google Scholar PubMed PubMed Central
14. Chinni E, Colaizzo D, Margaglione M, Rubini C, D’Ambrosio RL, Giuliani F, et al. Correlation between factors involved in the local haemostasis and angiogenesis in full term human placenta. Thromb Res 2008;122:376–82.10.1016/j.thromres.2007.12.016Search in Google Scholar PubMed
15. Burton GJ, Sebire NJ, Myatt L, Tannetta D, Wang YL, Sadovsky Y, et al. Optimising sample collection for placental research. Placenta 2014;35:9–22.10.1016/j.placenta.2013.11.005Search in Google Scholar PubMed
16. Rasmussen KM, Catalano PM, Yaktine AL. New guidelines for weight gain during pregnancy: what obstetrician/gynecologists should know. Curr Opin Obstet Gynecol 2009;21:521–6.10.1097/GCO.0b013e328332d24eSearch in Google Scholar PubMed PubMed Central
17. Bowen JM, Chamley L, Keelan JA, Mitchell MD. Cytokines of the placenta and extra-placental membranes: roles and regulation during human pregnancy and parturition. Placenta 2002;23:257–73.10.1053/plac.2001.0782Search in Google Scholar PubMed
18. Niklasson A, Albertsson-Wikland K. Continuous growth reference from 24th week of gestation to 24 months by gender. BMC Pediatr 2008;8:8.10.1186/1471-2431-8-8Search in Google Scholar PubMed PubMed Central
19. Allbrand M, Bjorkqvist M, Nilsson K, Ostlund I, Aman J. Placental gene expression of inflammatory markers and growth factors – a case control study of obese and normal weight women. J Perinat Med 2015;43:159–64.10.1515/jpm-2013-0343Search in Google Scholar PubMed
20. Andersen CL, Jensen JL, Orntoft TF. Normalization of real-time quantitative reverse transcription-PCR data: a model-based variance estimation approach to identify genes suited for normalization, applied to bladder and colon cancer data sets. Cancer Res 2004;64:5245–50.10.1158/0008-5472.CAN-04-0496Search in Google Scholar PubMed
21. Drewlo S, Levytska K, Kingdom J. Revisiting the housekeeping genes of human placental development and insufficiency syndromes. Placenta 2012;33:952–4.10.1016/j.placenta.2012.09.007Search in Google Scholar PubMed
22. Livak KJ, Schmittgen TD. Analysis of relative gene expression data using real-time quantitative PCR and the 2(-Delta Delta C(T)) method. Methods 2001;25:402–8.10.1006/meth.2001.1262Search in Google Scholar PubMed
23. Grosfeld A, Turban S, Andre J, Cauzac M, Challier JC, Hauguel-de Mouzon S, et al. Transcriptional effect of hypoxia on placental leptin. FEBS Lett 2001;502:122–6.10.1016/S0014-5793(01)02673-4Search in Google Scholar PubMed
24. Youssef A, Han VK. Low oxygen tension modulates the insulin-like growth factor-1 or -2 signaling via both insulin-like growth factor-1 receptor and insulin receptor to maintain stem cell identity in placental mesenchymal stem cells. Endocrinology 2016;157:1163–74.10.1210/en.2015-1297Search in Google Scholar PubMed
25. Desoye G, Hartmann M, Blaschitz A, Dohr G, Hahn T, Kohnen G, et al. Insulin receptors in syncytiotrophoblast and fetal endothelium of human placenta. Immunohistochemical evidence for developmental changes in distribution pattern. Histochemistry 1994;101:277–85.10.1007/BF00315915Search in Google Scholar PubMed
26. Lassance L, Miedl H, Absenger M, Diaz-Perez F, Lang U, Desoye G, et al. Hyperinsulinemia stimulates angiogenesis of human fetoplacental endothelial cells: a possible role of insulin in placental hypervascularization in diabetes mellitus. J Clin Endocrinol Metab 2013;98:E1438–47.10.1210/jc.2013-1210Search in Google Scholar PubMed
27. Gambino YP, Maymo JL, Perez Perez A, Calvo JC, Sanchez-Margalet V, Varone CL. Elsevier Trophoblast Research Award lecture: molecular mechanisms underlying estrogen functions in trophoblastic cells – focus on leptin expression. Placenta 2012;33 (Suppl):S63–70.10.1016/j.placenta.2011.12.001Search in Google Scholar PubMed
28. Toro AR, Maymo JL, Ibarbalz FM, Perez-Perez A, Maskin B, Faletti AG, et al. Leptin is an anti-apoptotic effector in placental cells involving p53 downregulation. PLoS One 2014;9:e99187.10.1371/journal.pone.0099187Search in Google Scholar PubMed PubMed Central
©2019 Marianne Allbrand et al., published by De Gruyter, Berlin/Boston
This work is licensed under the Creative Commons Attribution-NonCommercial-NoDerivatives 4.0 License.
Articles in the same Issue
- Frontmatter
- Editorial
- Preterm premature rupture of membranes (PPROM)
- Original Articles – Obstetrics
- The value of amniotic fluid analysis in patients with suspected clinical chorioamnionitis
- Patients with acute cervical insufficiency without intra-amniotic infection/inflammation treated with cerclage have a good prognosis
- Maternal serum endocan concentrations are elevated in patients with preterm premature rupture of membranes
- The earlier the gestational age, the greater the intensity of the intra-amniotic inflammatory response in women with preterm premature rupture of membranes and amniotic fluid infection by Ureaplasma species
- Assessment of maternal GBS colonization and early-onset neonatal disease rate for term deliveries: a decade perspective
- Clinical importance of the 75-g glucose tolerance test (GTT) in the prediction of large for gestational age (LGA) fetuses in non-diabetic pregnancies
- Expression of genes involved in inflammation and growth – does sampling site in human full-term placenta matter?
- Impact of cell-free fetal DNA on invasive prenatal diagnostic tests in a real-world public setting
- Perinatal outcome in gestational diabetes according to different diagnostic criteria
- Original Articles – Fetus
- Change in fetal behavior in response to vibroacoustic stimulation
- Diagnostic accuracy of isolated clubfoot in twin compared to singleton gestations
- Original Article – Newborn
- Usefulness of transcutaneous bilirubin assessment measured in non-photo-exposed skin to guide the length of phototherapy: an observational study
- Letters to the Editor
- Methodological issues on the clinical importance of the 75-g glucose tolerance test (GTT) in the prediction of large for gestational age (LGA) fetuses in non-diabetic pregnancies
- Reply to the Letter to the Editor: methodological issues on the clinical importance of the 75-g glucose tolerance test (GTT) in the prediction of large-for-gestational-age (LGA) fetuses in non-diabetic pregnancies