A retrospective analysis of longitudinal changes in bone mineral content in cystic fibrosis
-
Adela Chirita-Emandi


Abstract
Background:
We aimed to describe the longitudinal changes in bone mineral content and influencing factors, in children with cystic fibrosis (CF).
Methods:
One hundred children (50 females) had dual X-ray absorptiometry (DXA) performed. Of these, 48 and 24 children had two to three scans, respectively over 10 years of follow-up. DXA data were expressed as lumbar spine bone mineral content standard deviation score (LSBMCSDS) adjusted for age, gender, ethnicity and bone area. Markers of disease, anthropometry and bone biochemistry were collected retrospectively.
Results:
Baseline LSBMCSDS was >0.5 SDS in 13% children, between −0.5; 0.5 SDS, in 50% and ≤−0.5 in the remainder. Seventy-eight percent of the children who had baseline LSBMCSDS >−0.5, and 35% of the children with poor baseline (LSBMCSDS<−0.5), showed decreasing values in subsequent assessments. However, mean LS BMC SDS did not show a significant decline in subsequent assessments (−0.51; −0.64; −0.56; p=0.178). Lower forced expiratory volume in 1 s percent (FEV1%) low body mass index standard deviation scores (BMI SDS) and vitamin D were associated with reduction in BMC.
Conclusions:
Bone mineral content as assessed by DXA is sub-optimal and decreases with time in most children with CF and this study has highlighted parameters that can be addressed to improve bone health.
Introduction
Cystic fibrosis (CF) is an autosomal recessive disorder caused by defects in the cystic fibrosis transmembrane conductance regulator protein (CFTR) occurring at a frequency of 1 in 3200 live births [1]. In addition to expression of CFTR in a variety of epithelial cells, its expression has been found in osteoblasts but its precise role in these cells remains to be elucidated [2]. People with CF, especially those with advanced disease, are exposed to a number of factors, including chronic inflammation, inadequate nutrition, vitamin D deficiency, reduced physical activity, hypogonadism and glucocorticoid exposure that will increase their risk of adverse bone health [3]. Approximately, a quarter of young adults with CF may have osteoporosis and the prevalence of radiologically-confirmed fractures may be about 20% [4], [5], [6]. However, children with CF do not seem to have an increased risk of fractures and cross-sectional studies suggest that deficit in bone mineral content only seems to become prevalent in young adulthood [7]. With continuing improvements in therapy, increasing numbers of children are now surviving into adulthood and the ongoing concerns about bone health have led to recommendations advocating close monitoring of bone health in older children by dual-energy X-ray absorptiometry (DXA) coupled with close monitoring and replacement of vitamin D [8], [9]. However, the evidence base for such practice is lacking and a recent Cochrane review has highlighted the need for more research [10]. The aim of this study was to perform a retrospective review of the bone health monitoring program at one CF centre, assess the extent of abnormality of bone health and then examine the presence of any factors that determine longitudinal changes in bone mineral content as assessed by DXA.
What’s known on this subject
Older children and adolescents with cystic fibrosis may have poorer bone mineral content than younger patients.
What this study adds
Bone mineral content decreases with time in children with CF
The reduction is associated to low FEV1% and low body mass index standard deviation scores (BMI SDS)
Low vitamin D may also play an important role when associated with a high parathyroid hormone (PTH)
Patients and methods
Description of subjects
In a retrospective analysis of 289 children with CF, receiving either full care or shared care at the Royal Hospital for Sick Children Glasgow (RHSC) and one of its affiliated hospitals, we selected children that had at least one DXA scan performed over a period of 10 years (January 2003–June 2013). Children were included if they had the diagnosis of CF by molecular diagnosis, were aged between 8 and 18 years and had at least one DXA assessment performed in the RHSC. Children were excluded if clinical data were not available. Supplemental feeding was defined as the child receiving enteral feeding at a minimum frequency of once a week in the month prior to the scan. Oral/inhaled corticosteroid was defined as corticosteroid treatment during the year previous to the scan. Forced expiratory volume in 1 s percent (FEV1%) was used as a marker of pulmonary function and was assessed using a spirometer (Jaeger Masterscreen Body, CareFusion, San Diego, CA, USA). Impaired glucose tolerance was defined, according to the American Diabetes Association guidelines, as a fasting plasma glucose level of less than 7 mmol/L and a 2-h plasma glucose level of 7.8 to 11 mmol/L. Diabetes was diagnosed when a fasting glucose level was 7 mmol/L or higher or a 2-h plasma glucose level of more than 11 mmol/L [11].
Auxology
Anthropometric data were collected from the clinical records and height and BMI were expressed as SDS using the UK growth reference [12]. Given the lack of availability of puberty data, age at peak height velocity (PHV) was used as a marker of pubertal progress [13]. The mean age increment was 1.2 years (range 0.42, 1.86) and the height gain (cm) was divided by this age increment for each year of age from 9 to 16 years, to obtain height gain per month and estimate the annualised height velocity.
Segregation status
The segregation status of children was assessed by categorisation into three classes: chronically colonised with Pseudomonas aeruginosa (PSA) or Burkholderia cepacia (CA) intermittently colonised with PSA and PSA naïve. Chronic colonisation with PSA or BC was defined as PSA or BC in sputum in the past 6 months, with three or more isolates in the past 12 months post-eradication. Intermittent colonisation with PSA was defined as no PSA in current sputum cultures and clear of PSA for more than 6 months, but intermittent isolates in past; or currently has PSA in sputum or in the past 6 months but cannot yet be classed as chronically colonised.
Bone biochemistry
Biochemical data at the time of the DXA scan were collected from local records. PTH was analysed by chemiluminescent microparticle immunoassay (CMIA) on an Abbott Architect ci8000 (ABBOTT, Wiesbaden, Germany). Serum PTH levels≥7.5 pmol/L (70 pg/mL) were considered to be significantly elevated. Vitamin D (25-hydroxyvitamin D2 and 25-hydroxyvitamin D3) status was measured by liquid chromatography tandem mass spectrometry (LC-MS/MS) using commercial standard in human serum (Chromsystems, München, Germany). Using the British Paediatric and Adolescent Bone Group’s position statement, vitamin D deficiency was defined when serum vitamin D (25OHD) levels were<25 nmol/L, insufficiency when levels were 25–50 nmol/L and sufficiency at a concentration greater than 50 nmol/L [14].
DXA
DXA of the lumbar spine (LS, L2–L4) and total body (TB) using Lunar Prodigy (GE Medical Systems, Waukesha, WI, USA) was performed as part of routine clinical practice. As outlined in previous studies [15], [16], using the manufacturer’s software, absorptiometry was related to bone mineral content (BMC) expressed in grams of ashed calcium hydroxyapatite equivalents and to grams per centimetre squared of BMD corresponding to BMC divided by the bone area scanned. Lunar software calculated an ethnicity; age- and gender-matched BMD SDS using a reference population of more than 2,000 American children between the ages of 5 and 19 years evaluated by Lunar Prodigy. The reference data are comparable to recently published data on Dutch children by van der Sluis et al. [17]. They provide age- and gender-matched BMC and bone area values for each age and gender band between 5 and 19 years. By linear interpolation, these data allowed calculation of a predicted and a percentage predicted bone area for age and gender (pp bone area). A child with short stature should have small bones and would have a low pp bone area. The reference data also allows a comparison of the actual BMC of the patient with the predicted BMC for a subject of the patient’s gender and bone area. This allows the calculation of a BMC SDS. A child with osteopenia should have thin bones, irrespective of whether the bones are small or large, and would have a low BMC SDS.
Ethics
As the study simply analysed data that was routinely collected as part of the clinical care of the patient, the study did not require informed consent and was approved as an evaluation of health care delivery.
Statistical analysis
Descriptive statistics are outlined for all variables assessed. Means and standard deviations (SDs) were calculated for all normally distributed continuous measures. Data were analysed with SPSS 20 (SPSS Inc, Chicago, IL, USA). Baseline (T0) was assigned at the time of the first DXA assessment for each child while T1 and T2 were noted as the time when each child had a second and third DXA assessment. The Student’s t-test and repeated-way ANOVA for three samples were used for comparing variance. Hierarchical regression models (backward method) were used to assess the factors that influence baseline LS BMC SDS and also the factors that influence change in bone mass. The difference between two DXA assessments was calculated as ∆ LS BMC SDS=T1−T0 and T2−T1. Further, as the time between DXA assessments was variable, this difference was annualised by dividing it with the time between assessments in decimal years. This annualised ∆ LS BMC SDS was used as the dependent variable in hierarchical regression model (backward method) to assess longitudinal change in BMC. The predictors of change in BMC were considered in variables measured at baseline, T1, T2 and were calculated as differences, (i.e. ∆ FEV1%=T1 FEV1%−T0 FEV1%), for all variables.
Results
Out of the total 289 children with CF in follow-up at RHSC, 103 children had at least one DXA scan performed and were included in the study. One child with congenital pseudohypoaldosteronism was excluded. Clinical data were not available for two children. Of the remaining 100 children (50 females), 48 had two DXA scans, 24 children had three DXA scans during the 10-year period. Mean age at the time of first DXA scan was 12 years (SD=1.89).
Anthropometry
Descriptive clinical data for the children with CF at baseline are presented, in Table 1, for all children and separately the group that had a single DXA assessment (n=52) versus those who had repeated DXA assessments (n=48). On an average, DXA assessments were performed 1.8 years apart (SD=0.7). Significant differences were found between boys and girls at baseline in mean age at PHV, mean PHV and mean height SDS as seen in the general population.
Comparative descriptive features of children at baseline: those who had a single DXA assessment and those who had repeated (2 or 3) DXA assessments.
| All | Single assessment | 2 DXA assessments | p-Value | |||||||
|---|---|---|---|---|---|---|---|---|---|---|
| n | Mean | SD | n | Mean | SD | n | Mean | SD | ||
| Decimal age, years | 100 | 12.04 | 1.89 | 52 | 12.90 | 2.02 | 48 | 11.11 | 1.21 | 0.000 |
| Age at PHV, years | 85 | 12.24 | 1.39 | 41 | 12.22 | 1.39 | 44 | 12.25 | 1.42 | 0.920 |
| Growth in cm at PHV | 85 | 7.68 | 2.01 | 47 | 7.41 | 2.23 | 48 | 7.96 | 1.75 | 0.191 |
| Height SDS | 96 | −0.23 | 1.05 | 52 | −0.54 | 1.01 | 48 | 0.09 | 1.02 | 0.003 |
| BMI SDS | 96 | −0.13 | 1.12 | 48 | −0.27 | 1.09 | 48 | 0.01 | 1.16 | 0.231 |
| Vitamin D, nmol/L | 94 | 45.38 | 24.98 | 48 | 42.23 | 22.99 | 46 | 48.70 | 26.78 | 0.213 |
| PTH, pmol/L | 84 | 4.98 | 3.24 | 41 | 5.67 | 3.61 | 43 | 4.33 | 2.74 | 0.060 |
| FEV1% | 98 | 82.47 | 19.36 | 50 | 79.30 | 19.83 | 48 | 85.77 | 18.50 | 0.098 |
| LS BMC SDS | 100 | −0.24 | 0.61 | 52 | −0.15 | 0.53 | 48 | −0.34 | 0.68 | 0.115 |
| TB BMC SDS | 100 | 0.13 | 0.43 | 52 | 0.16 | 0.39 | 48 | 0.11 | 0.47 | 0.554 |
| Oral corticosteroids | 100 | 4 (4%) | 52 | 3 (6%) | 48 | 1 (2%) | ||||
| Inhaled corticosteroids | 100 | 45 (45%) | 52 | 25 (48.1%) | 48 | 20 (42%) | ||||
| Impaired glucose tolerance | 100 | 25 (25%) | 52 | 14 (26.9%) | 48 | 11 (23%) | ||||
| Supplemental feeding | 100 | 10 (10%) | 52 | 8 (15%) | 48 | 2 (4%) | ||||
| Segregation status: | 88 | 17/51/20 | 44 | 5/27/12 | 44 | 12/24/8 | ||||
| Chronically colonised PSA or BC/Intermittently colonised PSA/PSA naive | (19/58/23%) | (11/62/27%) | (27/55/18%) | |||||||
| Gender, males/females | 100 | 50%/50% | 52 | 40%/60% | 48 | 60%/40% | ||||
n, number of children; PHV, peak height velocity; SDS, standard deviation score; PTH, parathyroid hormone; BMC SDS, bone mineral content standard deviation score; LS, lumbar spine; TB, total body; FEV1%, forced expiratory volume in 1 s percent; PSA, Pseudomonas aeruginosa; BC, Burkholderia cepacia; intermittently colonised with PSA, patients had P. aeruginosa in sputum in the past or in the year of DXA, but not chronically colonised; PSA naive, patients never had Pseudomonas. All continuous variables are expressed as mean and standard deviations, categorical variables are expressed as number of positive cases and (percentages). p-Value is calculated with independent sample t-test.
Vitamin D, PTH status
Of the 94/100 children where a vitamin D level was available at baseline, 24% were deficient, and 39% were insufficient (Figure 1). Of the 84/100 children where a PTH level was available, 14% children had a value above 7.5 pmol/L (70 pg/mL). Vitamin D and PTH values were available simultaneously for 81/100 children. Of them, 49% had low vitamin D (insufficient and deficient) but normal PTH, while 12% had low vitamin D and high PTH.
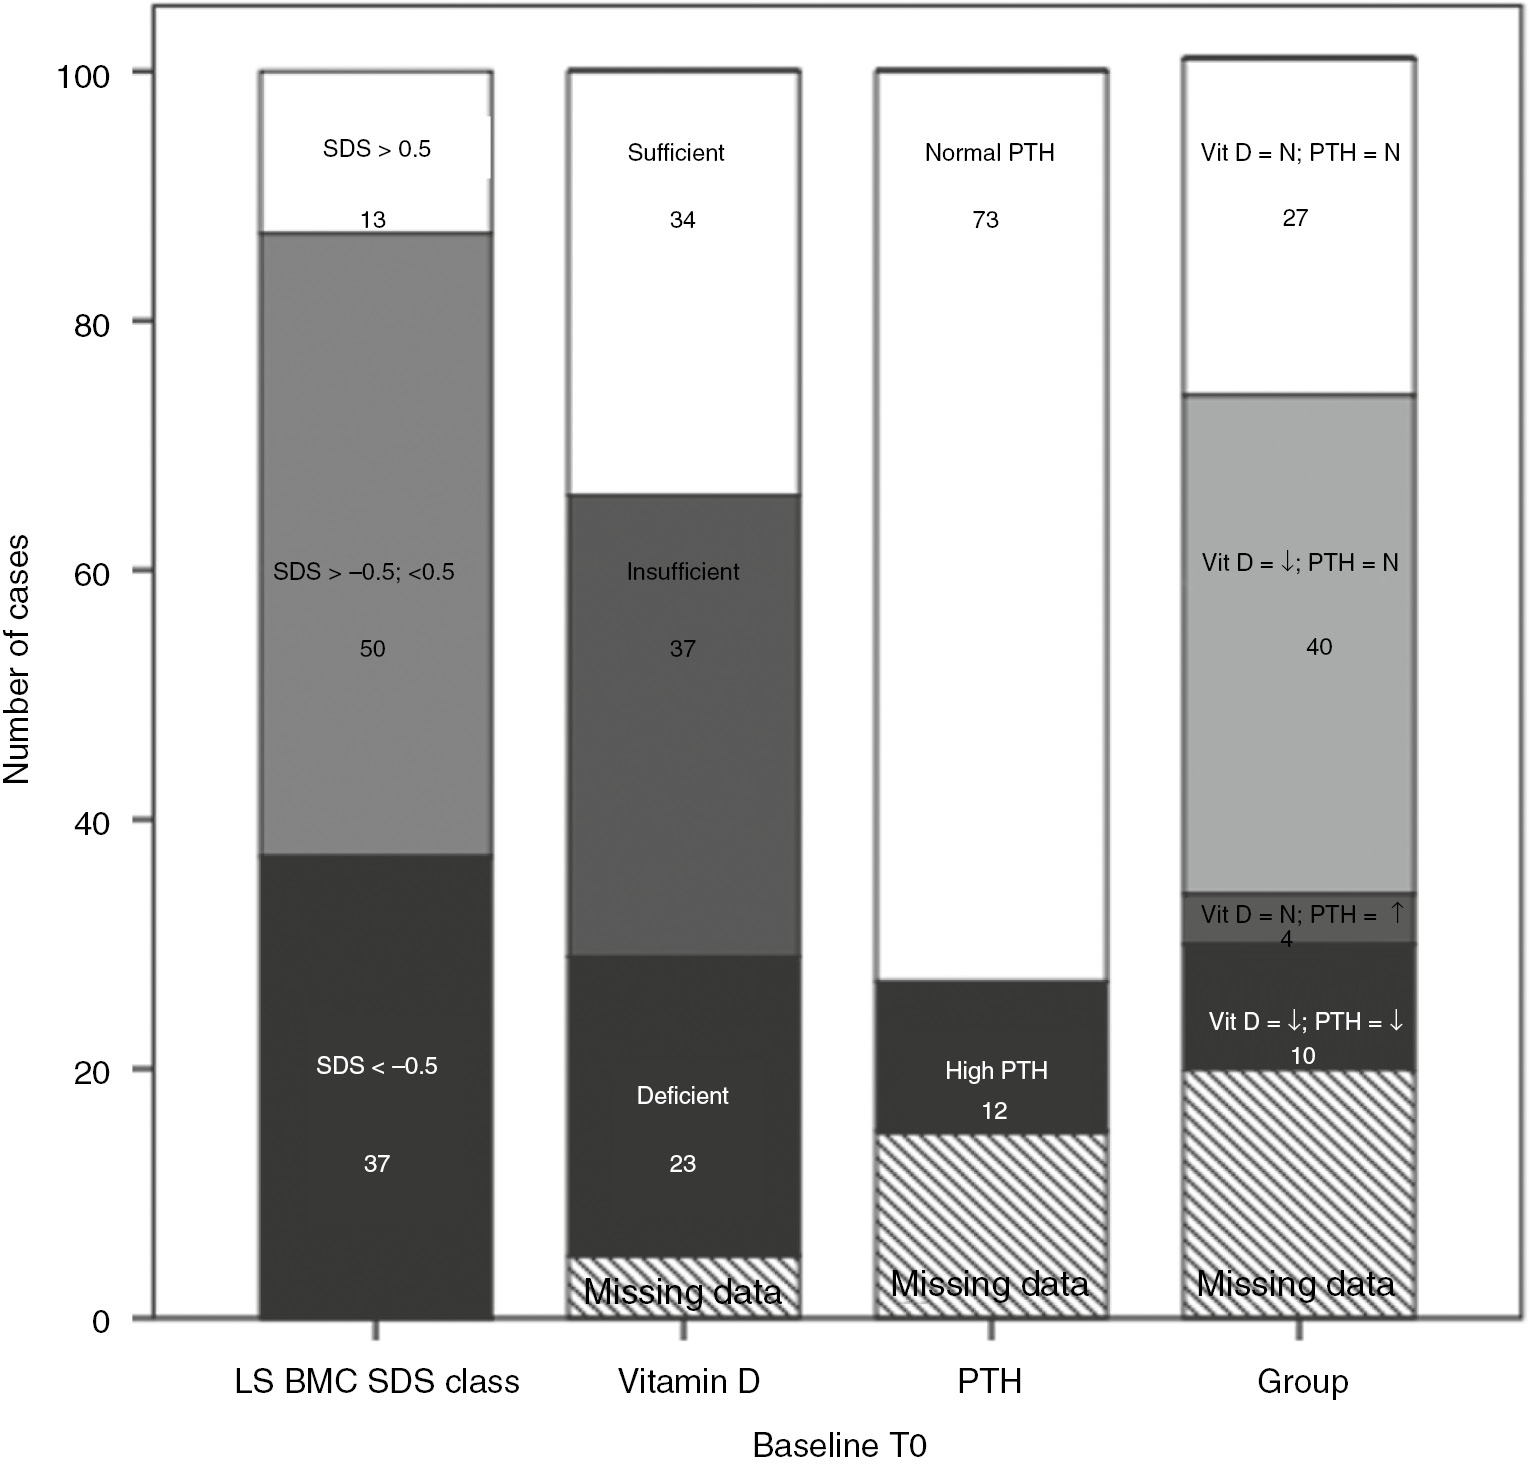
Baseline bone mass, vitamin D and PTH status.
LS BMC SDS, lumbar spine bone mineral content standard deviation score; vitamin D deficiency <25 nmol/L, insufficiency 25–50 nmol/L, normal ≥50 nmol/L. High PTH levels if≥7.5 pmol/L, normal PTH if <7.5 pmol/L. Vit D, N normal vitamin D; Vit D, ↓ if vitamin D deficient and insufficient; PTH, N if <7.5 pmol/L; PTH, ↑ if ≥7.5 pmol/L. The number in figures show number of patients out of the total of 100 for each column, in a specific category.
On longitudinal analysis, 27% of the children were vitamin D deficient on one occasion, 17% on two occasions and none on all three occasions (Figure 2A, B, C). Thirty-four percent of the children were vitamin D insufficient on one occasion, 27% on two occasions and 5% on three occasions.
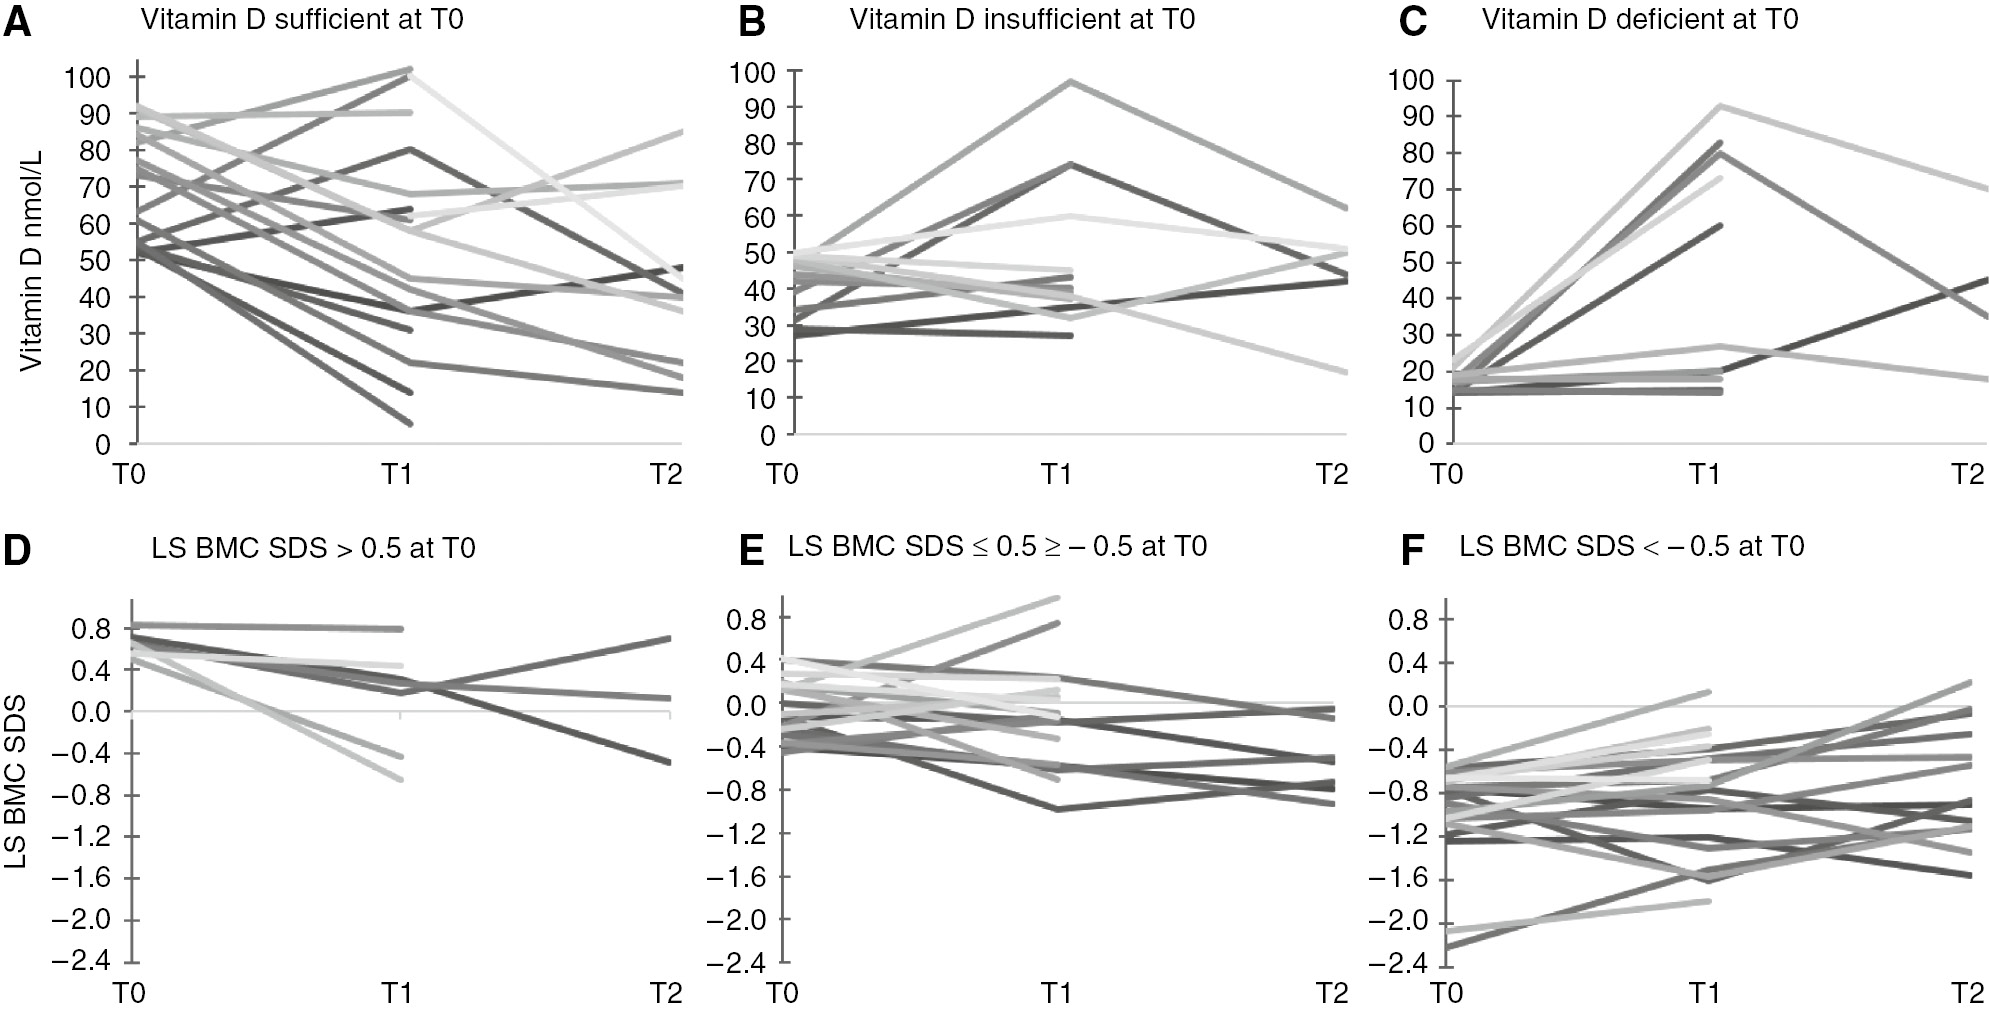
The dynamics of vitamin D and LS BMC SDS at T0, T1 and T2.
(A–C) The dynamics of vitamin D at T0, T1 and T2 separated in (A), (B) and (C), in regards to baseline vitamin D status. T0, baseline, first DXA assessment; T1, second DXA assessment; T2, third DXA assessment; vitamin D deficiency defined when vitamin D levels were<50nmol/L (20ng/mL), insufficiency if the vitamin D levels were between 52.5 and 72.5nmol/L (21–29ng/mL), and normal if vitamin D level ≥75nmol/L (30ng/mL). (D–F) The dynamics of LS BMC SDS at T0, T1 and T2 separated in (D), (E) and (F), in regards to baseline status in LS BMC SDS, lumbar spine bone mineral content standard deviation score. Three classes of LS BMC SDS: >0.5; between −0.5 and 0.5, and ≤−0.5.
Bone mineral content
In the 100 children, baseline LS BMC SDS was more than 0.5 in 13% of the children; 50% had LS BMC SDS between −0.5 and 0.5, while 37% had SDS ≤−0.5 (Figure 1). Ten children (10%) had LS BMC SDS below −1 at baseline. In longitudinal analysis (across 3 DXA assessments) the mean LS BMC SDS varied from T0 to T1 and T2 (−0.51; −0.64; −0.56; p=0.178 repeated way ANOVA). In the 37 children who had a baseline LS BMC SDS >−0.5, 29 (78%) assessments showed a fall in BMC SDS compared to previous assessment. Conversely, in the 35 children who had a poor baseline LS BMC SDS<−0.5, 12 (35%) assessments showed a decline in BMC SDS compared to previous assessment (Figure 2D, E, F).
Determinants of initial bone mineral content
Significant determinants of basal LS BMC SDS were identified using hierarchical multiple regression (backward method). The significant determinants of initial LS BMC SDS were height SDS and supplemental feeding (coded 0 and 1 – for presence of supplemental feeding). All determinants correlated inversely with LS BMC SDS (Table 2). Variables that did not reach statistical significance were: age, gender, age at peak height velocity and peak height velocity (in centimetres), initial BMI SDS, vitamin D level, PTH, FEV1%, oral corticosteroids and impaired glucose tolerance.
Determinant of initial and change in bone mineral content-results from hierarchical multiple linear regression (backward method).
| β | 95% CI | |
|---|---|---|
| Determinants of baseline LS BMC SDSa | ||
| Height SDS | −0.414 | −0.652; −0.176 |
| Supplemental feeding | −0.637 | −1.861; −0.660 |
| Determinants of annualised ∆ LS BMC SDSb | ||
| ∆ FEV1% | 0.010 | 0.003; 0.014 |
| Initial vitamin D | 0.014 | 0.001; 0.016 |
| Second BMI SDS | 0.105 | 0.006; 0.176 |
95% CI, 95% confidence intervals; BMI SDS, body mass index standard deviation score (Cole T. et al. 2000); LS BMC SDS, lumbar spine bone mineral content standard deviation score; ∆ FEV1%, difference in forced expiratory volume in 1 s percent, between subsequent assessments. Supplemental feeding was coded 0 if absent and was coded 1 if supplemental feeding was present. aHierarchical regression model (backward method) R=0.492, adjusted R square=0.202, p<0.001. bHierarchical regression model (backward method) R=0.467, adjusted R square=0.297, p=0.017.
Determinants of change in bone mineral content
To identify predictors of change for bone mineral content, annualised ∆ LS BMC SDS was used as dependent variable in a hierarchical multiple linear regression (backward method).
The significant determinants of initial LS BMC SDS were ∆ FEV1%, second BMI SDS, and initial vitamin D level. All determinants correlated directly with annualised ∆LS BMC SDS, as shown in Table 2. Variables that did not reach statistical significance were: age, gender, peak height velocity (in centimetres), age at peak height velocity, initial BMI SDS, second vitamin D level, initial and second FEV1%, initial, second and change in PTH, oral corticosteroids, supplemental feeding, impaired glucose tolerance and segregation status.
Discussion
Increased life expectancy for people with CF requires a greater need for monitoring conditions such as CF-related low bone mineral mass. Several cross-sectional reports have reported low bone mass in both post-pubertal children and adults with CF, although adults tend to be more affected [18], [19], [20], [21], [22]. Monitoring bone mass and providing preventive care are necessary from childhood through adolescence to minimise CF-related bone disease in adults with CF [8]. Although several cross-sectional studies have examined bone mass in children with CF [8], [23], longitudinal determinants of bone health have rarely been studied [24], [25], [26]. Thus, we aimed to assess the extent of bone health problems in a contemporary cohort of children with CF, to assess changes in bone health to better understand determinants of bone mineral content as assessed by DXA.
The pubertal spurt of children with CF did not appear to be delayed and similar to the recent report by Bournez et al. [27]. In accordance with several previous studies, the PHV was impaired in both sexes in our cohort [28], [29]. However, as we did not have data on the Tanner pubertal stage, we cannot accurately conclude this.
Over 60% of children in our study were vitamin D insufficient or deficient at baseline. Other studies report variable percentages for vitamin D deficiency ranging from 19% to 97% in children with CF [30], [31]. The prevalence may be influenced by several factors such as sun exposure, geographical position, supplementation regimen, disease severity, age and other medications. Guidelines from the Cystic Fibrosis Foundation’s Consensus Conference on Bone Health recommend that vitamin D2 supplementation is required to maintain 25OHD levels ≥ 30 ng/mL [9]. However, maintaining 25OHD in individuals with CF at this level may be challenging. Low 25OHD may lead to a rise in serum PTH [32] and although different PTH thresholds (45 to 75 pg/mL) are used to define hyperparathyroidism [31], [33] elevated PTH levels are strongly associated with increased bone resorption and bone loss [34]. Almost 12% of children with CF in this study had a PTH above 7.5 pmol/L (70 pg/mL), similar with findings in another analysis in the general population [31]. The findings in our study also suggest that a combined assessment of 25OHD with PTH may be more beneficial in assessing the risk of vitamin D deficiency to bone health. Additionally, the presence of supplemental feeding was strongly associated with a lower BMC.
Overall, most children showed a fall in LS BMC SDS over the period of follow-up. The prevalence of bone mineral density (BMD) z-scores below −1 SD was 10% in our study, but it has been reported to be as high as 85% in some adult CF studies [9]. On the other hand, there are some cross-sectional surveys showing that pre-pubertal children with CF do not have a bone mineral deficit compared with a weight- and sex-matched control groups [35], [36], [37], [38]. The reasons for the discrepancy in the findings include: differences in measurement and analytic techniques that adjust for impaired growth and maturation in CF patients, disease severity, reference data, and the lack of consensus in defining impaired bone health in children.
Factors influencing bone health in CF patients are partly nutritional, due to possibly low caloric intake; vitamin D, vitamin K, calcium, and essential fatty acid depletion. Muscle mass plays an important role in achieving and maintaining bone health, however decreased muscle mass is almost universal in CF [39], [40]. Chronic inflammation, and glucocorticoid treatment further threaten bone health in CF [9]. The factors found to influence the change in BMC in our study, included FEV1%, and poorer nutritional status as described by BMI and low vitamin D. Several cross-sectional studies have demonstrated a positive correlation between bone mineral mass and both FEV1% and BMI [8], [9], [39]. Our longitudinal study has also confirmed this association, but larger longitudinal studies are needed to further clarify this.
Chronic pulmonary infection in individuals with CF may be a contributory factor in the long-term complications of low weight and bone disease [40]. The segregation status was not found as a significant factor in bone mass change.
This study had several limitations. Factors that were not assessed in the current study that may require further exploration in a prospective study include the incidence of hospitalisations and fractures, gonadal function, Shwachman score, cumulative steroid therapy, other medication, Vitamin K sufficiency and pancreatic insufficiency. The study did not assess the physical exercise practice that is a known factor to influence bone mass. The genotype-phenotype interactions, in relevance to the bone mass, were not assessed in this study. As this is a retrospective longitudinal study it has some limitations. The children with CF had a DXA scan as a routine part of bone health screening, however, there may have been some selection bias as those with repeated scans had a lower baseline bone content (−0.34 vs −0.15) or other risk factors for bone loss that rendered them inherently different from those who did not have follow-up scans. Thus the results from the first DXA assessment (100 children) may be more representative of a CF population, while the findings from the follow-up DXA assessments may be more representative of children with CF that are at risk for lower bone mass.
Conclusions
In summary, in this large single centre longitudinal study, children with CF showed a gradual fall in bone mass SDS and the likelihood of this fall was greater in those with worse respiratory disease, poorer nutritional status and a low vitamin D when combined with a high PTH.
Author contributions: All the authors have accepted responsibility for the entire content of this submitted manuscript and approved submission. Adela Chirita-Emandi performed the initial data collection, statistical analysis, drafted the initial manuscript, revised the manuscript and approved the final manuscript as submitted. Sheila Shepherd, Andreas Kyriakou, Jane Delamere McNeilly, Carol Dryden, Donna Corrigan and Anne Devenny performed the initial data collection, reviewed and revised the manuscript, and approved the final manuscript as submitted. Syed Faisal Ahmed conceptualised and designed the study and coordinated and supervised data collection, critically reviewed the manuscript, and approved the final manuscript as submitted.
Research funding: Adela Chirita-Emandi was supported by the European Society of Paediatric Endocrinology through a Clinical Fellowship.
Employment or leadership: None declared.
Honorarium: None declared.
Competing interests: The funding organisation(s) played no role in the study design; in the collection, analysis, and interpretation of data; in the writing of the report; or in the decision to submit the report for publication.
References
1. Rosenstein BJ, Cutting GR. The diagnosis of cystic fibrosis: a consensus statement. Cystic Fibrosis Foundation consensus panel. J Pediatr 1998;132:589–95.10.1016/S0022-3476(98)70344-0Suche in Google Scholar
2. Stalvey MS, Clines KL, Havasi V, McKibbin CR, Dunn LK, et al. Osteoblast CFTR inactivation reduces differentiation and osteoprotegerin expression in a mouse model of cystic fibrosis-related bone disease. PLoS One 2013;8:e80098.10.1371/journal.pone.0080098Suche in Google Scholar PubMed PubMed Central
3. Gore AP, Kwon SH, Stenbit AE. A roadmap to the brittle bones of cystic fibrosis. J Osteoporos 2010;2011:926045.10.4061/2011/926045Suche in Google Scholar PubMed PubMed Central
4. Aris RM, Renner JB, Winders AD, Buell HE, Riggs DB, et al. Increased rate of fractures and severe kyphosis: sequelae of living into adulthood with cystic fibrosis. Ann Intern Med 1998;128:186–93.10.7326/0003-4819-128-3-199802010-00004Suche in Google Scholar PubMed
5. Elkin SL, Fairney A, Burnett S, Kemp M, Kyd P, et al. Vertebral deformities and low bone mineral density in adults with cystic fibrosis: a cross-sectional study. Osteoporos Int J Establ Result Coop Eur Found Osteoporos Natl Osteoporos Found USA 2001;12:366–72.10.1007/s001980170104Suche in Google Scholar PubMed
6. Rossini M, Del Marco A, Dal Santo F, Gatti D, Braggion C, et al. Prevalence and correlates of vertebral fractures in adults with cystic fibrosis. Bone 2004;35:771–6.10.1016/j.bone.2004.05.009Suche in Google Scholar PubMed
7. Rovner AJ, Zemel BS, Leonard MB, Schall JI, Stallings VA. Mild to moderate cystic fibrosis is not associated with increased fracture risk in children and adolescents. J Pediatr 2005;147:327–31.10.1016/j.jpeds.2005.04.015Suche in Google Scholar PubMed
8. Sermet-Gaudelus I, Castanet M, Retsch-Bogart G, Aris RM. Update on cystic fibrosis-related bone disease: a special focus on children. Paediatr Respir Rev 2009;10:134–42.10.1016/j.prrv.2009.05.001Suche in Google Scholar PubMed
9. Aris RM, Merkel PA, Bachrach LK, Borowitz DS, Boyle MP, et al. Guide to bone health and disease in cystic fibrosis. J Clin Endocrinol Metab 2005;90:1888–96.10.1210/jc.2004-1629Suche in Google Scholar PubMed
10. Ferguson JH, Chang AB. Vitamin D supplementation for cystic fibrosis. Cochrane Database Syst Rev 2014;5:CD007298.10.1002/14651858.CD007298.pub4Suche in Google Scholar PubMed
11. Sinha R, Fisch G, Teague B, Tamborlane WV, Banyas B, et al. Prevalence of impaired glucose tolerance among children and adolescents with marked obesity. N Engl J Med 2002;346:802–10.10.1056/NEJMoa012578Suche in Google Scholar PubMed
12. Freeman JV, Cole TJ, Chinn S, Jones PR, White EM, et al. Cross sectional stature and weight reference curves for the UK, 1990. Arch Dis Child 1995;73:17–24.10.1136/adc.73.1.17Suche in Google Scholar PubMed PubMed Central
13. Cole TJ, Pan H, Butler GE. A mixed effects model to estimate timing and intensity of pubertal growth from height and secondary sexual characteristics. Ann Hum Biol 2014;41:76–83.10.3109/03014460.2013.856472Suche in Google Scholar PubMed PubMed Central
14. Arundel P, Ahmed SF, Allgrove J, Bishop NJ, Burren CP, et al. British Paediatric and Adolescent Bone Group’s position statement on vitamin D deficiency. Br Med J 2012;345:e8182.10.1136/bmj.e8182Suche in Google Scholar PubMed
15. Ahmed SF, Russell S, Rashid R, Beattie TJ, Murphy AV, et al. Bone mineral content, corrected for height or bone area, measured by DXA is not reduced in children with chronic renal disease or in hypoparathyroidism. Pediatr Nephrol Berl Ger 2005;20:1466–72.10.1007/s00467-005-1973-ySuche in Google Scholar PubMed
16. Ahmed SF, Horrocks IA, Patterson T, Zaidi S, Ling SC, et al. Bone mineral assessment by dual energy X-ray absorptiometry in children with inflammatory bowel disease: evaluation by age or bone area. J Pediatr Gastroenterol Nutr 2004;38:276–80.10.1097/00005176-200403000-00008Suche in Google Scholar PubMed
17. van der Sluis IM, de Ridder MA, Boot AM, Krenning EP, de Muinck Keizer-Schrama SM. Reference data for bone density and body composition measured with dual energy X-ray absorptiometry in white children and young adults. Arch Dis Child. 2002;87:341–7.10.1136/adc.87.4.341Suche in Google Scholar PubMed PubMed Central
18. Grey V, Atkinson S, Drury D, Casey L, Ferland G, et al. Prevalence of low bone mass and deficiencies of vitamins D and K in pediatric patients with cystic fibrosis from 3 Canadian centers. Pediatrics 2008;122:1014–20.10.1542/peds.2007-2336Suche in Google Scholar PubMed
19. Caldeira RJ, Fonseca Vde M, Gomes SC Jr, Chaves CR. Prevalence of bone mineral disease among adolescents with cystic fibrosis. J Pediatr (Rio J) 2008;84:18–25.10.2223/JPED.1737Suche in Google Scholar PubMed
20. Donadio MV, de Souza GC, Tiecher G, Heinzmann-Filho JP, Paim TF, et al. Bone mineral density, pulmonary function, chronological age, and age at diagnosis in children and adolescents with cystic fibrosis. J Pediatr (Rio J) 2013;89:151–7.10.1016/j.jped.2013.03.008Suche in Google Scholar PubMed
21. Lucidi V, Bizzarri C, Alghisi F, Bella S, Russo B, et al. Bone and body composition analyzed by dual-energy X-ray absorptiometry (DXA) in clinical and nutritional evaluation of young patients with Cystic Fibrosis: a cross-sectional study. BMC Pediatr 2009;9:61.10.1186/1471-2431-9-61Suche in Google Scholar PubMed PubMed Central
22. Putman MS, Baker JF, Uluer A, Herlyn K, Lapey A, et al. Trends in bone mineral density in young adults with cystic fibrosis over a 15 year period. J Cyst Fibros Off J Eur Cyst Fibros Soc 2015;14:526–32.10.1016/j.jcf.2015.01.011Suche in Google Scholar PubMed PubMed Central
23. Brookes DS, Briody JN, Munns CF, Davies PS, Hill RJ. Cystic fibrosis-related bone disease explored using a four step algorithm. J Cyst Fibros Off J Eur Cyst Fibros Soc 2015;14:127–34.10.1016/j.jcf.2014.07.011Suche in Google Scholar PubMed
24. Buntain HM, Schluter PJ, Bell SC, Greer RM, Wong JC, et al. Controlled longitudinal study of bone mass accrual in children and adolescents with cystic fibrosis. Thorax 2006;61:146–54.10.1136/thx.2005.046516Suche in Google Scholar PubMed PubMed Central
25. Gronowitz E, Mellström D, Strandvik B. Normal annual increase of bone mineral density during two years in patients with cystic fibrosis. Pediatrics 2004;114:435–42.10.1542/peds.114.2.435Suche in Google Scholar PubMed
26. Papaioannou A, Kennedy CC, Freitag A, O’Neill J, Pui M, et al. Longitudinal analysis of vertebral fracture and BMD in a Canadian cohort of adult cystic fibrosis patients. BMC Musculoskelet Disord 2008;9:125.10.1186/1471-2474-9-125Suche in Google Scholar PubMed PubMed Central
27. Bournez M, Bellis G, Huet F. Growth during puberty in cystic fibrosis: a retrospective evaluation of a French cohort. Arch Dis Child 2012;97:714–20.10.1136/archdischild-2011-301069Suche in Google Scholar PubMed
28. Aswani N, Taylor CJ, McGaw J, Pickering M, Rigby AS. Pubertal growth and development in cystic fibrosis: a retrospective review. Acta Paediatr Oslo Nor 2003;92:1029–32.10.1111/j.1651-2227.2003.tb02571.xSuche in Google Scholar
29. Arrigo T, Rulli I, Sferlazzas C, De Luca F. Pubertal development in cystic fibrosis: an overview. J Pediatr Endocrinol Metab 2003;16(Suppl 2):267–70.Suche in Google Scholar
30. Robberecht E, Vandewalle S, Wehlou C, Kaufman J-M, De Schepper J. Sunlight is an important determinant of vitamin D serum concentrations in cystic fibrosis. Eur J Clin Nutr 2011;65:574–9.10.1038/ejcn.2010.280Suche in Google Scholar PubMed
31. Ginde AA, Wolfe P, Camargo CA Jr, Schwartz RS. Defining vitamin D status by secondary hyperparathyroidism in the U.S. population. J Endocrinol Invest 2012;35:42–8.Suche in Google Scholar
32. Chapuy MC, Preziosi P, Maamer M, Arnaud S, Galan P, et al. Prevalence of vitamin D insufficiency in an adult normal population. Osteoporos Int 1997;7:439–43.10.1007/s001980050030Suche in Google Scholar PubMed
33. West NE, Lechtzin N, Merlo CA, Turowski JB, Davis ME, et al. Appropriate goal level for 25-hydroxyvitamin D in cystic fibrosis. Chest 2011;140:469–74.10.1378/chest.10-2114Suche in Google Scholar PubMed
34. Sahota O, Mundey MK, San P, Godber IM, Lawson N, et al. The relationship between vitamin D and parathyroid hormone: calcium homeostasis, bone turnover, and bone mineral density in postmenopausal women with established osteoporosis. Bone 2004;35:312–9.10.1016/j.bone.2004.02.003Suche in Google Scholar PubMed
35. Buntain HM, Greer RM, Schluter PJ, Wong JCH, Batch JA, et al. Bone mineral density in Australian children, adolescents and adults with cystic fibrosis: a controlled cross sectional study. Thorax 2004;59:149–55.10.1136/thorax.2003.006726Suche in Google Scholar PubMed PubMed Central
36. Mortensen LA, Chan GM, Alder SC, Marshall BC. Bone mineral status in prepubertal children with cystic fibrosis. J Pediatr 2000;136:648–52.10.1067/mpd.2000.104271Suche in Google Scholar PubMed
37. Haslam RH, Borovnicar DJ, Stroud DB, Strauss BJ, Bines JE. Correlates of prepubertal bone mineral density in cystic fibrosis. Arch Dis Child 2001;85:166–71.10.1136/adc.85.2.166Suche in Google Scholar PubMed PubMed Central
38. Vanacor R, Raimundo FV, Marcondes NA, Corte BP, Ascoli AM, et al. Prevalence of low bone mineral density in adolescents and adults with cystic fibrosis. Rev Assoc Médica Bras 2014;60:53–8.10.1590/1806-9282.60.01.012Suche in Google Scholar PubMed
39. Elkin SL, Williams L, Moore M, Hodson ME, Rutherford OM. Relationship of skeletal muscle mass, muscle strength and bone mineral density in adults with cystic fibrosis. Clin Sci Lond Engl 2000;99:309–14.10.1042/CS20000020Suche in Google Scholar
40. Ionescu AA, Nixon LS, Evans WD, Stone MD, Lewis-Jenkins V, et al. Bone density, body composition, and inflammatory status in cystic fibrosis. Am J Respir Crit Care Med 2000;162(3 Pt 1):789–94.10.1164/ajrccm.162.3.9910118Suche in Google Scholar PubMed
©2017 Walter de Gruyter GmbH, Berlin/Boston
Artikel in diesem Heft
- Frontmatter
- Editorial
- Endocrine aspects in cystic fibrosis
- Original Articles
- A retrospective analysis of longitudinal changes in bone mineral content in cystic fibrosis
- Cystic-fibrosis related-diabetes (CFRD) is preceded by and associated with growth failure and deteriorating lung function
- Partial clinical remission in type 1 diabetes: a comparison of the accuracy of total daily dose of insulin of <0.3 units/kg/day to the gold standard insulin-dose adjusted hemoglobin A1c of ≤9 for the detection of partial clinical remission
- Concentrations of leptin, adiponectin and other metabolic parameters in non-obese children with Down syndrome
- Parent reported nutritional risk and laboratory indices of cardiometabolic risk and in preschool-aged children
- Multinodular goiter in children: treatment controversies
- Atopy as a risk factor for subclinical hypothyroidism development in children
- Mutation analysis of the NKX2.5 gene in Iranian pediatric patients with congenital hypothyroidism
- Health-related quality of life among children with Turner syndrome: controlled cross-sectional study
- Growth and pubertal patterns in young survivors of childhood acute lymphoblastic leukemia
- Clinical features and genotyping of patients with primary carnitine deficiency identified by newborn screening
- Letter to the Editor
- Sensitivity and specificity of cystic fibrosis-related diabetes screening methods: which test should be the reference method?
- Case Reports
- Type 1 rhizomelic chondrodysplasia punctata with a homozygous PEX7 mutation
- Severe hypertriglyceridemia at new onset type 1 diabetes mellitus
- 45,X/46,XY ovotesticular disorder of sex development revisited: undifferentiated gonadal tissue may be mistaken as ovarian tissue
- MRI in medium-chain acyl-coenzyme a dehydrogenase deficiency: neuroimaging during the first month