Identifying potential risk areas close to the oil and gas pipelines due to subsidence in Qazvin plain
-
Mahmoud Rajabi
 and
Mehdi Goli
and
Mehdi Goli

Abstract
Surface displacement caused by natural and anthropogenic activities poses a significant risk to subsurface pipelines, particularly in areas experiencing subsidence. Stress and strain induced by deformation can lead to pipeline buckling and potential vulnerability. This study applies a multidisciplinary approach integrating interferometric synthetic aperture radar (InSAR) deformation analysis, well data, and geological context to assess the risk to oil and gas pipelines in Iran’s Qazvin plain. The focus is on evaluating the impact of an unconfined aquifer, which has a lower risk of subsidence compared to a confined aquifer, on pipeline infrastructure. We analyzed multitemporal Sentinel-1 data collected between 2014 and 2021. Our findings reveal that 2,400 km2 of the study area is experiencing subsidence with vertical rates reaching up to 14 cm/year with an average
Graphical abstract
1 Introduction
Pipelines serve as a reliable and cost-effective means of transporting various fluids, including gas, water, and sewage. Typically installed underground, they benefit from both protection and structural support. While their design primarily considers flow requirements and operating pressure, external environmental factors such as land deformation can significantly affect their integrity (Oruji et al. 2022).
Land deformation is a critical challenge faced by pipeline infrastructure, arising from both natural and anthropogenic causes. These include excessive groundwater extraction, hydrocarbon withdrawal, mining, sediment compaction, and seismic activity (Johnson 1991, Oruji et al. 2022). One of the most pervasive forms of land deformation is subsidence, often induced by groundwater withdrawal, which affects more than 150 major cities globally (Pirouzi & Eslami 2017), including Mexico City Lopez-Quiroz et al. (2009), Houston (Buckley et al. 2003), and several cities in Iran (Motagh et al. 2017). Subsidence can be categorized as elastic (recoverable) or inelastic (permanent), with the latter resulting in irreversible compaction and loss of aquifer storage capacity (Poland & Davis 1969, Galloway & Burbey 2011).
The interaction between land deformation and buried pipelines depends on several key factors: soil characteristics, pipeline flexibility, and the magnitude and direction of ground movement. Vertical or horizontal displacements in the soil can impose stress, cause bending, or even result in pipeline rupture. Understanding the local soil mineralogy, mechanical properties, and settlement behavior is crucial for assessing and mitigating pipeline risk (Guo 2005).
The Qazvin plain in Iran presents a unique case study. It is an agriculturally and industrially significant region that also serves as a critical corridor for oil and gas transportation. The province overlays an unconfined aquifer (Javadi et al. 2022, Faghihi et al. 2010) that has experienced significant subsidence over the past two decades (Babaee et al. 2020). Although such high-magnitude deformation is more typically associated with confined aquifers (Smith & Majumdar 2020), emerging evidence suggests that large-scale groundwater depletion in unconfined systems can also lead to severe subsidence (Majumdar et al. 2022, Leake & Galloway 2007). In Qazvin, subsidence rates exceeding 10 cm/year challenge the conventional assumption that unconfined aquifers are less susceptible to major consolidation.
Moreover, Qazvin hosts strategic energy infrastructure, including oil and gas pipelines with diameters ranging from 8 to 56 in (Jalali et al. 2016). These pipelines are critical to both national and international energy supply chains and are vulnerable to damage caused by ground deformation.
Remote sensing technologies, particularly interferometric synthetic aperture radar (InSAR), provide powerful means of monitoring land deformation with high spatial and temporal resolution (Rajabi et al. 2020b, 2015, 2020a, 2023, 2022, 2021a,b). Ground-based and remote sensing methods exist for tracking deformation (Hu et al. 2004), with radar altimetry (Lee et al. 2008) and InSAR (Motagh et al. 2017, Shamshiri et al. 2014, Akbari & Motagh 2011, Dehghani et al. 2013) being especially effective in regions like Iran. Despite several studies focusing on subsidence in the Qazvin plain, few have investigated its direct implications for infrastructure vulnerability. One study observed deformation rates of up to 85 mm/year along the satellite’s line of sight (LOS) due to a 65 mm/year subsidence rate during 2003–2016 (Babaee et al. 2020). This suggests a potential cumulative deformation of around 1 m by 2019, presenting a considerable risk to underground infrastructure.
In this study, we apply a multidisciplinary approach to identify and assess land deformation hazards affecting long-distance buried oil and gas pipelines in the Qazvin plain, Iran. We utilize multitemporal Sentinel-1 synthetic aperture radar (SAR) imagery from 2014 to 2021, processed using a modified SBAS InSAR technique, to derive high-resolution vertical displacement maps. These ground motion results are compared with groundwater level data from observation wells to evaluate the relationship between aquifer depletion and surface deformation. We further calculate the skeletal storage coefficient (
This integrated approach enables a comprehensive assessment of subsidence drivers and associated risks to critical pipeline infrastructure, contributing to a more nuanced understanding of hydrogeological dynamics and their impact on strategic energy systems.
2 Study area
The Qazvin province is located in the northwest of Iran (

(a) The black boundary shows Iran on the world map and (b) the Qazvin province and the study area are shown in green and pink respectively. The orange dash boundary represents the Qazvin plain.
Qazvin is one of the coldest provinces in Iran, with an arid and semi-arid climate and an average daily temperature of

(a) Abstraction from the aquifer in the Qazvin plain between 1965 and 2020. The total volume extracted increased from 200 hm3 to 2,000 hm3, corresponding to an average abstraction rate of approximately 32.7 hm3/year and (b) Groundwater level and precipitation trends from 1970 to 2015. Groundwater declined from 1,233 to 1,197 m (
The Qazvin plain is geologically located between the Alborz and Ramand mountains, from the north to the south. These mountains are the main source of quaternary sediments in the plain, illustrated by brown, yellow, gray, and light green in Figure 3. The main faults in this region are the North Qazvin, Mosha, North Tehran, Ipak, and Eshtehard faults (red line in Figure 3), and there is approximately 0.3–3 mm/year movement along the faults in terms of tectonic activity (Babaee et al. 2020). The area moved less than 2 mm/year with respect to the International Terrestrial Reference Frame (ITRF) 2005 due to the Arabian-Eurasian convergence (Djamour et al. 2010).

Geological map of the Qazvin province which is simplified and overlaid on digital elevation model (DEM). Red polygon shows the area of study (Babaee et al. 2020). The below panel also represents the thickness of the Geological layers (Source: Geological Organization of Iran).
The study region is traversed by several significant oil and gas pipelines, as depicted in Figure 4, underscoring its strategic importance in energy distribution. The green and black lines show oil and gas pipelines, and the black box illustrates the study area.

The map illustrates Iran’s vital network of oil and gas pipelines. The black and green lines are the gas and oil pipelines, respectively, (SOUTHFRONT 2016).
3 Data
3.1 Radar images
We used roughly 7 years of Sentinel-1A level 1, interferometric wide (IW) single look complex (SLC), ascending and descending products from orbit 101 and 108, respectively. The IW mode is the principal acquisition mode over the land surface, with a temporal and spatial resolution of 12 days and
3.2 Ground water well observations
Observation or monitoring wells are used to monitor the groundwater changes and hydrologic processes in the long and short term (Skalbeck et al. 2002). Figure 5 presents an example of an observation well (Janicki 2011), along with the distribution of other observation wells across the region. In total, there are over 113 observation wells throughout the Qazvin plain, but for this study, data from six wells within the investigation area were used.

A sample photo of an observational well and the position of the selected observation wells in the area shown by red points.
4 Method and theory
To estimate the ongoing deformation in the area, we employed a modified SBAS InSAR time series analysis (Vajedian & Smith 2024). Utilizing multimaster interferograms, the SBAS algorithm aims to resolve spatiotemporal decorrelation problems and predict accurate deformation signals.
Figure 6 shows the workflow we use in this study, including differential interferometric SAR processing, supplementary analysis to reduce tropospheric, unwrapping, and orbital errors, and modified SBAS time series analysis. The first step of the differential interferometric process is baseline estimation, which is critical to find the interferometric pairs with short baseline. The co-registration procedure, interferogram production, flat earth and topography phase removal, filtering, and unwrapping analysis are the next steps in the differential InSAR (DInSAR) processing. Here, we use shuttle radar topography mission 30 m resolution as the external DEM to eliminate the topographic phase component. DInSAR processing is implemented in generic mapping tools SAR (GMTSAR: an open-source GNU general public license – InSAR processing system designed with Generic Mapping Tools (GMT) (Sandwell et al. 2011).

Methodology flowchart based on multitemporal SBAS method.
Our SBAS analysis begins with the construction of an interferogram network based on a maximum temporal baseline of 150 days and a spatial baseline of 200 m. These thresholds are selected to maintain a balance between maximizing the number of usable interferometric pairs and minimizing decorrelation effects. A shorter temporal baseline improves temporal coherence by reducing changes in surface scatterers (especially important in agricultural or semi-urban areas), while a shorter spatial baseline reduces geometric decorrelation and phase noise, particularly in areas with subtle topographic variation. Thresholds of 150 days and 200 m are consistent with guidelines for SBAS–InSAR in similar geophysical and climatic settings, where surface changes and tropospheric effects must be managed carefully (Berardino et al. 2002, Ferretti et al. 2006, Hooper et al. 2012).
For phase filtering, we apply a coherence threshold of 0.2 to each interferogram to mask low-quality pixels prior to time-series inversion. The choice of 0.2 represents a conservative lower bound that allows for higher point density while still preserving sufficient phase stability for accurate deformation retrieval. Studies by Motagh et al. (2017) and Hooper et al. (2012) demonstrate that coherence thresholds between 0.2 and 0.3 are commonly used in agricultural and arid landscapes to capture deformation over spatially distributed targets with moderate signal decorrelation. This threshold helps retain more pixels in non-urban settings without significantly compromising the reliability of the time-series solution. Considering the masked-out interferometric phase value, we modify the initial SBAS network for each pixel.
All the decorrelated interferometric pairs that are assigned to NaN values in the previous step for a given pixel, are dropped from the network. The remaining interferometric pairs are used for the time series analysis to estimate displacement values. Each pixel with a fully connected SBAS network, at least two interferometric connections for each network node, is kept for time series analysis. This method enhances the density of the persistent scatterers points while increasing the number of involved interferometric pairs in the SBAS network. Increasing the interferograms also helps reduce the noise caused by temporally uncorrelated tropospheric effects such as atmospheric phase delay.
The modified SBAS processing is performed on all available Sentinel-1 data acquired from two different geometries including ascending and descending spanning the years 2014 through 2021. The standard deviation of the uncorrelated signal (in time) is decreased by a factor of (
4.1 Vertical displacement velocity
To decompose the vertical velocity from ascending and descending deformations in the LOS direction, we can use Eq. (1) (Motagh et al. 2017).
To separate the vertical and horizontal (east-west) components of deformation from the LOS velocities derived from ascending and descending orbits, we use equation (1), following a standard geometric decomposition technique (Hooper et al. 2012). The incidence angle (

Schematic representation of the geometric decomposition of LOS velocities into vertical and east-west components using ascending and descending SAR acquisitions. The figure illustrates the incidence angle (
4.2 Land subsidence and pipeline vulnerability
Oil and gas pipelines play a crucial role in the global energy supply chain by transporting vital energy resources across vast distances. However, they face various threats that can compromise their safety, reliability, and efficiency. These threats can be categorized into three main types: physical, cyber, and environmental.
Environmental threats include natural hazards or extreme events that can affect the performance or integrity of the pipeline due to geological, meteorological, or climatic factors. Environmental threats can result in ruptures, cracks, deformations, or blockages, reducing the pipeline capacity, quality, or lifespan.
Subsidence is one of these environmental threats. According to Biot (1941), Verruijt (1969), Detournay & Cheng (1993), and Wang (2000), regional subsidence features, such as the compaction of aquifer systems or reservoirs due to the extraction of groundwater, oil, and gas, generally result in relatively minor lateral strains at the land surface due to the broad extent over which these phenomena typically occur. These strains occur due to the aquifer system’s poroelastic deformation and the land surface’s flexure. Poroelastic deformation refers to the coupled interaction between fluid flow and the deformation of the skeletal matrix of the host rock. Flexure, on the other hand, describes the motion of the land surface when a portion of it undergoes vertical displacement, while other regions experience no or differing motion, causing, the rotation or tilt (slope) of the land surface between the two sites.
Local vertical displacement can occur regardless of the specific process causing land subsidence. Figures 8 and 9 provide visual representations of different factors that contribute to deformation and are relevant to pipelines passing through subsidence areas. Let’s imagine a hypothetical scenario where a pipeline is physically connected to the land surface and initially installed on a flat terrain. Figure 8 shows the computed axial (approximate horizontal) displacements and strains in a hypothetical pipeline, and Figure 9 presents an idealized nonlinear subsidence surface and deformation profiles. The subsidence surface has a maximum subsidence of 1 m at the center, decreasing to zero at a radius of 100 m.
![Figure 8
Selected deformation factors (vertical displacement, slope [tilt], and axial strain) for hypothetical pipelines traversing an idealized linear subsidence feature (Baum et al. 2008).](/document/doi/10.1515/jogs-2025-0186/asset/graphic/j_jogs-2025-0186_fig_008.jpg)
Selected deformation factors (vertical displacement, slope [tilt], and axial strain) for hypothetical pipelines traversing an idealized linear subsidence feature (Baum et al. 2008).

Selected deformation features for an idealized nonlinear subsidence feature. (a) Subsidence surface and (b) deformation profiles (Baum et al. 2008).
The depicted strains in Figures 8 and 9 are typically not significant enough to lead to the failure of pipelines. However, they could potentially create problems for gravity-driven flow in pipelines or other surface structures. Pressurized pipelines are less likely to experience flow disruptions due to small variations in the vertical gradient. However, substantial local subsidence features (common in the large area affected by subsidence) such as sinkholes and earth fissures can generate significant lateral strains in close proximity (exceeding 100 ppm) and pose a risk of structural failure for nearby pipelines.
To ensure the security and resilience of pipeline systems, it is essential to adopt a comprehensive and proactive approach that involves risk assessment, prevention, detection, mitigation, and recovery measures. Collaboration and coordination among various stakeholders such as pipeline operators, regulators, governments, industry associations, and civil society are crucial to enhancing pipeline protection and preparedness.
5 Results and discussion
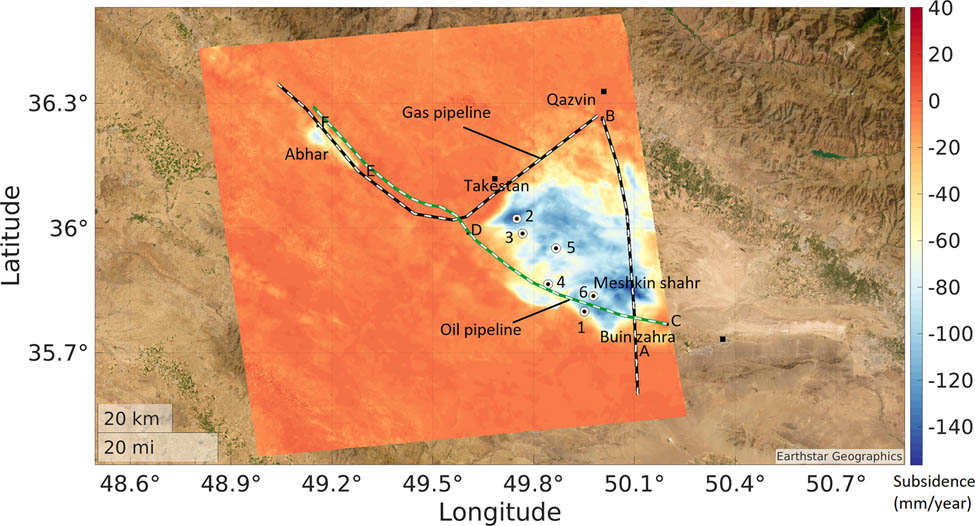
The differential interferograms were produced as described in Section 4. As shown in Figure 10, the principal interferograms have been made by the baseline less than 200 m spatially and 150 days temporally for orbits 101 and 108. Figure 11 shows the mean deformation velocity in the vertical direction. As is prominent on the map, two distinctive areas under large deformation are agricultural regions in the Qazvin plain. Both mainly use traditional irrigation methods such as flood irrigation. The most significant deformation on the eastern side of the map is in Qazvin province and shows approximately 2,300 km2 square kilometers of the land under severe subsidence. The deformation rate maximally reached up to 14 cm/year vertically, and the area covers Qazvin, Takestan, Alvand, Buinzahra, Shal cities, and the surrounding villages. There is some subsidence in the western portion of the InSAR region in and around the city of Abhar and illustrates about 100 km2 of land at risk of subsidence. This area is also agricultural and has many gardens with a traditional irrigation system.

The spatiotemporal design of interferograms network of the ascending and descending Sentinel- 1A SAR images. The lines denote the SBAS, and the points represent the images.

The average vertical velocity of the deformation map obtained from ascending and descending Sentinel-1 overlaid on the georeferenced Google Earth image of the study area. The points are the location of the observation wells, which are used to compare with the InSAR-derived deformation time series. The black and green paths show the approximate passage of the gas and oil pipelines in the region. The A til F points illustrate the start and end of the lines chosen for deformation profile drawing along pipeline paths.
To independently validate our deformation results, we compared them with the Subsidence Map of Iran, a nationwide dataset developed collaboratively by the German Research Centre for Geosciences (GFZ), Leeds University, and the Iran National Cartographic Center (NCC). This map integrates multitemporal InSAR data to highlight high-risk subsidence zones across the country (Haghighi & Motagh 2024). Notably, the Qazvin plain is clearly marked as one of the regions experiencing extensive and high-magnitude subsidence. Our derived subsidence rates – reaching up to 14 cm/year in strong agreement with the zones identified in the national dataset. This spatial and temporal alignment supports the robustness of our SBAS–InSAR results and further emphasizes the significance of subsidence hazards in the region.
5.1 Pipeline vulnerability
Analysis of pipelines requires data about their attributes, including age, diameter, materials, depth, joint configurations, and previous maintenance history, among others. For the most part, these data are not available and validated region, but reasonable assumptions can inform the study. The authors did obtain estimates from local contacts that the oil pipeline under study here comprises parallel 14 and 16 in lines constructed in 1979 and 1983, and the gas pipeline is 56 in and built in 2002 (personal communication with an employee of Qazvin Gas Department, 2023-04-05).
To investigate the deformations close to the passed pipelines in the study region, we superimposed the approximate route of the pipelines on the average vertical velocity of the deformation map, which is derived by applying the multitemporal InSAR method to the SAR images. Figure 11 shows, that pipelines passing regions with high deformation velocity are most likely at risk. We chose three routes along the pipeline path based on the deformation map and drew two-dimensional cumulative deformation profiles that occurred during the study period. The first route is related to the gas pipeline passing from south to north and is shown by a black line in Figure 11. The route crosses the Qazvin plain and passes through areas with high deformation rates, such as the area close to Esmat-Abads in the city of Buin-Zahra. Figure 12(a) shows the vertical deformation profile along the route and illustrates the situation close to the gas pipelines in the study period. The profile shows different deformation patterns along the pipes with deformation of up to one meter over roughly 10 km. The vulnerability of the pipeline will depend on the extent to which it can survive such deformations without failure.

Two-dimensional cumulative deformation profiles related to gas and oil routes AB (a), CD (b), and EF (c) are shown in Figure 9. The red lines show the region’s topography based on the DEM we used, and the blue line illustrates deformation from 2014 to 2021.
The second route shows the oil pipeline that passes east to west and is demonstrated by the green line in Figure 11. The beginning and the end of the route are marked by C and D, and the distance is about 60 km. Figure 12(b) shows the deformation profile of the way that is similar to the first route.
The last path is around Abhar City in the Zanjan province. The black line represents this route, and E and F are the starting and ending points with a distance of about 20 km. Figure 12(c) shows the graph for the variation of the deformation in this gas pipeline route.
5.1.1 Analysis
The analysis addresses the risk to oil and gas pipelines with attributes similar to those explained above. These pipelines cross a zone with unconfined aquifers of fine-grained soils that exhibit subsidence rates of up to 14 cm/year. Based on uncertainty estimates in multitemporal InSAR techniques – where vertical displacement uncertainties are typically on the order of 1–2 cm (Akbari & Motagh 2011) – this translates into a relative uncertainty of approximately 15–20% in the annual subsidence rate.
Risk analysis of pipeline failure will focus on threats, vulnerabilities, and consequences. The threat is posed by the subsidence, the vulnerability by pipeline attributes, and the consequences by factors such as environmental sensitivity, proximity of settlements, and time to repair damage, among other factors.
In addition to the rate of deformation, the threat will also depend on geologic and geotechnical conditions like soil cohesion. If the pipeline is buried in fine-grained sediments, it is more likely that its rigidity would be such to lower its movement with subsidence by pushing upward against the falling cover material of fine sediments. If, however, the soil is cohesive, it is more likely to adhere to the pipeline and cause it to fall at the same rate as the ground surface.
Whether a deformation rate of about 14 cm/year is enough to cause failure will depend on the pipeline vulnerability, which depends on material, corrosion, integrity of joints, and previous failures, among other attributes. These are unknown, but assumptions can be made for further study of scenarios. The main point of this descriptive analysis is to demonstrate the use of remote sensing data to study the threats to the pipeline. Future of the risk analysis will require data collection to measure vulnerability and identify consequences.
5.1.2 Geologic and hydrologic conditions
Deformation in the Qazvin plain is driven by groundwater depletion, as indicated by the sharp decline in groundwater levels, and the presence of compressible materials in the eastern portion of the plain where subsidence is most pronounced. Qazvin plain as the tectonic activity is minimal, and there was no earthquake during the study period. Figure 13 shows the time series related to groundwater variation (right side with red) and vertical displacement time series (left side with blue) in six locations where observation wells exist.

Shows the graphs of the time series related to groundwater level and Vertical displacement in the six points of the study area.
The Qazvin plain is primarily classified as an unconfined aquifer system (Babaee et al. 2020). Traditionally, confined aquifers are considered to have a higher risk of subsidence due to the greater hydraulic heads they can experience and the delayed drainage of compressible interbedded clays. However, numerous studies have shown that unconfined aquifers are also susceptible to significant subsidence under specific hydrogeological conditions (Galloway & Burbey 2011). In particular, when groundwater levels fall below their historically lowest levels, the effective stress acting on fine-grained sediments can exceed the preconsolidation stress, triggering inelastic (irreversible) compaction. This type of deformation is typically one to two orders of magnitude greater than elastic deformation (Sandwell et al. 2011). This is significant because inelastic deformation leads to irreversible compaction of the aquifer system, resulting in permanent loss of storage capacity. These findings are consistent with previous research that emphasizes the long-term consequences of inelastic subsidence on groundwater management and land surface stability (Poland & Davis 1969). A more thorough understanding of this mechanism is essential for predicting future subsidence risks and for planning sustainable groundwater use. Figures 2 and 13 illustrate that groundwater levels in the study region are at or near historical minima, aligning with the observed high subsidence rates. In this study,
While subsidence in unconfined aquifers has historically received less attention, emerging literature – including our findings – demonstrates that such systems can undergo substantial inelastic deformation when subjected to persistent overextraction and limited recharge. Previous works by Leake & Galloway (2007) and Motagh et al. (2017) have similarly documented land subsidence in water-table aquifers with clay-rich stratigraphy. These findings challenge the conventional assumption that unconfined aquifers inherently pose a lower risk for land deformation. Instead, they emphasize that stratigraphic composition, depth of groundwater extraction, and duration of depletion are critical controls on compaction behavior – regardless of aquifer confinement status.
Accordingly, we conclude that the high subsidence rates observed in the Qazvin plain result from inelastic deformation of fine-grained sediments in an unconfined system where prolonged groundwater extraction has reduced water levels beyond critical thresholds. This underscores the importance of incorporating detailed geomechanical and hydrological assessments in subsidence-prone areas, even when aquifers are classified as unconfined. The Qazvin plain is primarily unconfined (Babaee et al. 2020). Confined aquifers are often considered to have a higher risk of subsidence due to the large drops in groundwater level they can experience. However, unconfined aquifers may also experience subsidence (Galloway & Burbey 2011). Inelastic deformation typically occurs in fine-grained sediments when groundwater levels are at or below their historically lowest levels and can lead to subsidence rates that are one to two orders of magnitude higher than elastic deformation (Sandwell et al. 2011). Figures 2 and 13 show that water levels are at historically low levels in the regions affected by subsidence in this study. The parameter
6 Summary and conclusion
In this study, we introduced and applied the SBAS technique based on a dataset of Sentinel-1 IW mode images over the Qazvin province to analyze the deformation and identify at-risk areas near the strategic oil/gas pipelines. The Qazvin plain, an important unconfined aquifer, has been at a plain risk of deformation over the past few decades because of excessive groundwater consumption. In addition, due to the province’s strategic location, essential energy pipelines pass through the region, and monitoring and mapping the deformation around the pipelines is vital. A data preparation procedure was applied to make interferograms concerning the satellite orbital data and DEM over the study area. The SBAS method was used in the next step to generate interferograms and retrieve the deformation and velocity map. The results showed that 2,400 km2 of the study region was under deformation (blue areas on Figure 11), of which 2,300 km2 was within the Qazvin province (approximately 16% of the Qazvin province) and 100 km2 belong to the Abhar city in the Zanjan province. The subsidence rate was also calculated to reach up to 14 cm/year in some regions, such as Takestan city, and compared to the previous studies, an increase in the deformation velocity remake was observed. Profiles were then drawn in the direction of the oil/gas pipelines, revealing that there is up to 1 m of spatial variation in deformation along the pipelines, which poses a risk to the pipelines. Finally, to investigate the reason for the deformation, the deformation time series in some positions were compared to the time series of the observational wells (groundwater level data), and the data suggest that inelastic subsidence due to groundwater depletion was the reason for the deformation and indicate that these conditions can cause significant subsidence even in unconfined regions. This study demonstrates the utility of InSAR for buried pipeline deformation monitoring to find high-risk areas to ensure the safe operation of pipelines and avoid any unexpected damage.
Acknowledgments
This research was supported by the Norwegian University of Science and Technology and Iran Ministry of Science, Research and Technology. The authors would like to acknowledge the ESA/Copernic for providing the Sentinel-1 data and Qazvin Regional Water Administration for preparing the groundwater dataset.
-
Funding information: Authors state no funding involved.
-
Author contributions: Conceptualization: M.R.; data curation: M.R. and S.V.; formal analysis: M.R., S.V., and G.N.; funding acquisition, M.R. and H.N.; investigation, M.R. and S.V.; methodology, M.R. and S.V; software, M.R. and S.V. was supervision, H.N., M.G., R.S., and G.N; validation, M.R. and S.V.; visualization, M.R. and S.V.; writing – original draft, M.R.; Writing – review and editing, H.N., M.G, G.N., and R.S. All authors have read and agreed to the published version of the manuscript.
-
Conflict of interest: The authors declare no conflict of interest.
-
Data availability statement: The data are freely available and we mention this in the manuscript text.
References
Akbari, V., and M. Motagh. 2011. “Improved ground subsidence monitoring using small baseline sar interferograms and a weighted least squares inversion algorithm.” IEEE Geoscience and Remote Sensing Letters, 9(3): 437–41. 10.1109/LGRS.2011.2170952Search in Google Scholar
Askari, A. M. A. 2009. Spatial analysis of ground water quality by geo-statistical analysis of geographic information systems in Qazvin plain study. International Conference on Water Resources with a Regional Approach, Iran.Search in Google Scholar
Babaee, S., Z. Mousavi, Z. Masoumi, A. H. Malekshah, M. Roostaei, and M. Aflaki. 2020. “Land subsidence from interferometric sar and groundwater patterns in the Qazvin plain, Iran.” International Journal of Remote Sensing, 41(12): 4780–98. 10.1080/01431161.2020.1724345Search in Google Scholar
Baum, R. L., D. L. Galloway, and E. L. Harp. 2008. Landslide and land subsidence hazards to pipelines. US: US Geological Survey.10.3133/ofr20081164Search in Google Scholar
Berardino, P., G. Fornaro, R. Lanari, and E. Sansosti. 2002. “A new algorithm for surface deformation monitoring based on small baseline differential sar interferograms.” IEEE Transactions on Geoscience and Remote Sensing, 40(11): 2375–83. 10.1109/TGRS.2002.803792Search in Google Scholar
Biot, M. A. 1941. “General theory of three-dimensional consolidation.” Journal of Applied Physics, 12(2): 155–64. 10.1063/1.1712886Search in Google Scholar
Buckley, S. M., P. A. Rosen, S. Hensley, and B. D. Tapley. 2003. “Land subsidence in houston, texas, measured by radar interferometry and constrained by extensometers.” Journal of Geophysical Research: Solid Earth, 108(B11). 10.1029/2002JB001848Search in Google Scholar
Bürgmann, R., P. A. Rosen, and E. J. Fielding. 2000. “Synthetic aperture radar interferometry to measure earth’s surface topography and its deformation.” Annual Review of Earth and Planetary Sciences, 28(1): 169–209. 10.1146/annurev.earth.28.1.169Search in Google Scholar
Dehghani, M., M. J. V. Zoej, and I. Entezam. 2013. “Neural network modelling of tehran land subsidence measured by persistent scatterer interferometry.” PFG Photogrammetrie, Fernerkundung, Geoinformation, 2013(1):5–17. 10.1127/1432-8364/2013/0154 Search in Google Scholar
Detournay, E., and A. H.-D. Cheng. 1993. “Fundamentals of poroelasticity.” In: Analysis and design methods, pp. 113–71. Reston, Virginia, USA: Elsevier. 10.1016/B978-0-08-040615-2.50011-3Search in Google Scholar
Djamour, Y., P. Vernant, R. Bayer, H. R. Nankali, J.-F. Ritz, J. Hinderer, Y. Hatam, B. Luck, Le Moigne, N., M. Sedighi, et al. 2010. “Gps and gravity constraints on continental deformation in the Alborz mountain range, Iran.” Geophysical Journal International, 183(3): 1287–301. 10.1111/j.1365-246X.2010.04811.xSearch in Google Scholar
Doornbos, E., and R. Scharroo. 2005. “Improved ers and envisat precise orbit determination.” In: Envisat & ERS Symposium, vol. 572. Search in Google Scholar
Faghihi, N., F. Kave, and H. Babazadeh. 2010. “Prediction of aquifer reaction to different hydrological and management scenarios using visual modflow model-case study of Qazvin plain.” Journal of Water Sciences Research, 2(1): 39–45.Search in Google Scholar
Ferretti, A., C. Prati, and F. Rocca. 2006. “Permanent scatterer insar: A paradigm shift in sar interferometry.” Remote Sensing of Environment, 102(3–4): 328–43. Search in Google Scholar
Galloway, D., and T. J. Burbey. 2011. “Review: Regional land subsidence accompanying groundwater extraction.” Hydrogeology Journal, 19(8): 1459–86. 10.1007/s10040-011-0775-5Search in Google Scholar
Guo, P. 2005. “Numerical modeling of pipe–soil interaction under oblique loading.” Journal of Geotechnical and Geoenvironmental Engineering, 131(2):260–8.10.1061/(ASCE)1090-0241(2005)131:2(260)Search in Google Scholar
Haghighi, M. H., and M. Motagh. 2024. “Uncovering the impacts of depleting aquifers: A remote sensing analysis of land subsidence in Iran.” Science Advances, 10(19): eadk3039. 10.1126/sciadv.adk3039Search in Google Scholar PubMed PubMed Central
Hagigi and Lashkari. “Analysis of surface water and groundwater in the plain of the vineyards, the second regional.” In: Conference on Applied Geology and Environment, proceeding, p. 23. Wiley Online Library. Search in Google Scholar
Hooper, A., D. Bekaert, K. Spaans, and M. Arıkan. 2012. “Recent advances in sar interferometry time series analysis for measuring crustal deformation.” Tectonophysics, 514–517: 1–13. 10.1016/j.tecto.2011.10.013Search in Google Scholar
Hu, R., Z. Yue, L.C. Wang, Wang, and S. Wang. 2004. “Review on current status and challenging issues of land subsidence in China.” Engineering Geology, 76(1–2): 65–77. 10.1016/j.enggeo.2004.06.006Search in Google Scholar
Iran Ministry of Energy - Regional Water Authority. 2020. Groundwater level monitoring data for Qazvin plain. Unpublished internal dataset provided to the authors. Search in Google Scholar
Jalali, H. H., F. R. Rofooei, N. K. A. Attari, and M. Samadian. 2016. “Experimental and finite element study of the reverse faulting effects on buried continuous steel gas pipelines.” Soil Dynamics and Earthquake Engineering, 86:1–14. 10.1016/j.soildyn.2016.04.006Search in Google Scholar
Janicki, E. 2011. Observation well network: Groundwater level graphs, data to April 2010. Victoria, BC: Ministry of Environment. Search in Google Scholar
Javadi, S., S. M. Hashemy Shahdany, A. Neshat, and A. Chambel. 2022. “Multi-parameter risk mapping of qazvin aquifer by classic and fuzzy clustering techniques.” Geocarto International, 37(4): 1160–82. 10.1080/10106049.2020.1778099Search in Google Scholar
Johnson, A. I. 1991. Land subsidence. Göttingen, Germany: International Association of Hydrological Sciences. Search in Google Scholar
Leake, S., and D. L. Galloway. 2007. MODFLOW ground-water model: User guide to the subsidence and aquifer-system compaction package (SUB-WT) for water-table aquifers. Reston, Virginia, USA: US Geological Survey. 10.3133/tm6A23Search in Google Scholar
Lee, H., C. Shum, C.-Y. Kuo, Y. Yi, and A. Braun. 2008. “Application of topex altimetry for solid earth deformation studies.” Terrestrial, Atmospheric & Oceanic Sciences, 19(1–2):37–46. 10.3319/TAO.2008.19.1-2.37(SA)Search in Google Scholar
López-Quiroz, P., M.-P. Doin, F. Tupin, P. Briole, and J.-M. Nicolas. 2009. “Time series analysis of mexico city subsidence constrained by radar interferometry.” Journal of Applied Geophysics, 69(1):1–15. Advances in SAR Interferometry from the 2007 Fringe Workshop. 10.1016/j.jappgeo.2009.02.006Search in Google Scholar
Majumdar, S., R. Smith, B. D. Conway, and V. Lakshmi. 2022. “Advancing remote sensing and machine learning-driven frameworks for groundwater withdrawal estimation in arizona: Linking land subsidence to groundwater withdrawals.” Hydrological Processes, 36(11): e14757. 10.1002/hyp.14757Search in Google Scholar PubMed PubMed Central
Motagh, M., R. Shamshiri, M. H. Haghighi, H.-U. Wetzel, B. Akbari, H. Nahavandchi, S. Roessner, and S. Arabi. 2017. “Quantifying groundwater exploitation induced subsidence in the rafsanjan plain, southeastern Iran, using insar time-series and in situ measurements.” Engineering Geology, 218: 134–51. 10.1016/j.enggeo.2017.01.011Search in Google Scholar
Oruji, S., M. Ketabdar, D. Moon, V. Tsao, and M. Ketabdar. 2022. “Evaluation of land subsidence hazard on steel natural gas pipelines in California.” Upstream Oil and Gas Technology, 8: 100062. 10.1016/j.upstre.2021.100062Search in Google Scholar
Pirouzi, A., and A. Eslami. 2017. “Ground subsidence in plains around tehran: site survey, records compilation and analysis.” International Journal of Geo-Engineering, 8(1): 1–21. 10.1186/s40703-017-0069-4Search in Google Scholar
Poland, J., and G. Davis. 1969. “Land subsidence due to withdrawal of fluids.”. US Geological Survey Professional Paper 437, US.10.1130/REG2-p187Search in Google Scholar
Rahmanipour, F., R. Marzaioli, H. A. Bahrami, Z. Fereidouni, and S. R. Bandarabadi. 2014. “Assessment of soil quality indices in agricultural lands of Qazvin province, Iran.” Ecological indicators, 40: 19–26. 10.1016/j.ecolind.2013.12.003Search in Google Scholar
Rajabi, M., A. Amiri-Simkooei, J. Asgari, V. Nafisi, and S. Kiaei. 2015. “Analysis of tec time series obtained from global ionospheric maps.” Journal of Geomatics Science and Technology, 4(3): 213–24. Search in Google Scholar
Rajabi, M., A. Amiri-Simkooei, H. Nahavandchi, and V. Nafisi. 2020a. “Modeling and prediction of regular ionospheric variations and deterministic anomalies.” Remote Sensing, 12(6): 936. 10.3390/rs12060936Search in Google Scholar
Rajabi, M., M. Hoseini, H. Nahavandchi, M. Asgarimehr, M. Semmling, M. Ramatschi, M. Goli, and J. Wickert. 2023. “Tidal harmonics retrieval using gnss-r dual-frequency complex observations.” Journal of Geodesy, 97(10): 94. 10.1007/s00190-023-01782-6Search in Google Scholar
Rajabi, M., M. Hoseini, H. Nahavandchi, M. Semmling, M. Ramatschi, M. Goli, R. Haas, and J. Wickert. 2021a. “Performance assessment of GNSS-R polarimetric observations for sea level monitoring.” In: EGU General Assembly Conference Abstracts, pp. EGU21–12709. 10.5194/egusphere-egu21-12709Search in Google Scholar
Rajabi, M., M. Hoseini, H. Nahavandchi, M. Semmling, M. Ramatschi, M. Goli, R. Haas, and J. Wickert. 2021b. “A performance assessment of polarimetric GNSS-R sea level monitoring in the presence of sea surface roughness.” In 2021 IEEE International Geoscience and Remote Sensing Symposium IGARSS, pp. 8328–31. IEEE. 10.1109/IGARSS47720.2021.9554562Search in Google Scholar
Rajabi, M., M. Hoseini, H. Nahavandchi, M. Semmling, M. Ramatschi, M. Goli, R. Haas, and J. Wickert. 2022. “Polarimetric GNSS-R sea level monitoring using I/Q interference patterns at different antenna configurations and carrier frequencies.” IEEE Transactions on Geoscience and Remote Sensing, 60: 1–13. 10.1109/TGRS.2021.3123146Search in Google Scholar
Rajabi, M., H. Nahavandchi, and M. Hoseini. 2020b. “Evaluation of cygnss observations for flood detection and mapping during sistan and baluchestan torrential rain in 2020.” Water, 12(7): 2047. 10.3390/w12072047Search in Google Scholar
Sandwell, D., R. Mellors, X. Tong, M. Wei, and P. Wessel. 2011. “Gmtsar: An insar processing system based on generic mapping tools.” Eos Transactions, American Geophysical Union, 92(28): 234–5. 10.1029/2011EO280002 Search in Google Scholar
Sanginabadi, H., B. Saghafian, and M. Delavar. 2019. “Coupled groundwater drought and water scarcity index for intensively overdrafted aquifers.” Journal of Hydrologic Engineering, 24(4): 04019003. 10.1061/(ASCE)HE.1943-5584.0001764Search in Google Scholar
Shamshiri, R., M. Motagh, M. Baes, and M. A. Sharifi. 2014. “Deformation analysis of the lake urmia causeway (LUC) embankments in Northwest Iran: insights from multi-sensor interferometry synthetic aperture radar (insar) data and finite element modeling (FEM).” Journal of Geodesy, 88(12): 1171–85. 10.1007/s00190-014-0752-6Search in Google Scholar
Skalbeck, J. D., L. Shevenell, and M. C. Widmer. 2002. “Mixing of thermal and non-thermal waters in the steamboat hills area, Nevada, USA.” Geothermics, 31(1): 69–90. 10.1016/S0375-6505(01)00010-4Search in Google Scholar
Smith, R., and S. Majumdar. 2020. Groundwater storage loss associated with land subsidence in Western United Sates mapped using machine learning Water Resources Research, 56(7): e2019WR026621. 10.1029/2019WR026621Search in Google Scholar
Smith, R. G., R. Knight, J. Chen, J. Reeves, H. Zebker, T. Farr, and Z. Liu. 2017. “Estimating the permanent loss of groundwater storage in the Southern San Joaquin Valley, California.” Water Resources Research, 53(3): 2133–48. 10.1002/2016WR019861Search in Google Scholar
SOUTHFRONT. 2016. Analysis: Oil and gas pipelines in the middle east. Search in Google Scholar
Vajedian, S., M. Motagh, and F. Nilfouroushan. 2015. “Stamps improvement for deformation analysis in mountainous regions: Implications for the damavand volcano and mosha fault in Alborz.” Remote Sensing, 7(7): 8323–47. 10.3390/rs70708323Search in Google Scholar
Vajedian, S., R. Smith, W. A. Schreüder, J. Maurer. 2024. “Aquifer system deformation in the san luis valley: A new framework for modeling subsidence in agricultural regions.” Journal of Hydrology, 642: 131876. 10.1016/j.jhydrol.2024.131876Search in Google Scholar PubMed PubMed Central
Verruijt, A. 1969. “Elastic storage of aquifers.” Flow Through Porous Media, 1: 331–76. Search in Google Scholar
Wang, H. 2000. Theory of linear poroelasticity with applications to geomechanics and hydrogeology, vol. 2. New Jersey, United States: Princeton University Press. 10.1515/9781400885688Search in Google Scholar
© 2025 the author(s), published by De Gruyter
This work is licensed under the Creative Commons Attribution 4.0 International License.
Articles in the same Issue
- Research Articles
- Investigating the prediction ability of the ionospheric continuity equation during the geomagnetic storm on May 8, 2016
- Combination of PSInSAR and GPS for stress and strain tensor estimation in Afar
- Quasigeoid computation in the Nordic and Baltic region
- Development and evolution of height systems in the context of SIRGAS: From the local vertical data to the International height reference frame
- On the combination of altimetry and tide gauge observations in the Norwegian coastal zone
- Building a large-scale surface gravity network in Colombia using highly redundant measurements
- Identifying potential risk areas close to the oil and gas pipelines due to subsidence in Qazvin plain
- RFI localization using C/N0 measurements from low cost GNSS sensors for robust positioning