Integrating lidar technology in artisanal and small-scale mining: A comparative study of iPad Pro LiDAR sensor and traditional surveying methods in Ecuador’s artisanal gold mine
-
 ,
,

Abstract
This research evaluates the use of the iPad Pro 11 with LiDAR sensor (LS) for geospatial surveying in Ecuador’s artisanal and small-scale mining (ASM) sector, a key contributor to the national economy; however, it is hindered by outdated equipment and environmental challenges. It was conducted at “La Zamorana,” an underground gold mine. The study compares the efficacy of iPad LS against traditional surveying methods across five phases, including control point establishment, traditional and LiDAR surveying, data postprocessing, and an electronic survey assessing ASM’s technological readiness. The findings indicate that the iPad LS outperforms traditional methods in detail and accuracy, particularly in elevation measurements, with most discrepancies under 5 cm. The precision of the LiDAR methodology is highlighted by the closer alignment of points to control points than traditional surveying methods. In summary, the iPad Pro 11 with LS shows promise as an affordable ASM tool for geospatial surveying in ASM in Ecuador. The research emphasizes how receptive the industry is to new technology developments. However, further research is recommended to explore the technology’s effectiveness in diverse mining environments, ensuring its comprehensive applicability in ASM.
Graphical abstract
1 Introduction
Mining, a cornerstone of Ecuador’s economy, contributed over $2.7 billion to its exports in 2022, representing a significant 2.41% of its GDP (Madera 2023). This sector’s success is partly attributable to artisanal and small-scale gold mining (ASGM), a notable contributor to Ecuador’s total gold production (Wingfield et al. 2021). Despite its economic importance, ASGM faces numerous challenges, including financial constraints, outdated equipment, environmental concerns (Melodi and Ajibade 2019), and inadequate regulatory and educational support (Aizawa 2016, Swenson et al. 2011).
A critical obstacle in artisanal and small-scale mining (ASM) is the limited implementation of advanced mine geospatial surveying, which is essential for ensuring safety and operational efficiency. As Darling (2011) pointed out, effective deep-mine surveys necessitate a 3-D approach integrating both underground and surface surveys. This need is underscored by events like the 2010 tunnel collapse, where 33 miners were trapped (Long and Brown 2018), emphasizing the importance of accurate surveying for rescue operations, directional drilling, and managing mine locations and surface features.
A significant sinkhole event in Ecuador on December 15, 2021, which forced the evacuation of over 300 people and limited access to portions of a mining town, brought attention to the importance of accurate surveying (Sellers et al. 2023). This incident highlighted the need for improved surveying and monitoring techniques in the area.
Recent technological developments have enhanced mapping, communication, localization, and monitoring in mines. These developments include wireless communication, LiDAR-based SLAM approaches, UAVs, and advanced DInSAR analysis (Forooshani et al. 2013, Herrera et al. 2007, Park and Choi 2020, Ren et al. 2019). Their application has been confined mainly to large-scale mining operations, with ASM yet to benefit fully from these developments.
The introduction of LiDAR sensor (LS) in consumer devices like Apple’s iPhones and iPads presents an opportunity for cost-effective and user-friendly geospatial survey tools in ASM. Luetzenburg found that iPad LS compares favorably with traditional surveying methods, indicating potential for broad application in geosciences (Luetzenburg et al. 2021).
This research evaluates iPad LS’s accuracy compared to traditional geospatial tools in “La Zamorana,” an artisanal underground mine in Ecuador. It also includes an electronic survey to understand the current state of geospatial surveying in ASM and assess readiness for technological investment. This research aims to investigate how modern technology can be integrated into ASM to overcome the challenges faced by the mining industry and support its long-term growth.
2 Materials and methods
2.1 Study area
The study was carried out at “La Zamorana,” an underground gold mining site in southern Ecuador’s Nuevo Quito township, which is part of the Zamora Province. This mine, situated near the provincial boundaries of Loja and Morona-Santiago (Figure 1), operates under Ecuador’s artisanal mining regime. According to Suárez, the region’s geographic features offer special potential and problems for artisanal mining methods (Suárez et al. 2023).

Study area location.
Geologically, “La Zamorana” is located in the Zubandean zone in the southeastern region of Ecuador, dominated by Jurassic I-type intrusions and Triassic to cretaceous sedimentary and volcanic rocks (Litherland et al. 1994). It is in the Cordillera del Cóndor, part of a metallogenic belt that extends in almost a north direction and contains mainly epithermal Au–Ag deposits at the Chinapintza mining district (PRODEMINCA, 2000).
Artisanal mining in Ecuador refers to small-scale operations that are mostly conducted by locals. These operations differ from larger, automated mining operations in that they often rely on manual labor and a restricted amount of technology. “La Zamorana” is a prime example of such an operation, offering a relevant context for this research.
In particular, the research was carried out in a drift of “La Zamorana.” Drift is an underground excavation created typically to access ore bodies, facilitate ventilation, or serve as a pathway for transportation (Adoko et al. 2021). The studied drift serves as the main infrastructure for transporting materials and providing workers with access. Therefore, accurate geospatial surveying in a typical artisanal mining setting is essential. Consequentially, this infrastructure offered an ideal environment to examine the effectiveness of the iPad LS in a typical artisanal mining setting.
2.2 Research phases
The study was carefully organized into the following five phases.
2.2.1 Phase 1: Control points
The primary objective of this phase was to establish that a baseline for assessing the accuracy of LS Surveying is integrated into the iPad Pro, compared with conventional surveying techniques. Establishing control points is crucial for validating the accuracy of spatial data obtained from different surveying methods.
An expert surveyor with 5 years of experience was involved in this phase, ensuring accuracy and dependability. The surveyor methodically measured 65 linear meters of the “La Zamorana” drift, establishing nine control points using a Trimble C5 Mechanical Total Station (TS) with 2” accuracy, a Prism with its pole, and Trimble Access software following the Open Traverse Method linked with a known point outside. These control points were placed precisely on the drift floor and marked with red paint for clear visibility and reference (Figure 2).

Mosaic of the 9 points used in the investigation, from point 1, located near the drift entrance, to point 9, the furthest from the entrance.
The starting point for all surveying measurements was established at East 769285.00, North 9552680.00, and Elevation 1680.00, using the WGS 84 Zone 17 S datum. This location served as a consistent reference point for all the surveying methods employed in the study. The point was taken using a Galaxy 1 GNSS receiver equipped with a Linux platform, supporting multiple satellite constellations, including GPS, GLONASS, BeiDou, and Galileo. This was done in real-time kinematic surveying mode outside the portal of the drift, with an accuracy of 8 mm + 1 ppm (horizontal) and 15 mm + 1 ppm (vertical).
2.2.2 Phase 2: Traditional surveying methods
Compass and tape measurements (CandTM): This widely used method in fields such as cave exploration and geological studies (Albert 2017, Yasin et al. 2017) employs a tape measure for distance and a compass for direction. In our study, the surveyor used CandTM to record spatial data at nine control points within the mine using a Brunton transit compass with an azimuth range of 0–360° and a 50 m tape measure. With less than 6 months of experience using these tools, the surveyor followed the Azimuth Measurement Waist-Level method using the “N” end of the needle described in the Geo Transit Operator’s Manual. For the distance measurements, the tape measure was placed on the floor and extended from point to point.
Total station surveying (TSS): TS involves using a theodolite system or electronic equipment to obtain detailed geospatial data, including elevation (Khalili et al. 2013, Kvamme et al. 2006). Since this tool was used in Phase 1, those points were not included again. Instead, the surveyor captured 11 points along the drift and performed 52 sections over a 65-m length, as shown in Figure 3, following the methods described by Zhang et al. (2022). This allowed the creation of a 3D solid model of the drift, detailed in Phase 4, for detailed profile comparison, the surveyor used the same TS as in Phase 1.

Section (a) presents a plan view of the polylines connecting the 11 points surveyed in a drift section using TS. Section (b) illustrates how these points were measured. Finally, the (c) section provides a three-dimensional perspective of the 52 sections (MSC CODE 86A30).
2.2.3 Phase 3: LiDAR sensor surveying (LSS)
LSS was conducted using a third generation 11-inch iPad Pro with a 3D Scanner Application and a Bi-Color LED500LR Video Light from Godox. The iPad’s integrated LS consists of a vertical cavity surface-emitting laser for depth sensing and a direct time-of-flight near infra-red CMOS image sensor with a single photon avalanche diode array. Apple has not released any official technical specifications for the device (Spreafico et al. 2021). The iPad LS captures photographs from various angles using multi-photogrammetry and LS techniques to create 3D models. The surveyor, with no more than 3 months of experience, recorded the drift’s shape by pointing the camera at the floor, walls, and roof at approximately 1.5 m intervals along the drift, even though the LS can reach up to 5 m (Inc. 2020). The Godox light was set to 100% brightness with a color temperature of 5,600 K, and both the light and iPad moved together during the recording.
2.2.4 Phase 4: Postprocessing
AutoCAD processing: The data from Phases 1 and 2 were processed using AutoCAD. Control point data were uploaded as DXF files, and a polyline was drawn. For the CandTM method, azimuth and distance data were manually inputted. TSS data were downloaded and represented with polylines to create different polygon sections. These sections were used to create a 3D surface of the drift using the LOFT command in AutoCAD.
CloudCompare processing: The data from the 3D scanner app were downloaded in LAS format and processed using CloudCompare. A noise filter was applied to enhance the quality of the point cloud data, as Rusu and Cousins emphasized (2011). Sections were created using CloudCompare’s segmentation tools for manual segmentation within the 3D point cloud. Subsequently, the coordinates of the points at the center of the nine red-marked control points in the point cloud were extracted for comparison. Also, a solid model was built from the point cloud.
The accuracy between the control and measured points in the method was established using Euclidean distances. Equation (1) is used to calculate the shortest distance between two points as a straight line in Euclidean space (Moakher 2006).
where d(p,q) in the euclidean distances between points p and q, p = (p1, p2, p3) represents the 3D coordinates of point p, and q = (q1, q2, q3) represents the 3D coordinates of point q.
Additionally, to compare the profile detail of the drift between the 3D surface created by the TS and the 3D surface generated from the LS, two cross-sections were taken at coordinates East 769300.00 and North 9552700.00.
2.2.5 Phase 5: Survey of the current state of underground topography in ASM in Ecuador
To evaluate the suitability of the iPad for geospatial surveying, a survey was conducted among randomly selected mining titleholders from the Ecuadorian mining cadaster. As it is challenging to reach ASM titleholders, the questionnaire was distributed via email. While 997 individuals received the survey, only seven titleholders responded. The questions included inquiries about the presence of Mining Engineers or Geologists, dimensions of drifts or tunnels, frequency of geospatial surveys, current instruments used, willingness to invest in survey equipment, and potential investment amounts. This survey aimed to understand current practices and potential for technological adoption in ASM, which aligns with the categorizations defined by the Ecuadorian Mining Law.
The classification of ASM under the regime is divided into Artisanal Mining and Small-Scale Mining. For metallic minerals, artisanal mining allows for an underground extraction rate of 10 tons/day and an alluvial extraction rate of 120 m³/day. For small-scale mining, the limits are 300 tons/day for underground, 1,000 tons/day for open-pit, and 1,500 m³/day for alluvial operations. Non-metallic minerals in artisanal mining are capped at 50 tons/day, while small-scale mining permits the extraction of up to 1,000 tons/day. For construction materials, artisanal mining allows 100 m³/day for alluvial or non-consolidated materials and 50 tons/day for open-pit in hard rocks. Small-scale mining permits 800 m³/day for alluvial terraces and 500 tons/day for open-pit in hard rock (LEY DE MINERIA 2018).
3 Results
3.1 Phase 1: Control points
Table 1 presents the coordinates of the nine control points established in Phase 1, and Figure 4 displays them in blue color. These points function as reference benchmarks for assessing the accuracy of multiple surveying methods.
Control point coordinates
| Point | East 769000.00 | North 9552000.00 | Elevation (m) |
|---|---|---|---|
| Pc1 | 285.00 | 680.00 | 1680.00 |
| Pc2 | 283.64 | 682.10 | 1680.04 |
| Pc3 | 283.02 | 684.91 | 1680.09 |
| Pc4 | 283.07 | 687.63 | 1680.12 |
| Pc5 | 284.45 | 690.57 | 1680.29 |
| Pc6 | 286.35 | 700.39 | 1680.53 |
| Pc7 | 295.14 | 720.10 | 1680.96 |
| Pc8 | 301.47 | 717.37 | 1681.07 |
| Pc9 | 314.75 | 716.36 | 1681.12 |

Plan view showing the 9 points obtained using the three methods (MSC CODE 86A30).
3.2 Phase 2: Traditional methods survey
Table 2 provides the coordinates of the nine points surveyed using CandTM methods, and Figure 4 shows them in red color. Additionally, Figure 5 illustrates the plan view and two cross-sections derived from the solid, as previously described.
Compass and tape point coordinates
| Point | East 769000.00 | North 9552000.00 |
|---|---|---|
| P1 | 285.00 | 680.00 |
| P2 | 284.00 | 682.19 |
| P3 | 283.37 | 685.00 |
| P4 | 284.04 | 687.72 |
| P5 | 285.86 | 690.66 |
| P6 | 287.63 | 700.48 |
| P7 | 296.09 | 719.56 |
| P8 | 301.82 | 717.46 |
| P9 | 313.84 | 716.52 |

Section (a) presents the plan view of the solid model of the drift, with the sections in the north and east directions, which are illustrated in the corresponding profiles in sections (b) and (c). Section (d) shows a three-dimensional view of the mining drift generated with TSS (MSC CODE 86A30).
3.3 Phase 3: LS surveying results
Table 3 details the coordinates of the nine points surveyed using LSS methods, and Figure 4 illustrates them in magenta color. Additionally, Figure 6 presents the plan view and two sections derived from the solid, as described earlier.
LiDAR surveying point coordinates
| Point | East 769000.00 | North 9552000.00 | Elevation (m) |
|---|---|---|---|
| P1 | 285.00 | 680.00 | 1680.00 |
| P2 | 283.82 | 682.11 | 1680.01 |
| P3 | 282.92 | 684.85 | 1680.10 |
| P4 | 283.31 | 687.60 | 1680.14 |
| P5 | 284.83 | 690.70 | 1680.34 |
| P6 | 286.45 | 700.55 | 1680.58 |
| P7 | 295.20 | 719.56 | 1681.00 |
| P8 | 300.78 | 717.42 | 1681.11 |
| P9 | 312.84 | 716.02 | 1681.11 |

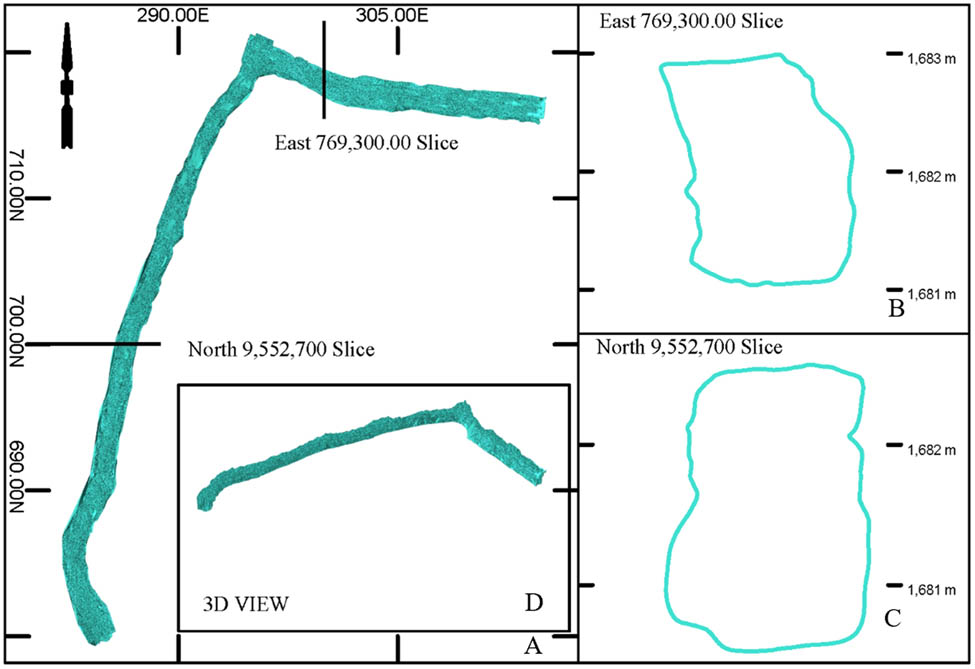
Section (a) presents the plan view of the solid model of the drift, with the sections in the north and east directions, which are illustrated in the corresponding profiles in sections (b) and (c). Section (d) shows a three-dimensional view of the mining drift generated with LSS. (MSC CODE 86A30).
3.4 Phase 4: Postprocessing
Comparison of Geospatial Survey Methods.
Figure 7 presents the plan view for the points using the different surveying methods linked with a polyline. Figure 8 compares the Euclidean distances between points measured with the TandC and LS methods relative to the control points. Figure 9 shows an elevation comparison. Given the TandC method’s lack of elevation data, this comparison was conducted exclusively between the control points and the LS survey.

Plan view of the points controls points, CandTM and LSS (MSC CODE 86A30).

Euclidean distances comparison among CandTM, LSS, and control points.

Elevation differences between LSS and control points.
3.5 Phase 5: Survey of the current state of underground topography in ASM in Ecuador
The electronic survey insights are discussed in below.
4 Discussion
4.1 Comparative analysis of survey methods
No studies demonstrate the LS’s accuracy in Apple’s iPhone 12 Pro and iPad Pro applied in underground mines or tunnel surveying. However, there are studies of the accuracy of this sensor in other applications. A study shows high accuracy for indoor mapping and larger objects, with mean errors around ±1 to ±10 cm depending on the apps Polycam, SiteScape, 3D Scanner, and Scaninverse (Vacca 2023). The present study’s accuracy is based on the control points taken by an experienced surveyor and a TS with 2-s precision.
Since the starting point is the same for all the methods, only eight points are considered in the following analysis. According to the Euclidean distances, 37.5% of the points taken by CandTM are offset less than 0.7 m from the control points, while by LS, 87.5% of the points. On average, the CandTM points are offset 0.85 m from control points, while LS points are 0.55 m. The minimum offset distances from the control points by CandTM is 0.36 m, while by LS, it is 0.10 m. However, the maximum offset from the control points by CandTM is 1.40 m, while LS is 1.90 m.
The elevation data reveal that, in general, 75% of the points taken by LS-derived elevations are, on average, 0.03 m higher than those of control points, while 25% of the points are, on average, 0.02 m lower than control points.
The sections performed on the solids obtained with the TS and the LS show different shapes. The north section of the solid generated by the TS presented 46 points and an area of 1.96 m², while the solid generated by the LS presented 251 points and an area of 2.46 m². In the east section, the solid generated by the TS showed 35 points and an area of 2.45 m², while the one generated by the LS showed 259 points and an area of 2.40 m². However, if the points taken with the TS were densified, the shapes would be more similar. It is important to note that this process would take more time; in this study, the inexperienced surveyor took 4 days to complete the sections using the total station, while it took 50 min with the laser scanner.
Despite the limited response rate, the survey conducted among mining titleholders from the Ecuadorian mining cadaster provides valuable insights into the current state of geospatial surveying in ASM. Six of the seven respondents reported having a Mining Engineer or Geologist, indicating a significant professional expertise. The survey revealed that drifts and tunnels commonly fall within specific dimensional ranges, with widths between 1.00 and 3.00 m and heights between 1.80 and 2.60 m. The frequency of geospatial surveys varied, with some conducting surveys as frequently as multiple times a week while others did so only once or twice a year. This variability suggests differing operational needs and resource allocations. Current instruments used range from traditional methods like CandTM to more advanced technologies like TS and LS, indicating a mix of modern and conventional practices in the field.
A notable finding is the respondents’ willingness to invest in new geospatial survey equipment, with six out of seven showing interest, though the potential investment amounts varied significantly. This willingness suggests a readiness to adopt advanced technologies to enhance survey efficiency and accuracy. However, the varied financial capacities may impact the level of technological adoption. With its integrated LiDAR capabilities, the iPad could provide a cost-effective and efficient solution for improving geospatial surveying practices. The overall positive reception towards investing in new technologies underscores the potential for modernization in ASM, aligning with the categorizations defined by the Ecuadorian Mining Law and the evolving demands of the sector.
5 Conclusions
The present study demonstrates the potential benefits of integrating modern geospatial survey technologies, such as the LS in consumer devices like the iPad Pro, into ASM operations. The comparison of traditional methods, like compass and tape, with the LSS revealed several key insights.
The accuracy of the Compass and Tape Measurement method and the LS in the iPad Pro were evaluated against control points established by an experienced surveyor using a total station. The results indicated that 87.5% of the points measured by the LS were within 0.7 m of the control points, compared to 37.5% for the compass and tape measurements. On average, the offset from the control points was 0.84 m for the compass and tape measurements and 0.53 m for the LS.
Moreover, the survey among Ecuadorian mining titleholders revealed a willingness to invest in new technologies, suggesting a readiness to adopt advanced geospatial tools that could enhance operational efficiency and safety in ASM. This readiness, combined with the positive reception of the iPad Pro’s LiDAR capabilities, points toward a promising future for modernizing ASM practices, aligning with the sector’s evolving demands and the regulations outlined by the Ecuadorian Mining Law.
Acknowledgments
We acknowledge “La Zamorana”, an underground gold mine, for providing access to their facilities for data acquisition.
-
Funding information: The APC was funded by Escuela Superior Politécnica de Chimborazo University (ESPOCH) and was supported by Grupo de Investigación de Recursos Mineros e Ingeniería (GIRMI), part of the ESPOCH.
-
Author contributions: Conceptualization, Christian Ordoñez and Jhosimmar Calvopiña; data curation, Jhosimmar Calvopiña; formal analysis, Christian Ordoñez, Jhosimmar Calvopiña, Andres Carranco, Santiago Toapanta, and Josue Gonzalez; methodology, Christian Ordoñez and Jhosimmar Calvopiña; writing – original draft preparation, Christian Ordoñez; writing – review and editing, Christian Ordoñez, Jhosimmar Calvopiña, Andres Carranco, Santiago Toapanta, and Josue Gonzalez. All authors have read and agreed to the published version of the manuscript.
-
Conflict of interest: The authors declare no conflicts of interest.
-
Disclaimer/Publisher’s note: The statements, opinions, and data contained in all publications are solely those of the individual author(s) and contributor(s) and not of the Journal of Geodetic Science and/or the editor(s). Journal of Geodetic Science and/or the editor(s) disclaim responsibility for any injury to people or property resulting from any ideas, methods, instructions, or products referred to in the content.
-
Data availability statement: The datasets presented in this article are not readily available because of the confidentiality and privacy of the “La Zamorana” mine. Requests to access the datasets should be directed to the corresponding author.
References
Adoko, A. C., K. Yakubov, and R. B. Kaunda. 2021. “Reliability analysis of rock supports in underground mine drifts: A case study.” Geotechnical and Geological Engineering 40(4), 2101–16. 10.1007/s10706-021-02014-4.Search in Google Scholar
Aizawa, Y. 2016. “Artisanal and small-scale mining as an informal safety net: Evidence from Tanzania.” Journal of International Development 28(7), 1029–49. 10.1002/jid.3242.Search in Google Scholar
Albert, G. 2017. Aspects of cave data use in a GIS. United Kingdom: IntechOpen Limited. 10.5772/intechopen.68833.Search in Google Scholar
Darling, P. 2011. SME mining engineering handbook, 3rd ed. In SME Mining Engineering Handbook. Society for Mining, Metallurgy, and Exploration. Englewood, Colorado: E Adam Aircraft Circle.Search in Google Scholar
Forooshani, A. E., S. Bashir, D. G. Michelson, and S. Noghanian. 2013. “A survey of wireless communications and propagation modeling in underground mines.” IEEE Communications Surveys and Tutorials 15(4), 1524–45. 10.1109/surv.2013.031413.00130.Search in Google Scholar
Herrera, G., R. Tomás, J. M. López-Sánchez, J. Delgado, J. J. Mallorquí, S. Duque, et al. 2007. “Advanced DInSAR analysis on mining areas: La Union case study (Murcia, SE Spain).” Engineering Geology 90(3–4), 148–59. 10.1016/j.enggeo.2007.01.001.Search in Google Scholar
Inc., A. 2020. Apple unveils new iPad Pro with LiDAR scanner and trackpad support in iPadOS.Search in Google Scholar
Khalili, A., D. Raclot, H. Habaeib, and J. M. Lamachère. 2013. “Factors and processes of permanent gully evolution in a Mediterranean marly environment (Cape Bon, Tunisia).” Hydrological Sciences Journal, 58(7), 1519–31. 10.1080/02626667.2013.824086.Search in Google Scholar
Kvamme, K. L., E. G. Ernenwein, and C. J. Markussen. 2006. “Robotic total station for microtopographic mapping: An example from the Northern Great Plains.” Archaeological Prospection 13(2), 91–102. 10.1002/arp.270.Search in Google Scholar
LEY DE MINERIA, Quito, Ecuador, 61. 2018.Search in Google Scholar
Litherland, M., J. A. Aspden, and R. A. Jemielita. 1994. “The metamorphic belts of Ecuador.” British Geological Survey. Litherland.Search in Google Scholar
Long, V. and V. Brown. 2018. “Conceptualizing work-related mental distress in the British coalfields (c.1900–1950).” Palgrave Communications 4(1), 1–10. 10.1057/s41599-018-0187-4.Search in Google Scholar PubMed PubMed Central
Luetzenburg, G., A. Kroon, and A. A. Bjørk. 2021. “Evaluation of the Apple iPhone 12 Pro LiDAR for an application in geosciences.” Scientific Reports 11(1), 1–9. 10.1038/s41598-021-01763-9.Search in Google Scholar PubMed PubMed Central
Madera, S. 2023. “Fruta del Norte, the gold mine behind Ecuador’s export boom.” In Fruta del Norte, the gold mine behind Ecuador’s export boom. Madrid, España: Agencia EFE.Search in Google Scholar
Melodi, M. M. and G. W. Ajibade. 2019. “Social-economic assessment and profitability of Artisanal Gold Miners in Niger State, Nigeria.” Fuoye Journal of Engineering and Technology 4(2), 48–51. 10.46792/fuoyejet.v4i2.409.Search in Google Scholar
Moakher, M. 2006. “On the averaging of symmetric positive-definite tensors.” Journal of Elasticity 82, 273–96. 10.1007/s10659-005-9035-z.Search in Google Scholar
Park, S. and Y. Choi. 2020. “Applications of unmanned aerial vehicles in mining from exploration to reclamation: A review.” Minerals 10(8), 663. 10.3390/min10080663.Search in Google Scholar
PRODEMINCA. 2000. “Evaluacion de distritos mineros del Ecuador. Manual de exploración de depósitos metalíferos en el Ecuador.” In Volumen 0. UCP PRODEMINCA Proyecto MEM BIRF 36-55 EC. Quito, Ecuador.Search in Google Scholar
Ren, Z., L. Wang, and L. Bi. 2019. “Robust GICP-based 3D LiDAR SLAM for underground mining environment.” Sensors 19(13), 2915. IEEE International Conference on Robotics and Automation, ICRA 2011, Shanghai, China. 10.3390/s19132915.Search in Google Scholar PubMed PubMed Central
Rusu, R. B. and S. Cousins. 2011. 3D is here: Point cloud library (PCL). 10.1109/icra.2011.5980567.Search in Google Scholar
Sellers, C., L. Ammirati, M. A. Khalili, S. Buján, R. A. Rodas, and D. Di Martire. 2023. The use DInSAR technique for the study of land subsidence associated with illegal mining activities in Zaruma – Ecuador, a cultural heritage cite, edited by Rizzo, P. and A. Milazzo, p. 553–562. Cham, Switzerland: Springer International Publishing.10.1007/978-3-031-07322-9_56Search in Google Scholar
Spreafico, A., F. Chiabrando, L. Teppati Losè, and F. Giulio Tonolo. 2021. “The iPad Pro built-in LiDAR sensor: 3D rapid mapping tests and quality assessment.” The International Archives of the Photogrammetry, Remote Sensing and Spatial Information Sciences 43, 63–69. 10.5194/isprs-archives-XLIII-B1-2021-63-2021.Search in Google Scholar
Suárez, J. P., P. Herrera, C. Kalinhoff, O. Vivanco-Galván, and T. Selvaraj. 2023. “Generalist arbuscular mycorrhizal fungi dominated heavy metal polluted soils at two artisanal and small – scale gold mining sites in Southeastern Ecuador.” BMC Microbiology 23(1), 42. 10.1186/s12866-022-02748-y.Search in Google Scholar PubMed PubMed Central
Swenson, J. J., C. E. Carter, J. Domec, and C. I. Delgado. 2011. “Gold mining in the Peruvian Amazon: Global prices, deforestation, and mercury imports.” Plos One 6(4), e18875. 10.1371/journal.pone.0018875.Search in Google Scholar PubMed PubMed Central
Vacca, G. 2023. “3D survey with apple LiDAR sensor – test and assessment for architectural and cultural heritage.” Heritage 6(2), 1476–1501. 10.3390/heritage6020080.Search in Google Scholar
Wingfield, S., A. Martínez-Moscoso, D. Quiroga, and V. Ochoa-Herrera. 2021. “Challenges to water management in Ecuador: Legal authorization, quality parameters, and socio-political responses.” Water 13(8), 1017. 10.3390/w13081017.Search in Google Scholar
Yasin, M., A. Shahzad, N. Abbasi, U. Ijaz, and Z. Khattak. 2017. “The use of stratigraphic section in recording quagmire of information for the fluvial depositional environment – A worked example in District Poonch, Azad Jammu and Kashmir, Pakistan.” Pakistan Journal of Geology. 1(2), 1–2. 10.26480/pjg.02.2017.01.02.Search in Google Scholar
Zhang, T., J. Abu-Hani, and S. Filin. 2022. “Shape preserving noise attenuation model for 3-D-modeling of heritage sites by portable laser scans.” The International Archives of the Photogrammetry Remote Sensing and Spatial Information Sciences 46, 551–6. 10.5194/isprs-archives-xlvi-2-w1-2022-551-2022.Search in Google Scholar
© 2024 the author(s), published by De Gruyter
This work is licensed under the Creative Commons Attribution 4.0 International License.
Articles in the same Issue
- Research Articles
- Displacement analysis of the October 30, 2020 (Mw = 6.9), Samos (Aegean Sea) earthquake
- Effect of satellite availability and time delay of corrections on position accuracy of differential NavIC
- Estimating the slip rate in the North Tabriz Fault using focal mechanism data and GPS velocity field
- On initial data in adjustments of the geometric levelling networks (on the mean of paired observations)
- Simulating VLBI observations to BeiDou and Galileo satellites in L-band for frame ties
- GNSS-IR soil moisture estimation using deep learning with Bayesian optimization for hyperparameter tuning
- Characterization of the precision of PPP solutions as a function of latitude and session length
- Possible impact of construction activities around a permanent GNSS station – A time series analysis
- Integrating lidar technology in artisanal and small-scale mining: A comparative study of iPad Pro LiDAR sensor and traditional surveying methods in Ecuador’s artisanal gold mine
- On the topographic bias by harmonic continuation of the geopotential for a spherical sea-level approximation
- Lever arm measurement precision and its impact on exterior orientation parameters in GNSS/IMU integration
- Book Review
- Willi Freeden, M. Zuhair Nashed: Recovery methodologies: Regularization and sampling
- Short Notes
- The exact implementation of a spherical harmonic model for gravimetric quantities
- Special Issue: Nordic Geodetic Commission – NKG 2022 - Part II
- A field test of compact active transponders for InSAR geodesy
- GNSS interference monitoring and detection based on the Swedish CORS network SWEPOS
- Special Issue: 2021 SIRGAS Symposium (Guest Editors: Dr. Maria Virginia Mackern) - Part III
- Geodetic innovation in Chilean mining: The evolution from static to kinematic reference frame in seismic zones