A field test of compact active transponders for InSAR geodesy
-
 ,
,

Abstract
Compact active transponders (CATs) – also termed electronic corner reflectors – are compact electronic devices designed to receive, actively amplify and re-transmit a radar signal, e.g. a C-band radar signal received from a Sentinel-1 satellite. CATs can potentially be useful for a number of purposes, e.g. if co-located with geodetic infrastructure. However, CATs have only recently become commercially available, and therefore, the usability and long-term performance of CATs are not well known. In this study, two CATs are tested under realistic operating conditions for a period of 14 months, from July 2020 to September 2021. The displacement time series of the CATs are determined from a persistent scatterers interferometric synthetic aperture radar processing of four tracks of Sentinel-1A/-1B data with a passive corner reflector (CR) as the spatial reference. The displacement time series of the CATs are evaluated against a ground truth established from repeated levellings between the CR and the CATs. Based on the results of this study, it is found that a sudden vertical displacement of a CAT can be determined with an accuracy better than 1 cm, possibly a few millimetres. Furthermore, it is found that the mean vertical velocity of a CAT, calculated from 14 months of interferometric synthetic aperture radar displacement time series, can be determined with an accuracy of a few mm/year. Finally, the line of sight (LoS) phase error is generally found to be moderately correlated with temperature, with an instrument-specific linear relationship between LoS error and temperature ranging between approx. 0.1 and 0.2 mm/°C. This correlation between LoS phase error and temperature can in principle be used for instrument-specific calibrations, which is a topic that should be addressed in future studies.
1 Introduction
Interferometric synthetic aperture radar (InSAR) and persistent scatterer interferometry (PSI) are important and well-established remote sensing techniques used for the mapping of a wide range of natural and anthropogenic deformation phenomena occurring on the surface of Earth (Ferretti et al., 2000; Frei, 2017). The evolution of InSAR towards a well-established and widely used technique for deformation mapping has undoubtedly been stimulated by recent advances in relation to the quality and accessibility of synthetic aperture radar (SAR) data. Thus, an important milestone in relation to the uptake of InSAR is the 2014 launch of the Sentinel-1 satellite mission under the Copernicus Programme. An essential aspect of this mission is the design parameters and data policy offering high spatial and temporal resolution C-band SAR data, fully free and open (Torres et al., 2012). Another important milestone – at least in a European context – is the 2022 launch of the European Ground Motion Service (EGMS) under the Copernicus Programme. Thus, following the launch of EGMS, pan-European deformation maps based on Sentinel-1 data are available fully free and open (Crosetto et al., 2020; Costantini et al., 2021).
Following the increased uptake of InSAR data, a corresponding increase in the use of artificial radar reflectors for PSI C- and X-band InSAR has taken place in the past few years. It is thus estimated that by the end of 2022, >100 artificial radar reflectors have been installed in Denmark alone (K. Vognsen, Geopartner Inspections, Denmark, personal communication). The vast majority of these are corner reflectors (CRs), passively reflecting the received radar signal, whereas only a small minority are compact active transponders (CATs) – also termed electronic corner reflectors – actively amplifying and re-transmitting the received radar signal. This is due to the simple fact that CRs have been in use for many years and can be considered well-known and well-tested devices. In contrast, CATs have only recently become commercially available and thus are less well-known and less tested.
Accordingly, a large number of field tests investigating various aspects of usability and performance of CRs have been reported in the literature in the past years – see, e.g. (Ferretti et al., 2007; Marinkovic et al., 2007 and Qin and Perissin, 2015) – whereas only a relatively small number of field tests involving CATs have been reported so far, e.g. (Luzi et al., 2021, Czikhardt et al., 2022; Gruber et al., 2020 and Gruber et al., 2022). Thus, the usability and performance of CATs require further investigation. That is addressed in this respective study.
The overall purpose of the field test reported in this article is to: a) test the performance of two CATs when used for Sentinel-1 InSAR-based deformation monitoring and operating under realistic conditions and b) assess the potential of co-locating the CATs with geodetic infrastructure. The overall purpose of the field test was met, but further testing and investigation of the encountered problems are needed.
This article is organized in the following sections: this introduction, followed by a discussion and overview of the potential benefits of co-locating artificial radar reflectors for InSAR with geodetic infrastructure (Section 2). The scope of this discussion and overview is the potential benefits of InSAR displacement time series of artificial radar reflectors – in particular of the CAT type – co-located with geodetic infrastructure. Then follows a description of the field test (Section 3), the artificial radar reflectors deployed (Section 4), InSAR acquisition and processing (Section 5) and levelling surveys (Section 6). Then follows a documentation of the achieved results (Section 7) and a discussion and comparison of the achieved results with those of other similar studies (Section 8). Finally, conclusions on the performance of the CATs are drawn (Section 9).
2 The potential benefits of co-locating artificial radar reflectors for InSAR with geodetic infrastructure
InSAR-based deformation maps covering large geographical areas such as nation-wide deformation maps are often calibrated with external velocity data stemming from Global Navigation Satellite Systems (GNSS). This is done to refer the inherently relative InSAR deformation estimates to the “absolute” geodetic reference frame of GNSS, as well as to introduce into the deformation maps long-wavelength deformation phenomena usually obscured by troposphere delay error (Roukounakis et al., 2021). External GNSS data used for the calibration of InSAR are usually in the form of time series from a number of individual GNSS stations (Farolfi et al., 2019). In that case, the calibration requires a tie between InSAR and the GNSS stations, which gives rise to the problem of how this can optimally be established. InSAR–GNSS ties can either be established following an opportunistic approach using InSAR displacement time series of naturally occurring persistent scatterers (PSs) near the GNSS stations or – at least in principle – they can be established using InSAR displacement time series of purpose-build artificial radar reflectors co-located with GNSS stations.
The establishment of InSAR–GNSS ties based on naturally occurring PSs relies on the fact that the latter are stable relative to the nearby GNSS station, which is not necessarily the case (Puggaard and Meister, 2022). Therefore, the potential major advantage of artificial radar reflectors is that they can serve as well-defined radar targets that can be installed onto or close to the GNSS stations to be used for the calibration of InSAR. However, if an artificial radar reflector of the CR type is installed directly onto a GNSS station, there is – at least in theory – a risk that the large metal surfaces of the CR can cause GNSS signal multipath, negatively affecting the GNSS observations. So far, there are few published studies investigating whether this is a real problem or not, although according to Fuhrmann et al. (2021), the multipath effect is negligible even if the CR is installed directly below the GNSS antenna. In any case, a CAT – due to its smaller size and weight and the absence of large metal surfaces – can more easily be mounted directly onto the same structure as the GNSS antenna. Additionally, in a recent study by Olsen (unpublished data), CATs co-located with GNSS were found not to affect the GNSS observations negatively. Therefore, the potential major advantage of CATs over CRs is that any relative motion between radar reflectors and GNSS stations that could otherwise degrade the accuracy of the InSAR–GNSS ties can in principle be eliminated.
The calibration of InSAR need not necessarily rely on time series from individual GNSS stations. Instead, it can rely on a velocity model derived from a network of GNSS stations (Costantini et al., 2021) or on a geophysical deformation model derived not only from GNSS but also potentially from all relevant geodetic observation techniques, as well as an – so to speak – “a priori” geophysical knowledge about the nature of the deformation signal to be modelled. However, even in these cases, it may still be relevant to install CATs on individual GNSS stations, as doing so can facilitate the quality control of calibrated InSAR-based deformation maps.
The potential use of artificial radar reflectors is, however, not limited to the calibration or quality control of InSAR-based deformation maps. Artificial radar reflectors can in principle be deployed in any situation in which there is a need to monitor the stability of a surface or structure not by itself acting as a PS – at least as long as the surrounding level of clutter is not too high. In operational geodesy, the physical stability of geodetic instruments is often an important concern. This applies, for example, to the operation of national geodetic infrastructures, such as networks of GNSS stations or tide gauges. Traditionally, the relative stability of such infrastructures is monitored with levelling, which is labour-intensive and expensive. However, the use of artificial radar reflectors and InSAR displacement time series potentially represent a less resource-demanding alternative and, furthermore, allow stability to be monitored much more frequently than with levelling. That is especially the case if artificial radar reflectors of the CAT type are installed directly onto the geodetic infrastructures to be monitored, because then the use of levelling can in principle be completely avoided.
In summary, the co-location of CATs with geodetic infrastructure could potentially be useful for a range of purposes. However, because the exploitation and exploration of CATs within the geodetic community has only begun in recent years, it is important to add that the investigation of these potentials is in an early phase with only limited documentation of actual benefits so far. This further emphasizes the relevance of field testing of CATs under realistic operation conditions.
3 The field test
The field test was facilitated by a test setup established at the GNSS station HABY – a class A GNSS station located in a rural, mostly unbuilt area in western Zealand, Denmark, cf. Figure 1. The established test setup consisted of three artificial reflectors – two CATs identified as CAT1 and CAT2, respectively, and one CR identified as CR1. The three artificial reflectors were arranged in an almost straight line, at least 60 m apart so that each reflector would be located in its own Sentinel-1 radar resolution cell, cf. Figure 2. A third CAT was also installed at the test site. However, this CAT was later discovered to be suffering from a weak or disappearing return signal and, consequently, was excluded from the present study.
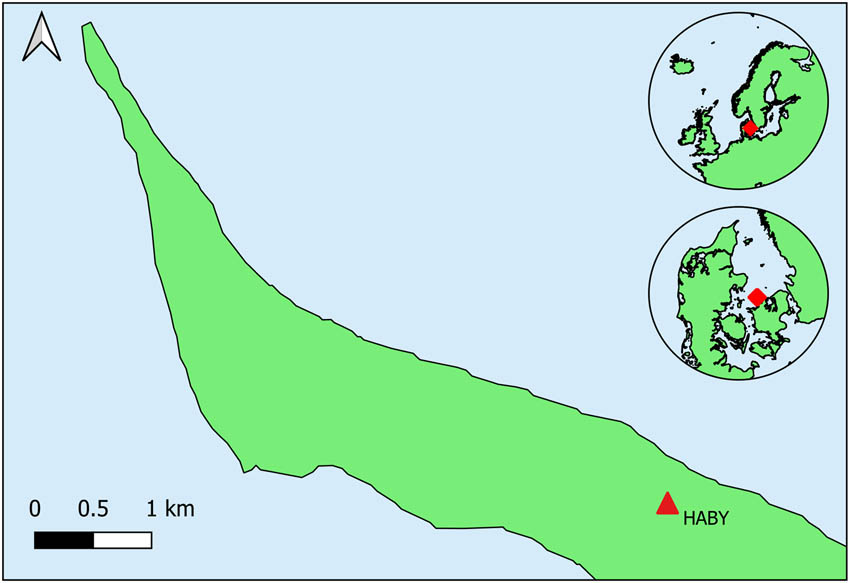
Geographical location of the test setup and HABY GNSS station (55.9718°N, 11.3553°E). Map downloaded from www.eea.europa.eu.
![Figure 2
Left: an overview of the test setup and surrounding area. Top right: median level of radar backscatter coefficient σ
0 [dB] before any artificial radar reflectors were installed (July 2018). Bottom right: median level of radar backscatter coefficient σ
0 [dB] after installation of artificial radar reflectors (July 2020). The third CAT, which was excluded from the study, is visible as a backscatter between CAT1 and CAT2. Orthophoto by the Agency for Data Supply and Infrastructure.](/document/doi/10.1515/jogs-2022-0164/asset/graphic/j_jogs-2022-0164_fig_002.jpg)
Left: an overview of the test setup and surrounding area. Top right: median level of radar backscatter coefficient σ 0 [dB] before any artificial radar reflectors were installed (July 2018). Bottom right: median level of radar backscatter coefficient σ 0 [dB] after installation of artificial radar reflectors (July 2020). The third CAT, which was excluded from the study, is visible as a backscatter between CAT1 and CAT2. Orthophoto by the Agency for Data Supply and Infrastructure.
Before the artificial reflectors were installed, the surrounding level of radar backscatter was analysed. This was done using monthly median values of the backscatter coefficient calculated using Google Earth Engine (Gorelick et al., 2017), cf. Figure 2. Thus, the July 2018 median values of the backscatter coefficient were found to be approx. −15 dB at the sites of CR1 and CAT2, and between approx. −11 and 2 dB at CAT1. The relatively high backscatter coefficient at CAT1 was most likely due to the HABY GNSS station as well as several containers located approx. 25–50 m south of the GNSS station. Thus, the two CATs were tested under different levels of backscatter: CAT2 under ideal conditions and CAT1 under less ideal but arguably more realistic conditions.
CAT2 as well as CR1 were mounted on custom-made platforms, each supported by three torsional plugs extending approx. 2.5 m below the surface, thus ensuring the high stability of the reflectors, cf. Figures 3 and 4. CAT1 was mounted on a custom-made platform fixated to the foundation of HABY GNSS station, thus being tested under conditions exactly corresponding to the intended application as an InSAR–GNSS tie, cf. Figure 3.

Left: CAT1 on the foundation of the HABY GNSS station. Middle: CAT1 and HABY GNSS station. Right: CAT2.

CR1.
The field test was carried out from July 2020 to September 2021, thus spanning more than a full seasonal cycle. CR1 and CAT1 were kept stable throughout the field test, whereas CAT2 was subjected three times to a manual (i.e. intentional) vertical displacement in the range +/− 0–2 cm, cf. Table 1. Of these displacements, the third and smallest displacement with a size of approx. +1 mm was specifically intended to test whether a displacement of that size could be detected by InSAR.
Date and size of manual, vertical displacements of CAT2
| CAT2 – Manual displacements | |
|---|---|
| Date | Size (mm) |
| 15 September 2020 (2020.705) | −3.9 |
| 24 February 2021 (2021.146) | −14.4 |
| 13 July 2021 (2021.533) | +1.1 |
The line of sight (LoS) displacements of CAT1 and CAT2 were derived from a multi-temporal persistent scatterer interferometric synthetic aperture radar (PSInSAR) processing with CR1 as the spatial reference. This InSAR processing was carried out on four ground tracks of Sentinel-1A/-1B data (T44A, T146A, T66D and T168D). The LoS displacements thus determined were decomposed into the 2D East and Up components, yielding estimates of the East and Up displacements of CAT1 and CAT2 relative to CR1.
In order to evaluate the accuracy of these LoS and 2D displacements, it is necessary to have some external/independent observations from which the actual displacements – the ground truth – can be established. Thus, a precise levelling survey was carried out approx. every third month from January 2020 to September 2022, as well as immediately before and after each manual displacement of CAT2. Based on these levelling surveys, it will be possible to accurately establish a ground truth with respect to the vertical. In principle, it is also possible to establish a ground truth by means of GNSS. However, as CAT1 is the only radar reflector co-located with a GNSS station, only the “absolute” displacements of CAT1 in the geodetic reference frame of GNSS can be derived – not the relative displacements between CAT1 and the other radar reflectors of the test setup. For this reason, the ground truth will be determined solely from repeated levelling surveys.
4 Artificial radar reflectors
4.1 CAT1 and CAT2
The two CATs being tested are produced by MetaSensing and designed to receive, amplify and re-transmit C-band radar signals of both ascending and descending satellite geometry. CAT1 (serial no. 123) and CAT2 (serial no. 134) are identical in terms of type and design. Each CAT is equipped with two pairs of dual-polarization antennas, i.e. one antenna pair for each satellite geometry, each consisting of one receive and one transmit antenna. By the manufacturer, the antenna orientations are adjusted to an azimuth squint of 11° (south-bound from the East–West direction) and an elevation tilt from zenith of 32°. This antenna orientation approximately corresponds to the average Sentinel-1 LoS geometry as observed from the location of the test site. The CATs, including antennas, are covered by a protective PVC radome transparent to C-band radar and are powered by AC mains.
Prior to installation, the CATs were configured for V polarization (only one polarization is possible at a time) and programmed to activate at the time of Sentinel-1A/-1B satellite overpasses.
For the basic specifications of CAT1 and CAT2, refer to Table 2. For a more thorough technical description of this type and design of CAT, refer to the study by Czikhardt et al. (2022).
Basic specifications of CATs according to the manufacturer (Meo et al., 2019)
| Dimensions (W × L × H) | 0.360 m × 0.570 m × 0.233 m |
| Weight | 10.2 kg (excluding custom-made platform) |
| Radar cross-section (RCS) | 31.8 dBm2 |
4.2 CR1
CR1 is a double square trihedral CR (the so-called MUSE-design; Quin and Loreaux, 2013) equally well-suited for ascending and descending geometries. For the basic specifications of CR1, refer to Table 3. The theoretical peak RCS given in Table 3 has been calculated based on the relevant formula in the study by Doerry (2008).
Basic specifications of CR1
| Inner leg length of square trihedral | 0.650 m |
| Weight | 31 kg (excluding custom-made platform) |
| RCS | 33 dBm2 |
CRs of a design similar to CR1 have previously been deployed and successfully tested at two separate test setups in northwest Jutland, Denmark (Balasis-Levinsen et al., 2019).
5 InSAR acquisition and processing
The InSAR processing included a total of 278 Sentinel-1 images covering the period from 2 July 2020 to 1 September 2021, cf. Figure 5. Data from each ground track were processed with the PSInSAR method described in the study by Ferretti et al. (2000) and implemented in the commercial SARPROZ© software. An Amplitude Dispersion Index of 0.3 was used for the selection of the persistent scatterer candidates (PSCs) in the area of interest, and the PSCs with the highest average intensity located in a neighbourhood of the expected point target positions were selected. Each resulting LoS time series for the CAT1 and CAT2 PSCs was spatially referenced to CR1. This spatial referencing also effectively removes the effects of atmospheric propagation errors in the subsequent time series analysis, since the errors affecting CR1 and the CATs are highly correlated, due to their proximity. The East and Up displacement time series in a local Cartesian system were obtained by resampling the LoS time series of each ascending and descending track to a common temporal grid, namely that of descending track 66, and solving a least squares system of four equations in two unknowns, assuming the northward motion component to be zero (Merryman Boncori, 2019).

Temporal distribution of the processed Sentinel-1 radar images.
6 Precise levelling
All levelling surveys were carried out as geometric precise levelling in accordance with guidelines established by the Nordic Geodetic Commission (Becker and Andersen, 1986). Furthermore, in order to minimize the effects of both random and systematic errors, each levelling survey consisted of four repeated levelling runs, each interconnecting the three artificial radar reflectors of the test setup.
Each levelling survey underwent a least squares adjustment using GNU Gama – a software package dedicated to the adjustment and quality control of geodetic survey networks (Čepek, 2022). All levelling adjustments were carried out with a fixed height of CR1, thus yielding vertical displacement time series of CAT1 and CAT2 relative to CR1.
7 Results
The LoS displacement time series of CAT1 and CAT2 are plotted in Figure 6, while the corresponding 2D East and Up displacement time series (i.e. East and Up components time series) are plotted in Figures 7 and 8. The 2D Up displacement time series are plotted against the model of ground truth (Figure 8, top left and right), as well as with the manual displacements, cf. Table 1, subtracted (Figure 8, bottom left and right).
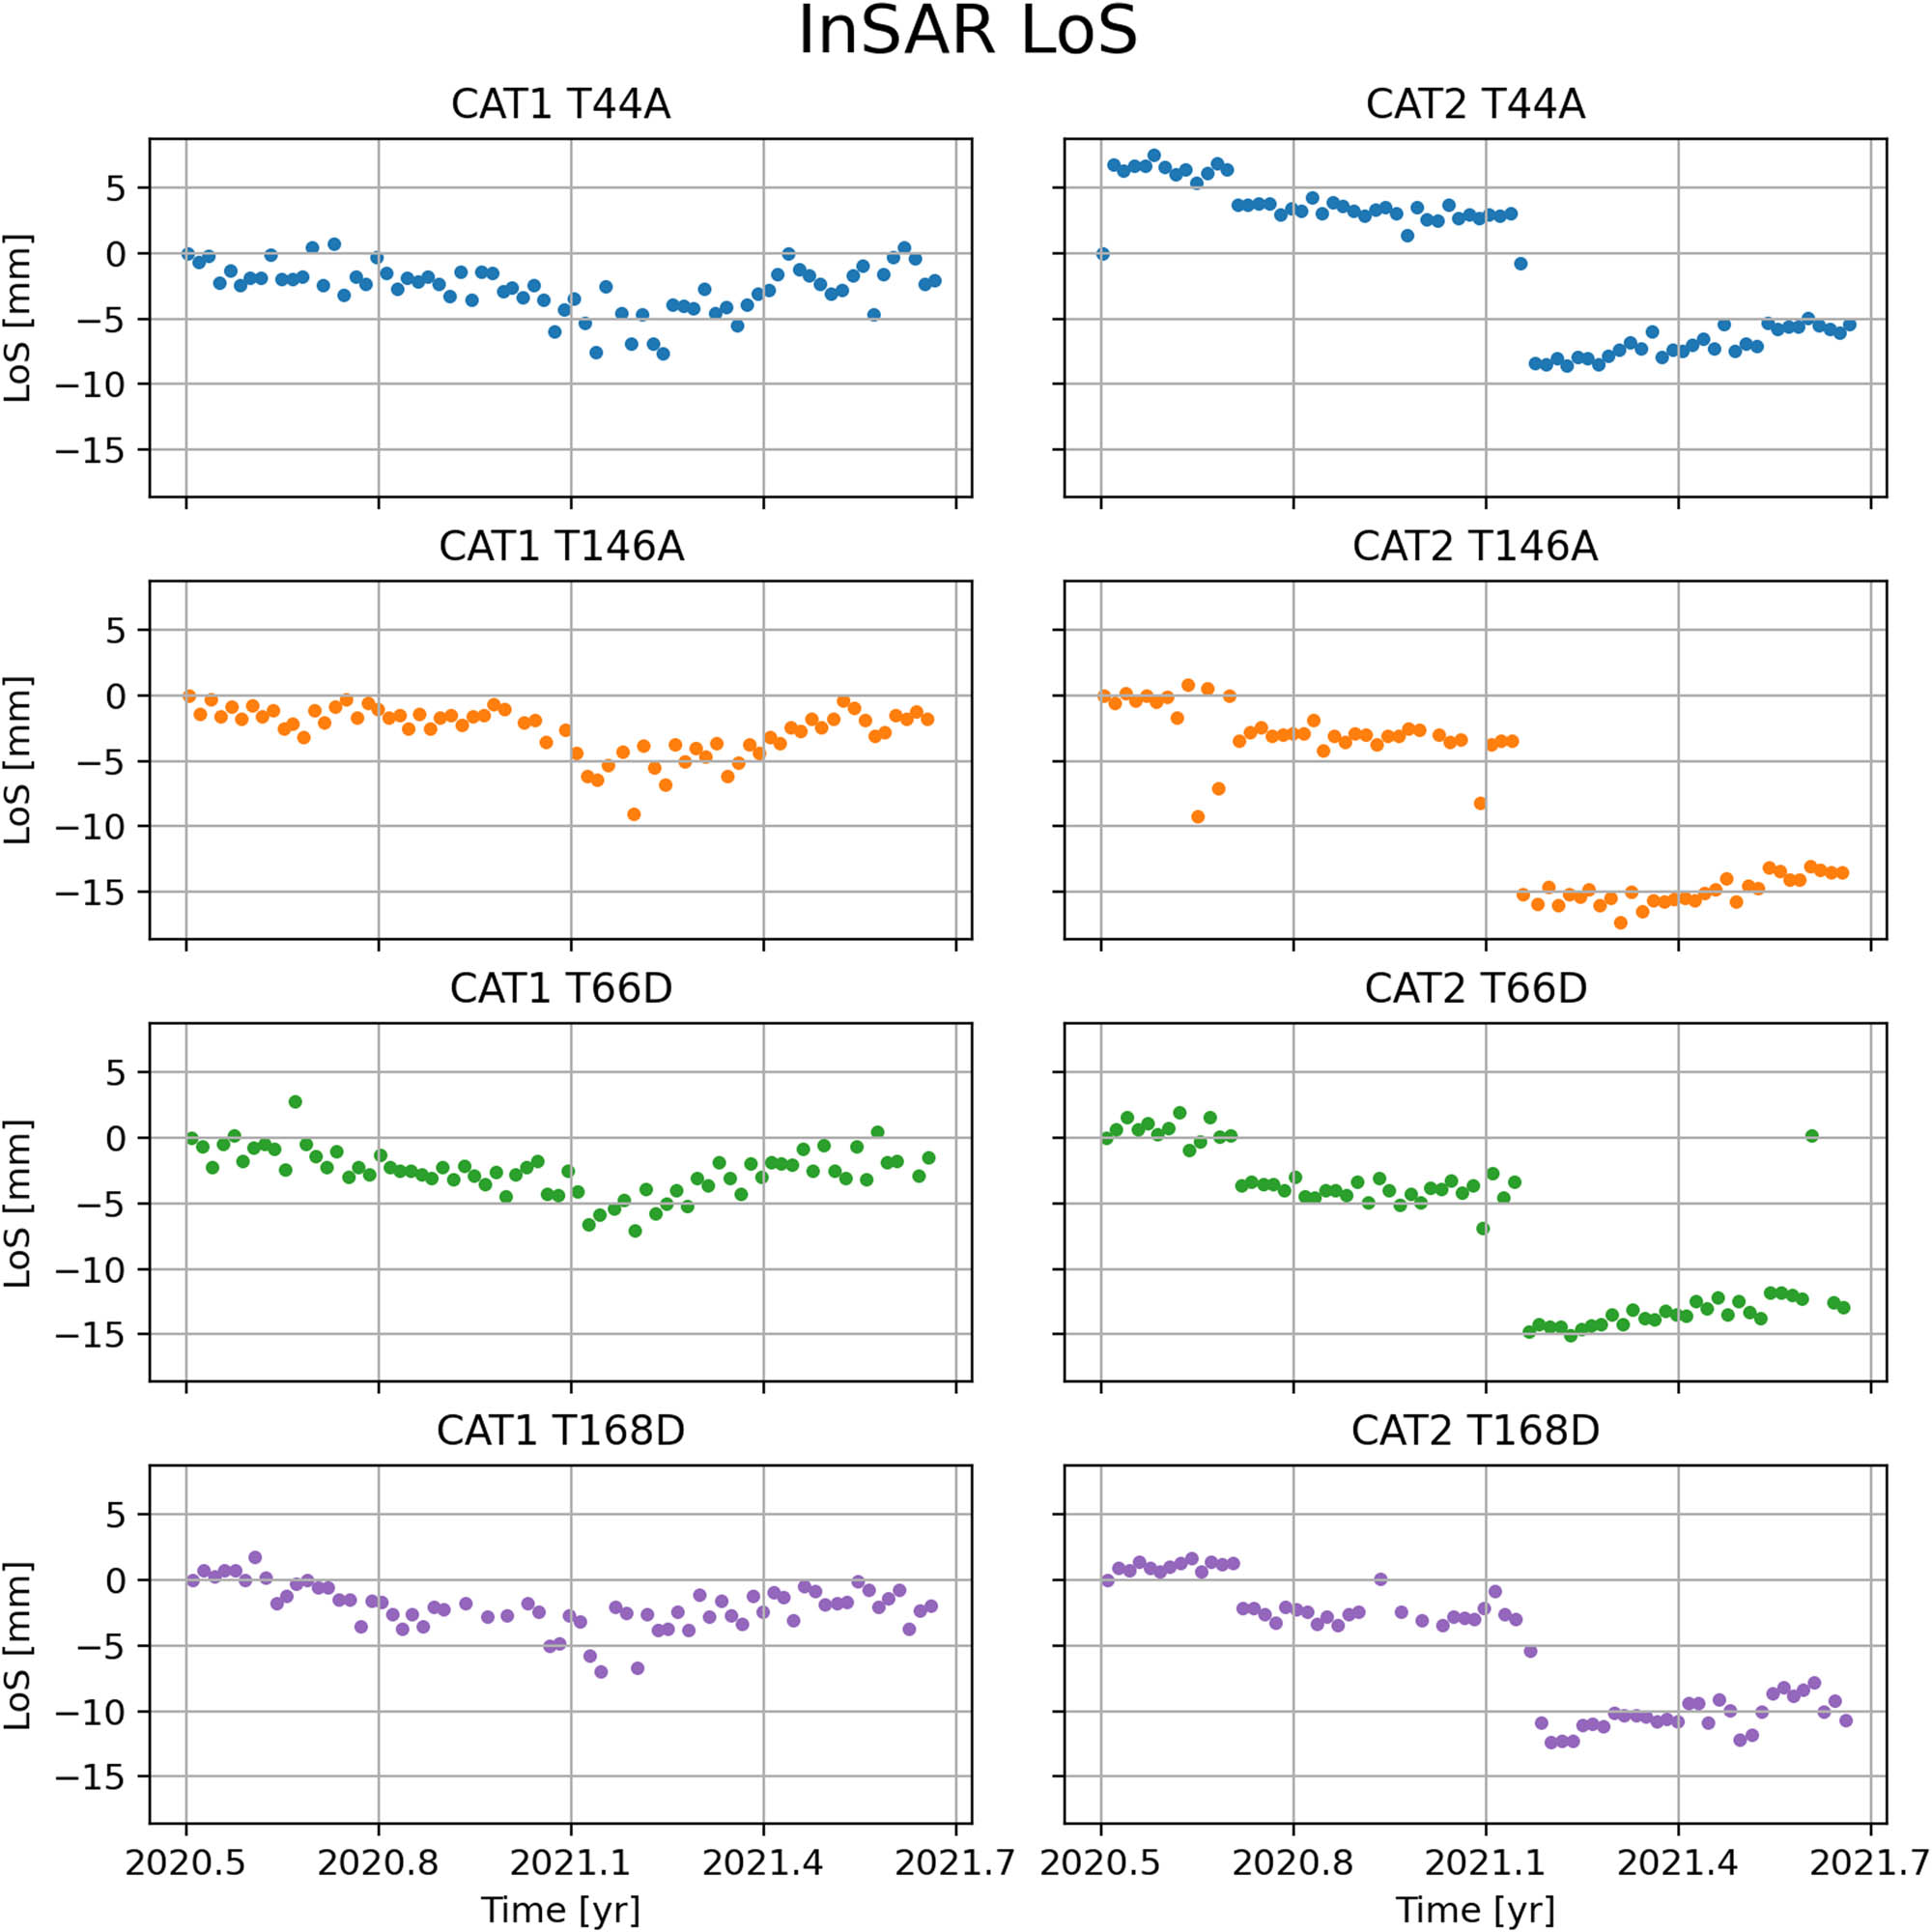
InSAR LoS displacement time series of CAT1 and CAT2.
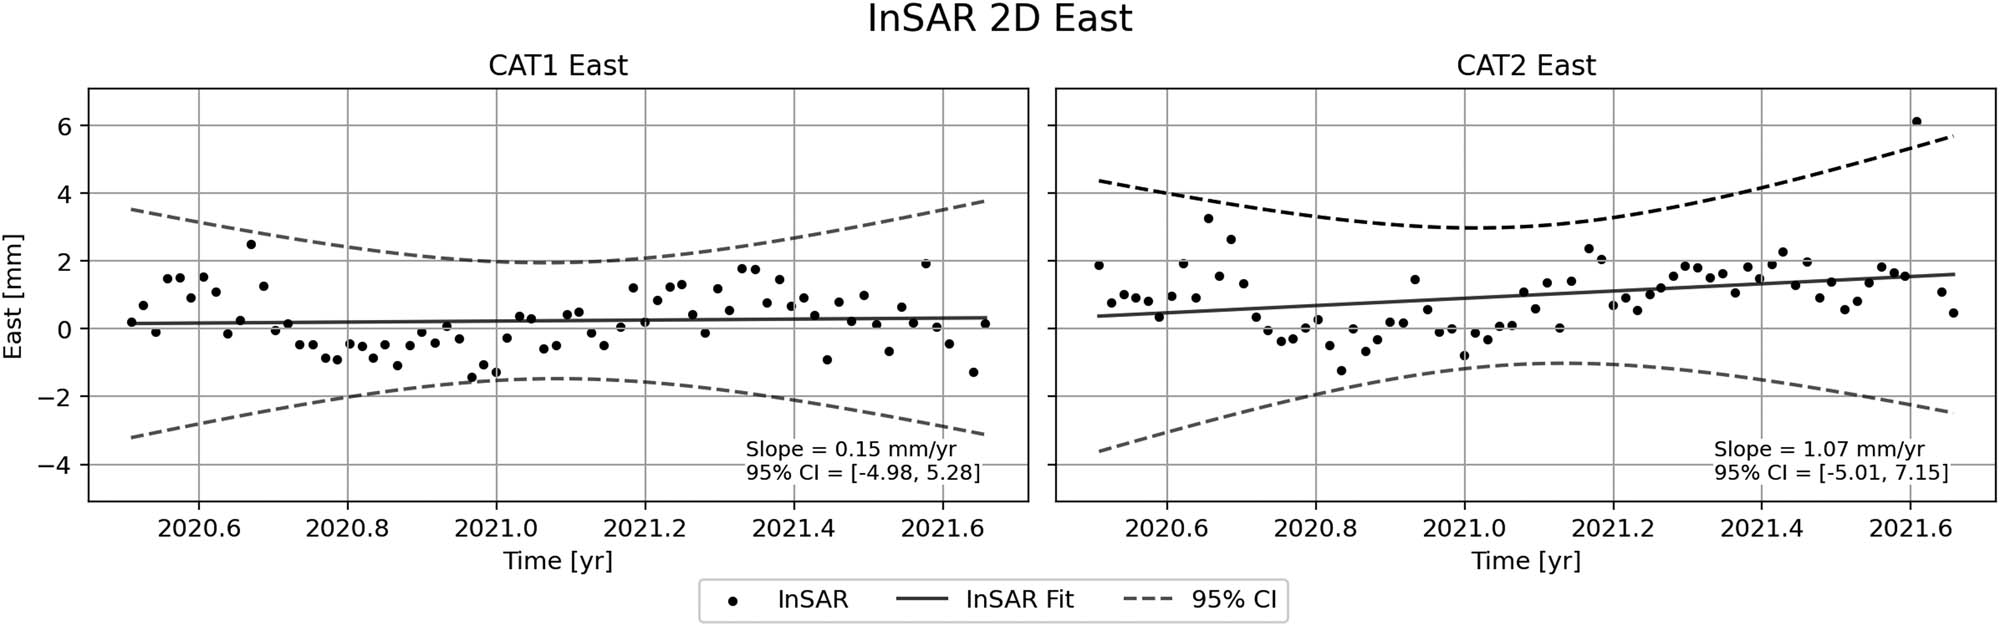
InSAR 2D East displacement time series of CAT1 and CAT2.

InSAR 2D Up displacement time series of CAT1 and CAT2.
The ground truth is modelled as follows: for CAT1, a linear fit is determined from the levelling time series, cf. Figure 8, bottom left. For CAT2, the manual displacements as determined by the differences in levelled heights before and after each manual displacement are subtracted from the levelling time series, and a linear fit is determined, cf. Figure 8, bottom right. Finally, the manual displacements are re-added to the linear fit of CAT2. The ground truth is determined with an accuracy of approx. 1 mm, cf. the 95% confidence bands for the ground truth models of CAT1 and CAT2 depicted in Figure 8, bottom left and right.
If the 2D Up time series of CAT2 is compared with the ground truth, a level of agreement within a few millimetres is found. Thus, the first and second manual vertical displacements of CAT2 are easily resolved, whereas the third and smallest displacement, cf. Table 1, cannot be unambiguously detected from the 2D Up time series. This indicates that a sudden displacement of a CAT in the range of 1–2 cm can be determined with an accuracy of a few millimetres. However, if the 2D Up time series of CAT1, which was not subjected to any displacements, is compared with the ground truth, a deviation up to approx. 7 mm is found. Based on the accuracy with which the ground truth is determined, any actual displacements of CAT1 relative to CR1 as an explanation for this 7 mm deviation can be ruled out. In addition, the time series of GNSS station HABY – onto which CAT1 is installed – has been examined, and indeed, no displacement signal resembling the 2D Up time series is found in the GNSS time series (Khan and Kolster, unpublished data).
From each 2D East and Up displacement time series, a linear fit is determined (in the case of CAT2 Up after the manual displacements have been subtracted), cf. Figures 7 and 8, bottom left and right. Thus, for the Up displacement time series of CAT1 and CAT2, slopes corresponding to mean vertical velocities of −1.83 and 2.05 mm/year, respectively, are found. For CAT1, the estimated velocity is approx. 1.9 mm/year below the ground truth value, and for CAT2, approx. 1.2 mm/year above the ground truth value. However, none of the linear fits determined from the InSAR 2D East and Up time series have a slope that is significantly different from zero (at a 5% significance level). Furthermore, neither of the linear fits determined from the levelling time series have a slope that is significantly different from zero (at a 5% significance level). In that sense, an overall agreement between the InSAR 2D time series and the ground truth has been found.
7.1 Phase error and temperature correlation
The LoS displacement time series of CAT1 all seem to exhibit some degree of seasonality in the sense that all have a slight minimum at the beginning of 2021, cf. Figure 6. In order to examine if this pattern is due to seasonal temperature variations, the LoS time series of CAT1 and CAT2 are plotted against air temperature, cf. Figure 9. The plotted temperature is the meteorological air temperature measured by the Danish Meteorological Institute at weather station Gniben 6 km northeast of the test site (Online: https://confluence.govcloud.dk/display/FDAPI/Climate + data/ [accessed on 12 December 2022]). The plotted LoS time series are time series with the ground truth removed, i.e. the ground truth has been projected to LoS and then subtracted from the time series. After the removal of the ground truth, the time series have been filtered using a simple algorithm, removing data points lying outside the mean ±2 times the empirical standard deviation. Since the baselines between CR1 and CAT1 resp. CAT2 are very short (<200 m), troposphere delay errors can be neglected. Therefore, the LoS time series of Figure 9 can be regarded as the time series of the LoS phase error due to CAT phase error and surrounding backscatter.

InSAR LoS time series of CAT1 and CAT2 plotted against temperature.
From Figure 9, it is evident that some degree of correlation exists between the LoS time series and air temperature. To investigate this further, the LoS error is plotted as a function of temperature, and a linear fit including the Pearson correlation coefficient is determined, cf. Figure 10. Thus, the CAT1 LoS error is found to be moderately correlated with temperature on all tracks. The CAT2 LoS error is found to be moderately correlated with temperature on tracks T44A and T66D and weakly correlated on tracks T146A and T168D. The test site is positioned in the mid-range of tracks T44A and T66D, in the near range of T146A and in the far range of T168D. For both CATs, the weakest correlations are found on T146A and T168D. However, it is unknown if this is a mere coincidence or if it is in fact because errors unrelated to temperature are more dominant in the near and far range.

InSAR LoS error of CAT1 and CAT2 as a function of temperature.
As for the actual linear relationship between LoS error and temperature, varying results are obtained for CAT1 and CAT2. For CAT1, rather uniform results are found across tracks with a linear relationship varying between 0.15 and 0.19 mm/°C and a LoS error at 0°C varying between −5.16 and −5.29 mm. For CAT2, the results are less uniform, with a linear relationship varying between 0.04 and 0.13 mm/°C and a LoS error at 0°C varying between −0.41 and −1.91 mm.
Similar results are found for the 2D Up component time series, cf. Figures 11 and 12: the CAT1 Up error is moderately to strongly correlated with temperature, while the CAT2 Up error is weakly to moderately correlated with temperature. The linear relationship between Up error and temperature varies between 0.17 mm/°C for CAT1 and 0.07 mm/°C for CAT2. The Up error at 0°C varies between −5.16 mm for CAT1 and −1.20 mm for CAT2.

InSAR 2D Up time series of CAT1 and CAT2 plotted against temperature.
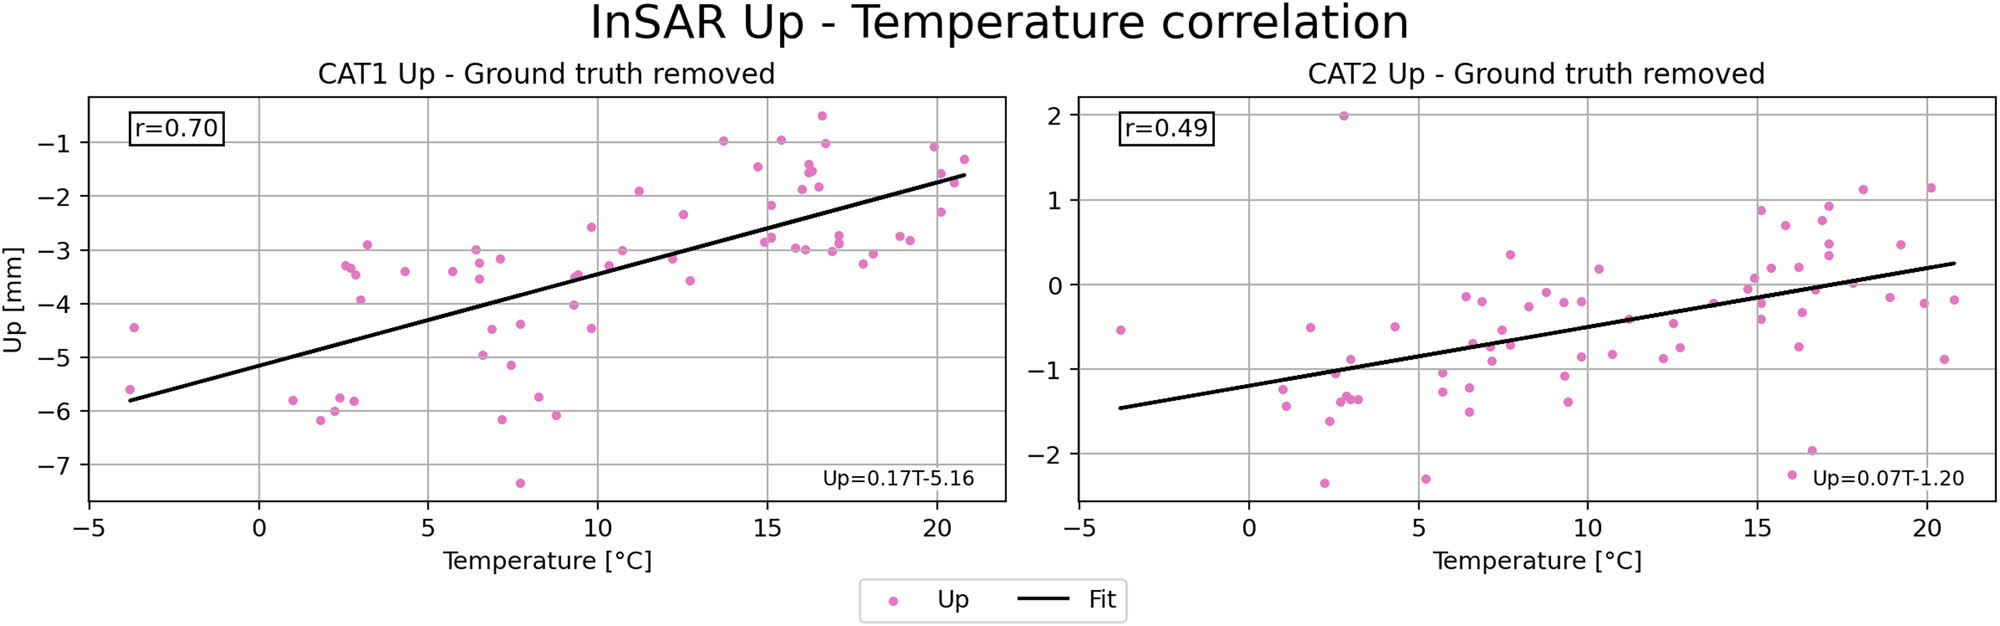
InSAR 2D Up error of CAT1 and CAT2 as a function of temperature.
8 Discussion
To the authors’ knowledge, no other published studies are directly comparable to the present study in the sense that no other studies examine the accuracy with which either a sudden vertical displacement or the mean vertical velocity of a CAT can be determined. However, in studies by Czikhardt et al. (2022) and Luzi et al. (2021), the relation between LoS phase error and temperature is examined.
In the study by Czikhardt et al. (2022), a field test involving two CATs of the same type and design as the CATs tested in the present study is evaluated for a period of up to 21 months. In that study, the LoS phase error was generally found to be moderately correlated with temperature, with an instrument-specific linear relationship between LoS error and temperature ranging between 0.07 and 0.15 mm/°C.
In the study by Luzi et al. (2021), a field test involving a prototype of a deliberately simple, low-cost CAT is evaluated for a period of 11 months. In that study, the LoS phase error was found to be strongly correlated with temperature, with a reported correlation coefficient of 0.8 and a linear relationship between LoS error and temperature of approx. −0.4 mm/°C.
The studies by Czikhardt et al. (2022) and Luzi et al. (2021) are comparable to the present study in the sense that the temperature correlation is determined for roughly the same temperature interval (approx. 0–25°C), and – as it appears from the above – especially between Czikhardt et al. (2022) and the present study, a good overall agreement is found. A possible explanation for the relatively strong temperature correlation found in the study by Luzi et al. (2021) may be the less mature and deliberately simple design of the CAT tested in that study.
The fact that LoS phase error is correlated with temperature can – at least in part – be explained by a temperature-dependent behaviour of the active radio frequency components of the CAT (Raab et al., 2016). The impact hereof can be minimized by integrating into the CAT an active temperature management system that maintains the internal temperature of the CAT within certain limits regardless of variations in the ambient temperature, cf. (Raab et al., 2016). However, such a system adds to the complexity and cost of a CAT, and therefore – at least in principle – a more desirable approach would be to perform instrument-specific calibrations of the measured LoS phase using the parameters of the linear models depicted in Figure 10 as calibration parameters. Indeed, this approach has already been implemented by Czikhardt et al. (2022) and Luzi et al. (2021). However, the practical benefit of instrument-specific calibrations depends on the time variability characteristics of the calibration parameters, which can only be determined from longer studies collecting data over several years.
As for the potential benefits of co-locating CATs with geodetic infrastructure, e.g. for the calibration of InSAR-based deformation maps or for the stability monitoring of geodetic infrastructure, more accurate displacement times and mean velocity estimates than found in this study are generally needed. However, in most use cases, the co-localization of CATs with geodetic infrastructure presupposes time series much longer than 14 months. That is, e.g. the case for stability monitoring of geodetic infrastructure, where the relevant time frame can be tens of years. It is possible that longer time series corrected for instrument-specific temperature dependencies could significantly improve the achievable accuracy. However, this can only be affirmed by longer studies collecting data over several years.
9 Conclusions
In this study, a field test of two CATs was evaluated by comparison with repeated levelling. Based on the results of the field test, it is found that a sudden vertical displacement of a CAT can be determined by InSAR with an accuracy better than 1 cm, possibly a few millimetres. Furthermore, it is found that the mean vertical velocity of a CAT, calculated from 14 months of InSAR displacement time series, can be determined with an accuracy of a few mm/year. Finally, the LoS phase error is generally found to be moderately correlated with temperature, with an instrument-specific linear relationship between LoS error and temperature ranging between approx. 0.1 and 0.2 mm/°C and an instrument-specific LoS error at 0°C ranging between approx. −5 and −1 mm.
Acknowledgements
The authors would like to thank Erik Lysdal, Palle Nielsen, Rene Andsbjerg, Jacob Nors and Niels Veirum for carrying out levelling surveys and adjustments of vital importance to this study. Furthermore, the authors would like to thank Lars Hole for assistance in setting up the artificial reflectors and Henrik Olsen for his endless work servicing the CATs.
-
Conflict of interest: Authors state no conflict of interest.
-
Disclaimer: All contributions by J. Balasis-Levinsen to the work presented in this article were made while working at the Agency for Data Supply and Infrastructure. The views expressed in this article are solely those of the individual authors, and the content does not necessarily represent the views or position of the European Environment Agency.
References
Balasis-Levinsen, J., K. Keller, M. Nissen, and A. Meister. 2019. “Exploiting copernicus data: Linking InSAR-based deformation monitoring with the national geodetic infrastructure in denmark.” Poster, AGU Fall Meeting 2019.Search in Google Scholar
Becker, J. M. and O. B. Andersen. 1986. “Guidelines for Motorized 1. Order Precise Levelling.” Proceedings of the 10th General Meeting of the Nordic Geodetic Commission 1986. Finnish Geodetic Institute, Helsinki.Search in Google Scholar
Čepek, A. 2022. GNU Gama 2.23, Adjustment of geodetic networks, Edition 2.23 (17 April 2022).Search in Google Scholar
Costantini, M., F. Minati, F. Trillo, A. Ferretti, F. Novali, E. Passera, J. Dehls, Y. Larsen, P. Marinkovic, M. Eineder, R. Brcic, R. Siegmund, P. Kotzerke, M. Probeck, A. Kenyeres, S. Proietti, L. Solari, and H. S. Andersen. 2021. “European Ground Motion Service (EGMS).” IEEE International Geoscience and Remote Sensing Symposium IGARSS, 2021, pp. 3293–6. 10.1109/IGARSS47720.2021.9553562.Search in Google Scholar
Crosetto, M., L. Solari, M. Mróz, J. Balasis-Levinsen, N. Casagli, M. Frei, A. Oyen, D. A. Moldestad, L. Bateson, L. Guerrieri, V. Comerci, and H. S. Andersen. 2020. “The evolution of wide-area DInSAR: From regional and national services to the European Ground Motion Service.” Remote Sensing 12(12), 2043. 10.3390/rs12122043.Search in Google Scholar
Czikhardt, R., H. van der Marel, J. Papco, and R. F. Hanssen. 2022. “On the efficacy of compact radar transponders for InSAR geodesy: Results of multiyear field tests.” IEEE Transaction on Geoscience and Remote Sensing 60, 1–13. 10.1109/TGRS.2021.3119917.Search in Google Scholar
Doerry, A. W. 2008. Reflectors for SAR performance testing. Sandia National Laboratories, United States. 10.2172/929123.Search in Google Scholar
Farolfi, G., S. Bianchini, and N. Casagli. 2019. “Integration of GNSS and satellite InSAR data: Derivation of fine-scale vertical surface motion maps of po plain, Northern Apennines, and Southern Alps, Italy.” IEEE Transactions on Geoscience and Remote Sensing 57(1), 319–28. 10.1109/TGRS.2018.2854371.Search in Google Scholar
Ferretti, A., C. Prati, and F. Rocca. 2000. “Nonlinear subsidence rate estimation using permanent scatterers in differential SAR interferometry.” IEEE Transactions on Geoscience and Remote Sensing 38(5), 2202–12. 10.1109/36.868878.Search in Google Scholar
Ferretti, A., G. Savio, R. Barzaghi, A. Borghi, S. Musazzi, F. Novali, C. Prati, and F. Rocca. 2007. “Submillimeter accuracy of InSAR time series: Experimental validation.” IEEE Transactions on Geoscience and Remote Sensing 45(5), 1142–53. 10.1109/TGRS.2007.894440.Search in Google Scholar
Frei, M. 2017. European Ground Motion Service (EU-GMS) – A proposed Copernicus service element. EGMS White Paper. https://land.copernicus.eu/user-corner/technical-library/egms-white-paper/view.Search in Google Scholar
Fuhrmann, T., M. C. Garthwaite, and S. McClusky. 2021. “Investigating GNSS multipath effects induced by co-located radar corner reflectors.” Journal of Applied Geodesy 15(3), 207–24. 10.1515/jag-2020-0040.Search in Google Scholar
Gorelick, N., M. Hancher, M. Dixon, S. Ilyushchenko, D. Thau, and R. Moore. 2017. “Google Earth Engine: Planetary-scale geospatial analysis for everyone.” Remote Sensing of Environment 202, 18–27. 10.1016/j.rse.2017.06.031.Search in Google Scholar
Gruber, T., J. Ågren, D. Angermann, A. Ellmann, A. Engfeldt, C. Gisinger, L. Jaworski, S. Marila, J. Nastula, F. Nilfouroushan, X. Oikonomidou, M. Poutanen, T. Saari, M. Schlaak, A. Światek, S. Varbla, and R. Zdunek. 2020. “Geodetic SAR for height system unification and sea level research – Observation concept and preliminary results in the Baltic Sea.” Remote Sensing 12, 3747. 10.3390/rs12223747.Search in Google Scholar
Gruber, T., J. Ågren, D. Angermann, A. Ellmann, A. Engfeldt, C. Gisinger, L. Jaworski, T. Kur, S. Marila, J. Nastula, F. Nilfouroushan, M. Nordman, M. Poutanen, T. Saari, M. Schlaak, A. Świątek, S. Varbla, and R. Zdunek. 2022. “Geodetic SAR for height system unification and sea level research – Results in the Baltic Sea test network.” Remote Sensing 14, 3250. 10.3390/rs14143250.Search in Google Scholar
Luzi, G., P. F. Espín-López, F. Mira Pérez, O. Monserrat, and M. Crosetto. 2021. “A low-cost active reflector for interferometric monitoring based on Sentinel-1 SAR images.” Sensors 21(6), 1–20. 10.3390/s21062008.Search in Google Scholar PubMed PubMed Central
Marinkovic, P., G. Ketelaar, F. Van Leijen, and R. Hanssen. 2007. “InSAR quality control: Analysis of five years of corner reflector time series.” In: Fifth International Workshop on ERS/Envisat SAR Interferometry, FRINGE07, Frascati, Italy, edited by Lacoste H. and L. Ouwehand, p. 1–8.Search in Google Scholar
Meo, P. D., M. Pausini, and G. Carnevale. 2019. “ECR-C User manual.” Meta Sensing 1(3), 1–54.Search in Google Scholar
Merryman Boncori, J. P. 2019. “Measuring coseismic deformation with spaceborne synthetic aperture radar: A review.” Frontiers in Earth Science 7, 16. 10.3389/feart.2019.00016.Search in Google Scholar
Puggaard, A. and A. Meister. 2022. “On the use of randomly occurring radar reflectors for the establishment of local ties between InSAR and GNSS.” Nordic Geodetic Commission General Assembly 2022. https://www.nordicgeodeticcommission.com/wp-content/uploads/2022/09/1-On-the-use-of-randomly-occurring-radar-reflectors-for-the-establishment-of-local-ties-between-InSAR-and-GNSS.pdf.Search in Google Scholar
Qin, Y. and D. Perissin. 2015. “Monitoring ground subsidence in Hong Kong via spaceborne Radar: Experiments and validation.” Remote Sensing 7, 10715–36. 10.3390/rs70810715.Search in Google Scholar
Quin, G. and P. Loreaux. 2013. “Submillimeter accuracy of multipass corner reflector monitoring by PS technique.” IEEE Transactions on Geoscience and Remote Sensing 51(3), 1775–83. 10.1109/TGRS.2012.2206600.Search in Google Scholar
Raab, S., B. Döring, D. Rudolf, J. Reimann, and M. Schwerdt. 2016. “Analysis of an improved temperature management concept for SAR system calibration transponders.” European Conference on Synthetic Aperture Radar (EUSAR).Search in Google Scholar
Roukounakis, N., P. Elias, P. Briole, D. Katsanos, I. Kioutsioukis, A. A. Argiriou, and A. Retalis. 2021. “Tropospheric correction of Sentinel-1 synthetic aperture radar interferograms using a high-resolution weather model validated by GNSS measurements.” Remote Sensing 13, 2258. 10.3390/rs13122258.Search in Google Scholar
Torres, R., P. Snoeij, M. Davidson, D. Bibby, and S. Lokas. 2012. “The Sentinel-1 mission and its application capabilities.” 2012 IEEE International Geoscience and Remote Sensing Symposium, pp. 1703–6. 10.1109/IGARSS.2012.6351196.Search in Google Scholar
© 2024 the author(s), published by De Gruyter
This work is licensed under the Creative Commons Attribution 4.0 International License.
Articles in the same Issue
- Research Articles
- Displacement analysis of the October 30, 2020 (Mw = 6.9), Samos (Aegean Sea) earthquake
- Effect of satellite availability and time delay of corrections on position accuracy of differential NavIC
- Estimating the slip rate in the North Tabriz Fault using focal mechanism data and GPS velocity field
- On initial data in adjustments of the geometric levelling networks (on the mean of paired observations)
- Simulating VLBI observations to BeiDou and Galileo satellites in L-band for frame ties
- GNSS-IR soil moisture estimation using deep learning with Bayesian optimization for hyperparameter tuning
- Characterization of the precision of PPP solutions as a function of latitude and session length
- Possible impact of construction activities around a permanent GNSS station – A time series analysis
- Integrating lidar technology in artisanal and small-scale mining: A comparative study of iPad Pro LiDAR sensor and traditional surveying methods in Ecuador’s artisanal gold mine
- On the topographic bias by harmonic continuation of the geopotential for a spherical sea-level approximation
- Lever arm measurement precision and its impact on exterior orientation parameters in GNSS/IMU integration
- Book Review
- Willi Freeden, M. Zuhair Nashed: Recovery methodologies: Regularization and sampling
- Short Notes
- The exact implementation of a spherical harmonic model for gravimetric quantities
- Special Issue: Nordic Geodetic Commission – NKG 2022 - Part II
- A field test of compact active transponders for InSAR geodesy
- GNSS interference monitoring and detection based on the Swedish CORS network SWEPOS
- Special Issue: 2021 SIRGAS Symposium (Guest Editors: Dr. Maria Virginia Mackern) - Part III
- Geodetic innovation in Chilean mining: The evolution from static to kinematic reference frame in seismic zones