Effect of tool velocity ratio on tensile properties of friction stir processed aluminum based metal matrix composites
-
P. Vijayavel


Abstract
In friction stir processing (FSP), tool rotational speed (TRS) and tool traverse speed (TTS) are the two important parameters, known to produce significant changes in the properties of the processed material. Increasing the TRS and TTS beyond a certain level would produce undesirable results. The heat generation will increase with an increase in the TRS and decrease in TTS. Excessive heat generation results in the formation of coarse grains exhibiting poor mechanical properties. The heat generation will decrease with decrease in the TRS and increase in TTS. Low heat generation will lead to inadequate plasticization and improper material flow. Hence a perfect combination of TRS and TTS is required to attain desirable properties in FSPed material. In this investigation FSP was carried out on aluminum based metal matrix composite (LM25AA+5%SiCp) material using five different tool velocity ratios (TVR: TRS/TTS). The FSP was subjected to microstructural characterization and tensile properties, evaluation. The results revealed that the TVR of 2.6 yielded superior tensile properties compared to other conditions.
1 Introduction
Aluminum based metal matrix composites (MMCs) are impressive candidates for car and aircraft fabrication due to the beneficial properties of both their metal- and ceramic-like high strength to weight ratio, high specific modulus, etc. However, MMCs manufactured via the stir casting method suffers from porosity and inhomogeneous distribution of reinforcement particles affecting its serviceability [1]. Moreover, these composites exhibit low ductility and toughness due to incorporation of the hard SiC reinforcement. It was reported by Alizadeh and Paydar [2] that poor matrix-reinforcement bonding and the undesirable chemical reactions between them made the composite brittle. MMCs could be considered as a potential candidate for components involving surface contact in real time applications, if the surface properties were enhanced leaving the bulk untouched [3]. The mechanical properties of composite materials can be enhanced by uniform dispersion of fine ceramic particles in a matrix of fine grains. However, dispersion of SiC particulates in the surface layer is difficult to achieve using conventional manufacturing techniques [4].
Hence, friction stir processing (FSP), a variant of friction stir welding (FSW) was identified as a potential candidate for enhancing the surface properties of aluminum MMCs [5]. In this process, the heat generated by the rotating tool modifies the microstructure of the stir zone and produces fine, and recrystallized grains [6]. FSP proved to be an effective technique in the fabrication of Al-SiCp surface composites with homogeneous distribution of SiC particulates and enhanced superplasticity [7], [8]. FSPed MMCs exhibited better properties because FSP operates in temperatures below the melting point of the processed metals unlike its conventional counterparts which generally operate at high temperatures. FSP can achieve high levels of deformation facilitating the breaking up of SiCp and distributing them evenly in the matrix. The process parameters also alter the heat input and the associated thermal cycles [9]. During this friction stirring process, the material experiences severe plastic deformation in the stir zone, resulting in significant grain refinement [10], [11], [12]. The fine grained microstructure of the stir zone improves mechanical strength and ductility [13], [14]. The properties and characteristics of the FSPed zone can be controlled by optimizing the parameters like; tool pin profile, heat generation, tool tilt angle, tool rotation speed (TRS), tool traverse speed (TTS), axial load, shoulder diameter and plunge depth. The effect of multiple passes during FSP of the A356 alloy was investigated. It was found that FSP did not play a significant role in reducing the size and redistributing the Si particles. The strength and ductility of the zones between the two FSP passes were found to be lower as compared to the nugget zones. Increasing the passes further deteriorated the strength of the previously processed zones due to the over aging caused by the thermal cycles produced during FSP [15]. The tool travel speed during FSP was effectively manipulated to successfully distribute multi walled carbon nano tubes into the AZ31 magnesium alloy. The hardness of the surface composite was found to increase almost two-fold due to the addition of MWCNTs. Thus FSP was proved to be an effective tool in fabricating surface composites with superior properties [16]. In a number of studies, the effects of tool rotational speed and traveling speed on the mechanical properties of the fabricated composite were investigated. The effect of process parameters in the fabrication of AZ91/SiO2 composites via FSP was investigated. Three rotational speeds and three travel speeds were chosen to carry out the process. It was observed that the grain size reduced drastically and the hardness improved simultaneously by increasing the TTS. Results also showed a significant improvement in the tensile strength (TS) of the FSPed AZ91 alloy [17]. The effect of nano sized SiC particles on the friction stir welded joints was studied by varying the tool rotational speed and TTS. Superior mechanical properties were obtained at the optimized tool rotational and TTSs. The ultimate TS and the percentage of elongation were found to have improved significantly. This improvement was attributed to increased nucleation sites due to the SiC particles and grain boundary pinning contributed by the SiC particles. Reinforcements were also found to cause the breaking up of the grains. This caused an improvement in the ductility as well. The ductility of the SiC incorporated specimen was found to be high compared to the SiC – free specimen [18], [19]. It was opined by Dolatkhah et al. [20], that the optimum of TRS and TTS yielded better dispersion of SiC in the Al 5052 matrix. Almost all aluminum alloy types like 1xxx, 2xxx, 3xxx, 4xxx, 5xxx, 6xxx, 7xxx can be added to SiC particles. Among these LM25AA appeared as an outstanding aluminum alloy. Limited publications are available related to analyzing the stir zone strength of the FSPed MMCs. Addition of SiC reinforcement particles contributed more to the strength enhancement in the current investigation. The surface of the LM25AA-5%SiCp MMC was modified using FSP by varying the TVR. The focus and objective of this present investigation was to understand the effect of TVR (TRS/TTS) on microstructure and tensile properties of the aluminum based MMC (LM25AA-5%SiCp).
2 Experimental work
2.1 Base material
The chemical composition of the base metal (LM25AA-5%SiCp) was analyzed using a vacuum spectrometer (ARL-Model: 3460). The result of the analysis showed the existence of 0.2% Cu, 0.6% Mg, 7.5% Si, 0.5% Fe, 0.3% Mn, 0.1% Zn, 0.1% Ni, 0.2 Ti in weight % and the balance contained aluminum with 5% of SiC reinforcement.
2.2 Friction stir processing details
FSP was done on the rectangular plates by securing the plates in position using mechanical clamps. A non-consumable tool made of super high speed steel was used in the process. A computer numerically controlled (CNC) FSW machine (Make: RV Machine Tools, India; Model: CNCFSWRVMT-001; Capacity: 22 kW, 4000 rpm, 60 kN) was used to control the FSPed plates. The microstructure and the properties of the FSPed surface are generally influenced by the major parameters such as tool rotational speed, TTS, tool shoulder to pin diameter (D/d) ratio, axial force, pin or probe length, tool pin profiles, etc. In this investigation, FSP was done on 200 mm×100 mm LM25AA-5% SiCp MMC plates of 12 mm thickness. A tapered cylindrical (TAC) pin with major diameter of 7.2 mm and minor diameter 5.5 mm, pin length 7.2 mm and taper angle 6.73° was used. The main objective of this experiment was to study the effect of TVR on the microstructure and mechanical properties of the FSPed MMC while keeping the other parameters constant. The values of the FSP parameters are listed in Table 1. The TRS or the spindle speed was varied from 800 to 1200 in steps of 100, whereas the TTS was maintained constant at 40 mm/min. TTS of 40 mm/min was selected because of its optimum results delivered in the previous trials. The tool rotational velocity, (ω) of the spindle was calculated from the number of revolutions made by the spindle (N) using the formula,
FSP process parameters.
| Process parameters | Values |
|---|---|
| Tool rotational speed, N (rpm) | 800, 900, 1000, 1100, 1200 |
| Traverse speed, v (mm/min) | 40 |
| Axial Force, F (KN) | 3 |
where,
“ω” is the tool velocity of the spindle in rad/min.
N is the number of revolutions made by the spindle in 1 min (rpm).
The ratio between the TRS (or ω) and the TTS (or v) was calculated (ω/v) for all TRSs using the equation 2 and the values are presented in Table 2.
Tool velocity ratio.
| Tool rotational speed (rpm) | Tool rotation velocity ω (rad/min) | Tool traverse velocity v (mm/min) | Tool velocity ratio (ω/v) |
|---|---|---|---|
| 800 | 83.77 | 40 | 2.0 |
| 900 | 94.24 | 40 | 2.3 |
| 1000 | 104.71 | 40 | 2.6 |
| 1100 | 115.19 | 40 | 2.9 |
| 1200 | 125.66 | 40 | 3.2 |
Longitudinal tensile test specimens were extracted from the FSPed zone and the schematic of the extracted specimen is show in Figure 1A. The tensile specimens (as shown in Figure 1B) were prepared as per ASTM B557M guidelines. The specimens were tested using a Universal Testing Machine (UNITEK-94100; FIE-BLUE STAR, India). The results indicated that the base material had a yield strength of 143 MPa, ultimate TS of 155 MPa, elongation of 2% and 6.581% of reduction in the cross sectional area. Microhardness of the base metal was evaluated with a Vickers MH tester with 0.5 N of load for a dwell time of 15 s and it was found to be 68 Hv. The MH of the various areas (SIR, MIR and PIR) of the stir zone were measured along the transverse direction at a depth of 2.4 mm below the top surface of the specimen using a Vickers MH tester (HMV-2T; Shimadzu, Japan) at a load of 0.49 N and a dwell time of 15 s. Macro- and microstructural characterization were carried out using a light optical microscope incorporated with image analysis software. The specimens for metallographic examination were sectioned to the required size and initially polished using the descending grit size emery paper. The specimen was finally polished using a diamond compound in the rotating disc-polishing machine. To reveal the microstructure 5% hydrofluoric acid was used as an etchant. Scanning electron microscopy (SEM) was employed to observe the microstructure and fracture surfaces of stirred zone at higher magnification.
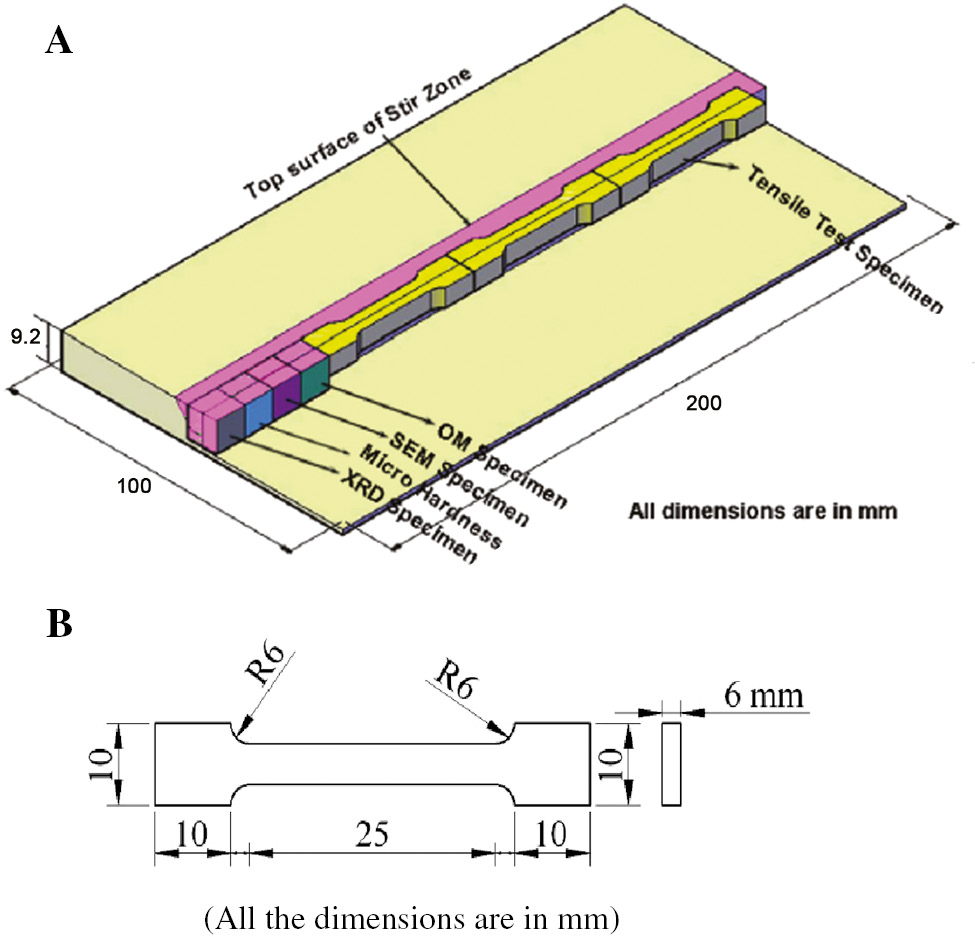
Specimen preparation details.
(A) Scheme of extraction and (B) dimensions of tensile specimen.
3 Results
3.1 Macrostructure
The macrographs of the stir zones processed for various TVRs are presented in Table 3. It could be inferred from the macrographs that the TVR of 2.6 produced a defect free stir zone. The TVR of 2 produced a tunnel defect at the middle of the stir zone. A pin hole defect was observed on the advancing side of the stir zone processed for a TVR of 2.30. A similar pin hole defect was noticed on the advancing side of the stir zone for a TVR of 2.9. The stir zone processed for a TVR of 3.2 exhibited a tunnel defect at the shoulder influenced region. Due to insufficient flow, defects like tunnel, pin hole, etc. occur commonly in the FSP stir zone [21].
Effect of TVR on macrostructure.
| Tool velocity ratio (TVR) | Cross sectional macrostructure | Top Surface | Observation | |
|---|---|---|---|---|
| AS | RS | |||
| 2.00 | 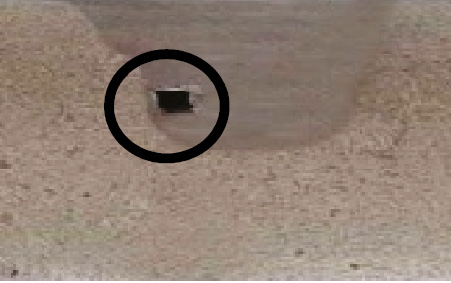 |  | Pin hole at the AS pin influenced region | |
| 2.30 | 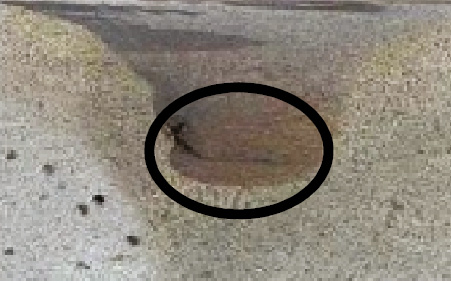 |  | Pin hole at the AS pin influenced region | |
| 2.60 |  |  | No defect | |
| 2.90 |  | 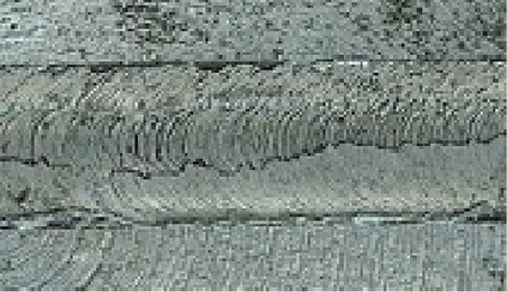 | Tunnel defect at the shoulder influenced region | |
| 3.20 | 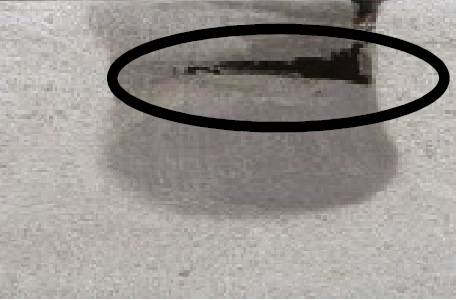 |  | Tunnel defect at the mid thickness region | |
The formation of defects indicates insufficient material displacement and consolidation. The phenomenon behind the formation of these defects could be better explained with the stir zone area, specifically the area influenced by the shoulder (SIR), pin (PIR) and the middle area. The defects produced at the shoulder level were visible in the top surface macrograph, whereas the defects at the mid and the bottom section remained hidden.
The stir zone areas operated by the shoulder, the middle area and the pin are designated as SIR, MIR and PIR, respectively, are presented in Table 4.
Effect of TVR stir zone area analysis.
| Tool velocity ratio (TVR) | Macrograph | Area of SIR (mm2) | Area of MIR (mm2) | Area of PIR (mm2) | Total area of stir zone (mm2) | |
|---|---|---|---|---|---|---|
| AS | RS | |||||
| 2.00 | 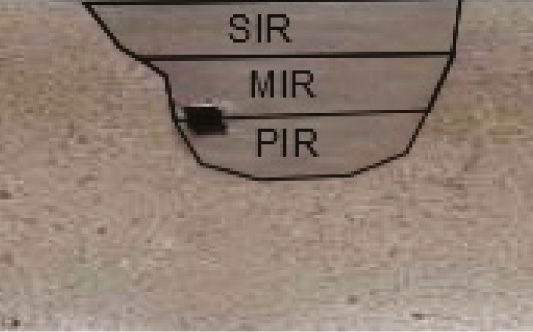 | 162.27 | 137.26 | 106.87 | 406.4 | |
| 2.30 |  | 221.51 | 141.96 | 101.58 | 465.05 | |
| 2.60 | 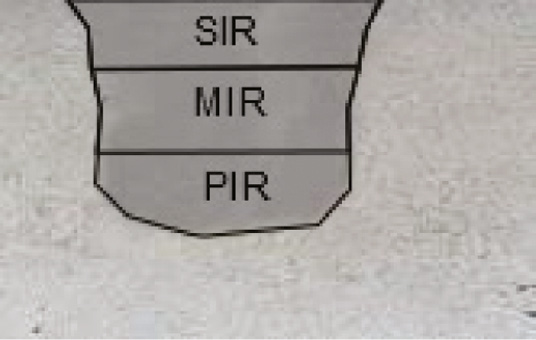 | 147.46 | 160.40 | 140.56 | 448.42 | |
| 2.90 |  | 169.40 | 157.03 | 149.09 | 475.52 | |
| 3.20 | 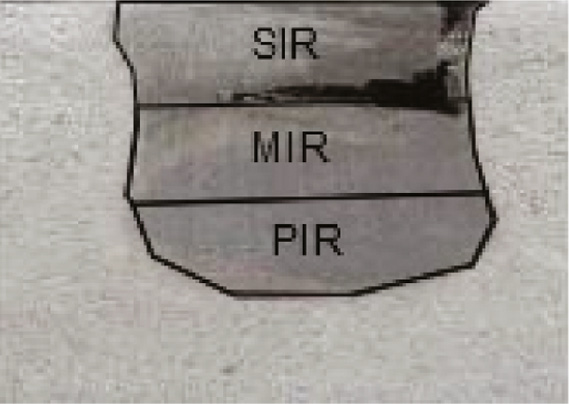 | 229 | 220.59 | 194.72 | 644.31 | |
SIR, Shoulder influenced region; MIR, middle region; PIR, pin influenced region.
3.2 Microstructure
The FSP parameters like tool rotational speed and TTS have a strong influence on pulling and stirring the material which in turn influence the characteristics of the stir zone [22]. In general, increase in TRS an increases the heat generation subsequently increasing the grain size. However, the TRS coupled with appropriate TTS produces fine equiaxed grains due to severe plastic deformation and the cooling rate influenced by the travel speed of the tool. Figure 2 shows the optical micrographs of the stir zone for different TVRs. Of the five TVRs, the pass with the TVR of 2.60 produced stir zones with the finer grains and SiCp size (SPS). The passes with the TVRs of 2.90 produced stir zones with largest grain and SPS of 22.341 μm and 16.83 μm, respectively. A TVR of 2.90 produced grains and SiCps of size 6.96 μm and 9.38 μm, respectively. The optical microstructural signatures were further validated using SEM analysis. The SEMs of the stir zones for various TVRs are shown Figure 3. The following SEM images of the FSPed zones confirmed the presence of SiC broken into fine particles. The stir zone of the base material examined using SEM exhibited coarse grains with SiC particulates segregated along the grain boundaries. The SEM image of the stir zone processed with the TVR of 2.6 revealed the presence of fine equiaxed grains and SiCps distributed homogeneously. The grain size and SPS produced with different TVRs are shown in Table 5. It could be inferred from the table that the TVR of 2.6 produced the finest grains and SiC particulates.
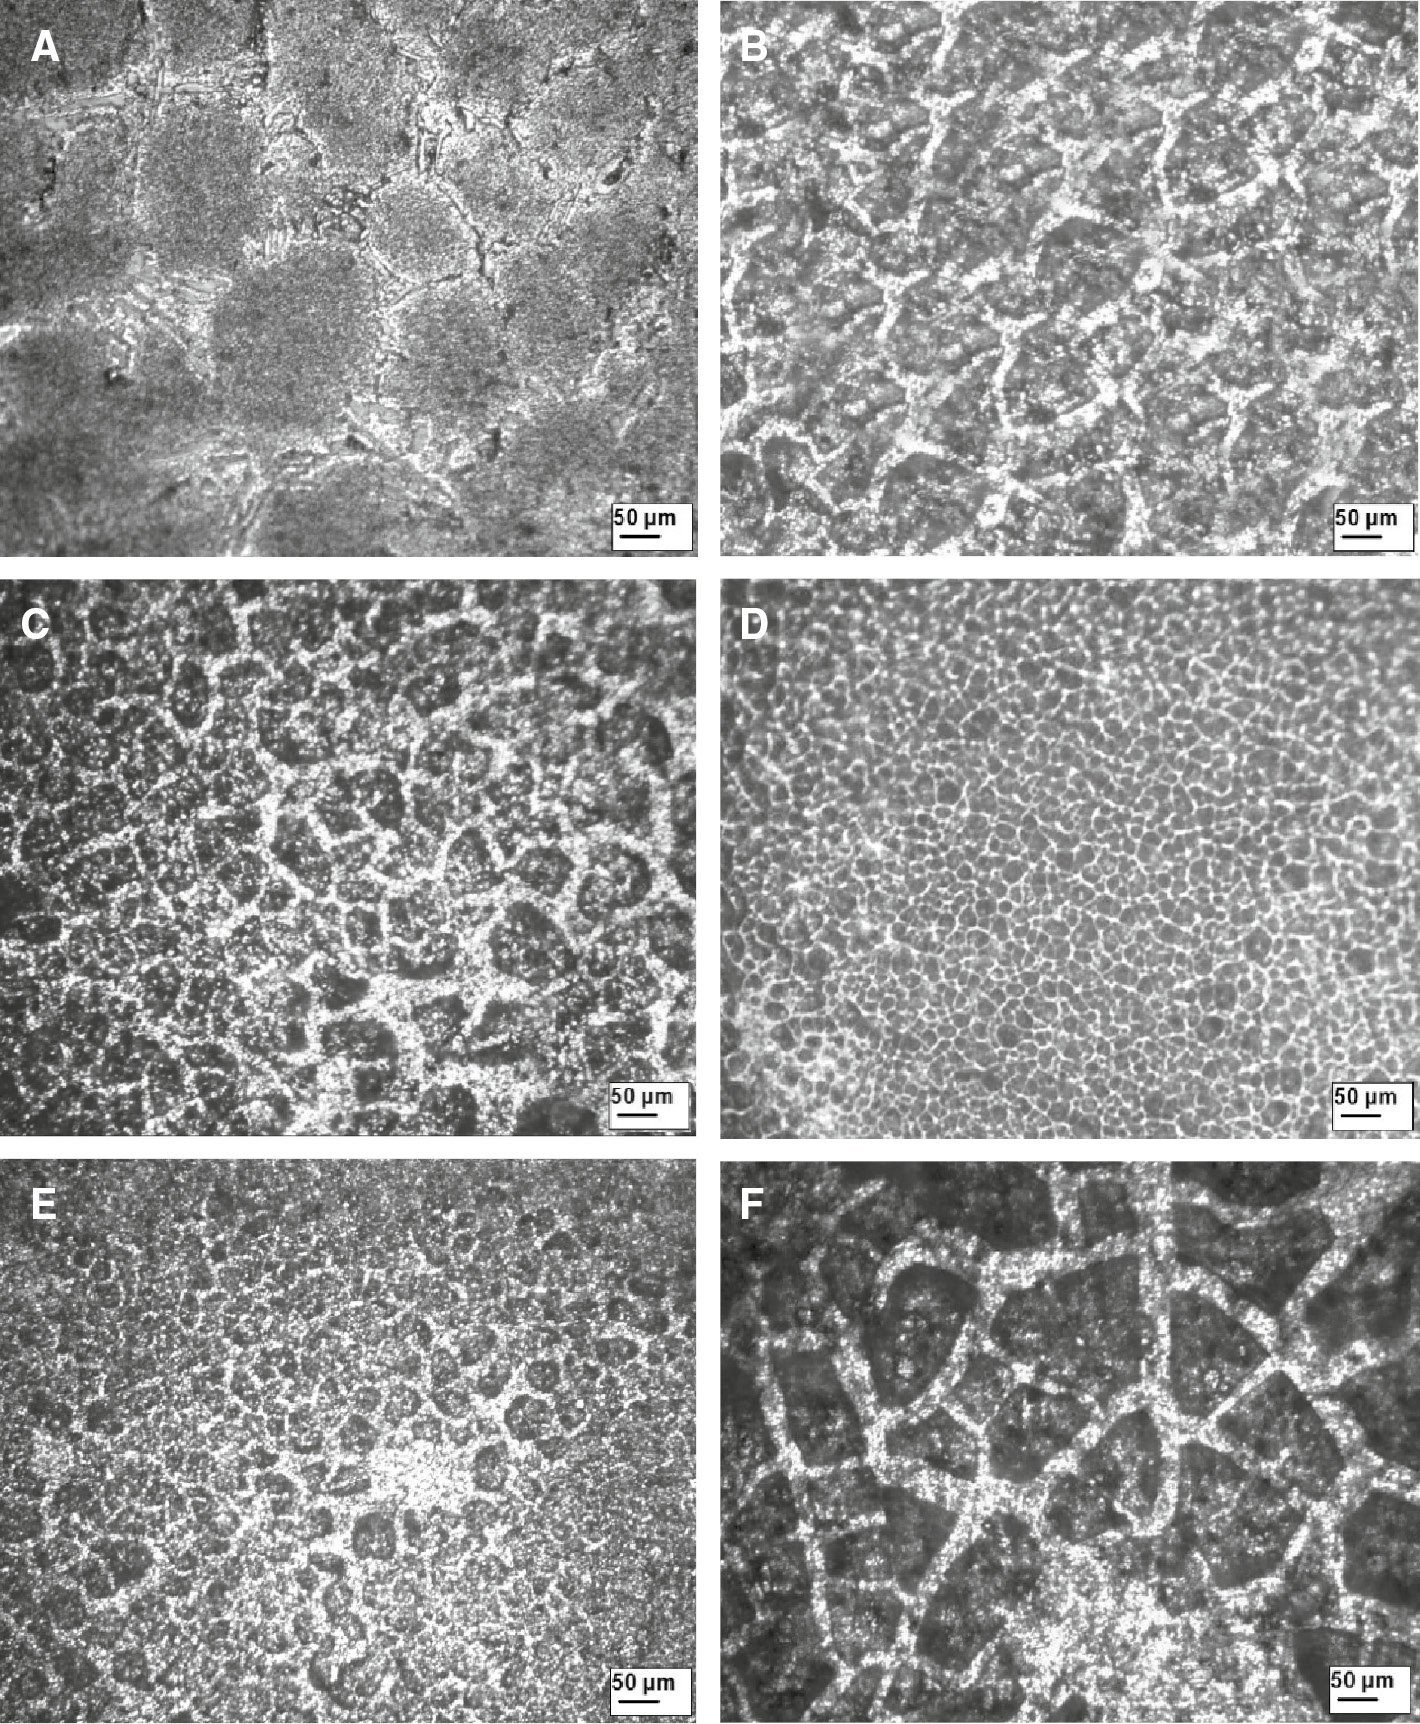
Effect of TVR on FSP region microstructure (OM).
(A) Base material, (B) TVR=2.00, (C) TVR=2.30, (D) TVR=2.60, (E) TVR=2.90 and (F) TVR=3.20.
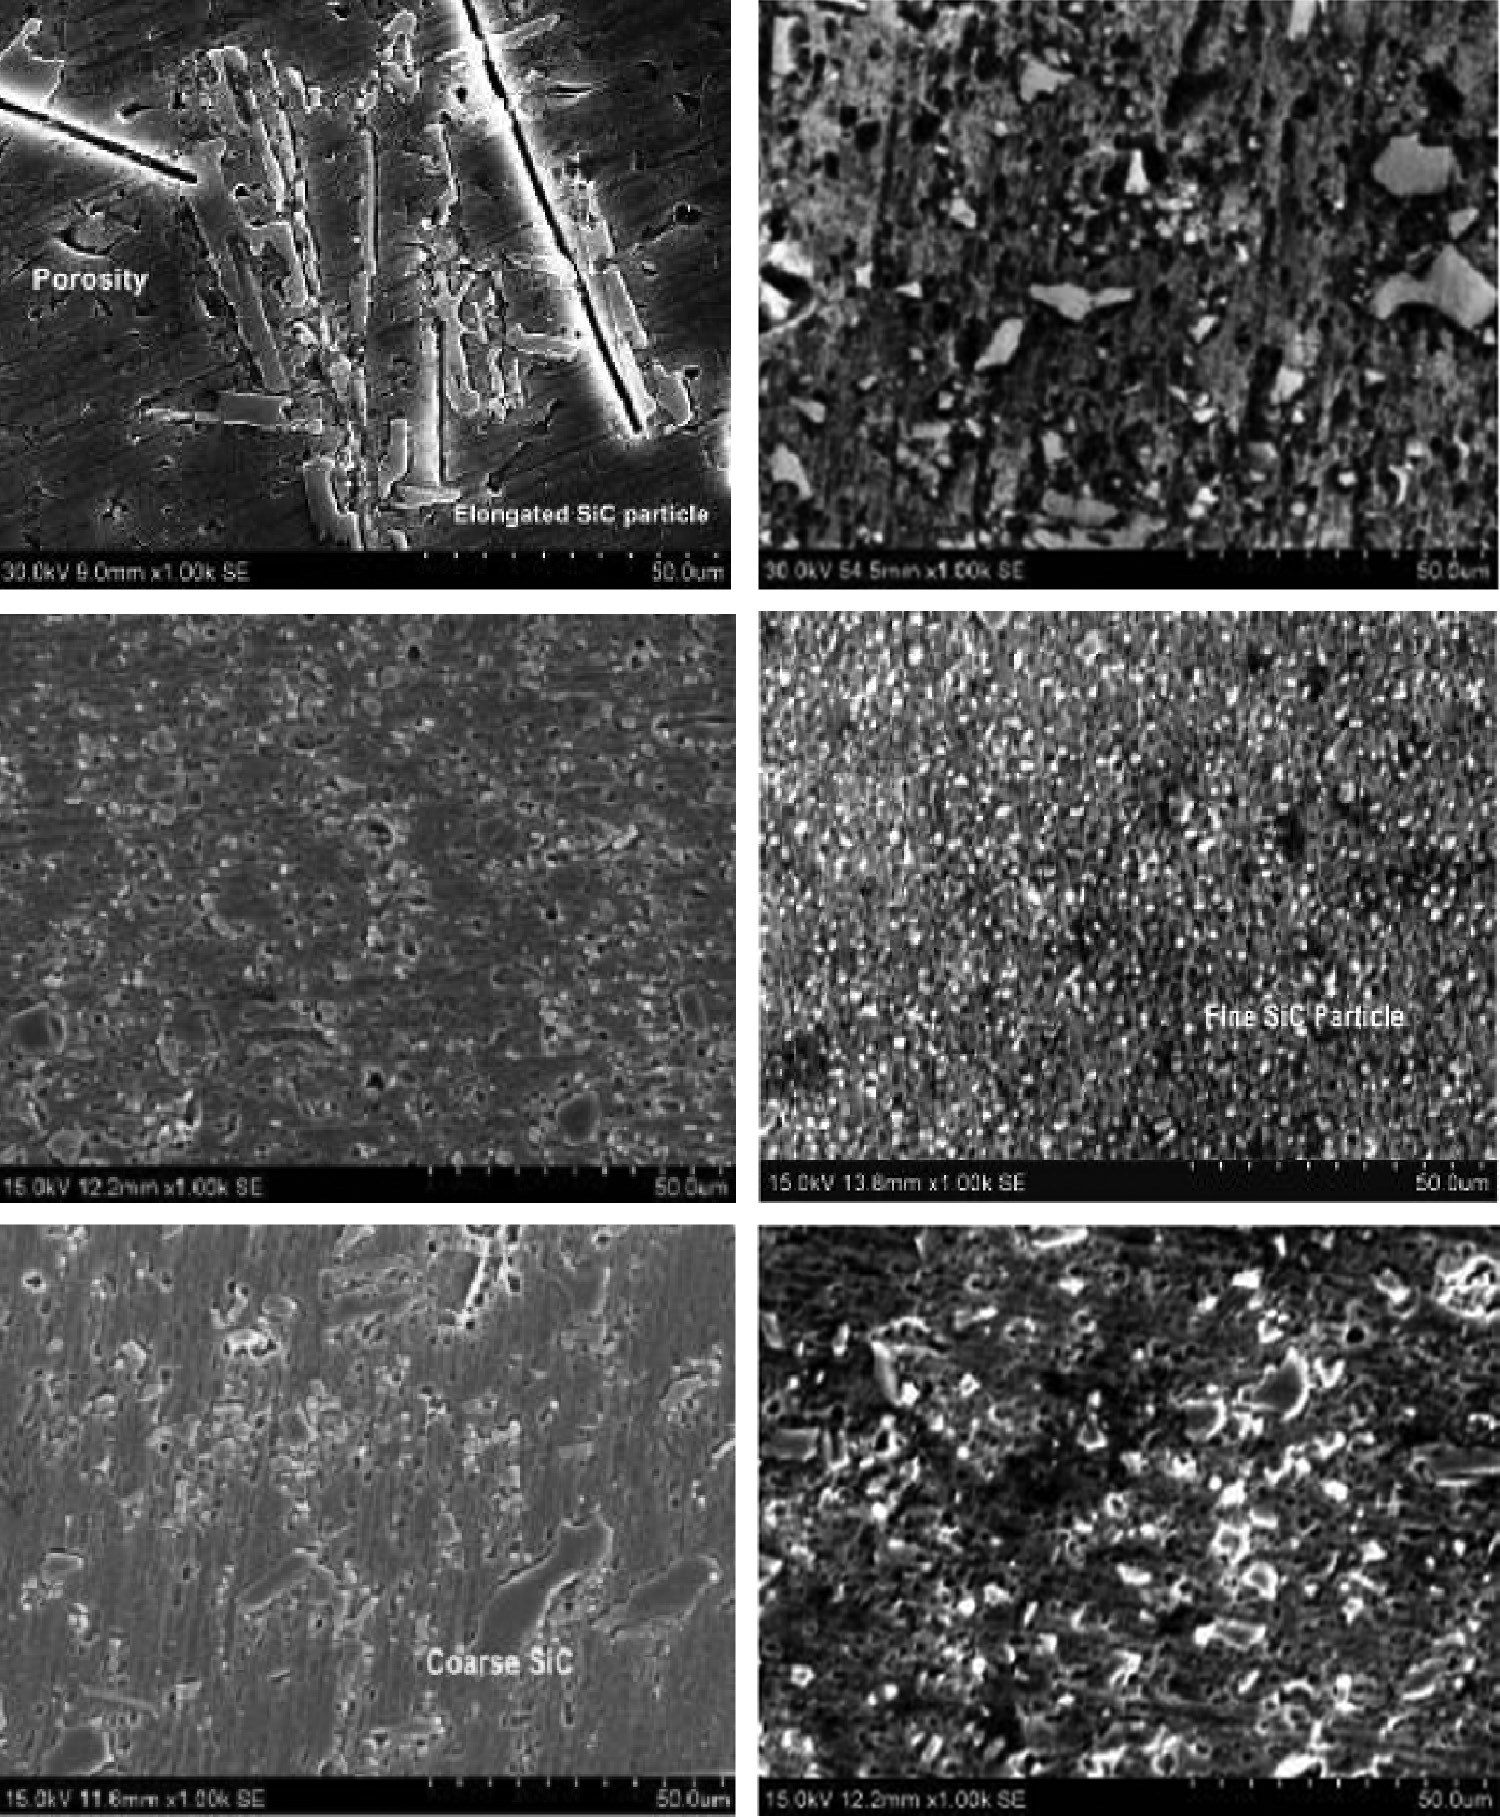
Effect of TVR on stir zone microstructural (SEM).
(A) Base material, (B) TVR=2.00, (C) TVR=2.30, (D) TVR=2.60, (E) TVR=2.90 and (F) TVR=3.20.
Effect of TVR on matrix grain size and reinforcement size.
| TVR | Average grain size of the matrix (μm) | Average SiCp size (μm) |
|---|---|---|
| Base metal | 96 | 60 |
| 2.00 | 14.689 | 7.089 |
| 2.30 | 12.339 | 4.993 |
| 2.60 | 2.091 | 0.936 |
| 2.90 | 9.984 | 3.8417 |
| 3.20 | 8.891 | 4.8401 |
3.3 Tensile properties
The photographs of the tensile specimens before and after the test are shown in Figure 4A and B. The ultimate TS and the elongation percentage were measured for five TVRs and the results are shown in Table 6. The results in the table reveal that the TVR of 2.6 exhibited maximum TS and elongation. FSPed materials, formation of uniform grained structural recrystallization and improved stir zone TS were registered [23], [24].
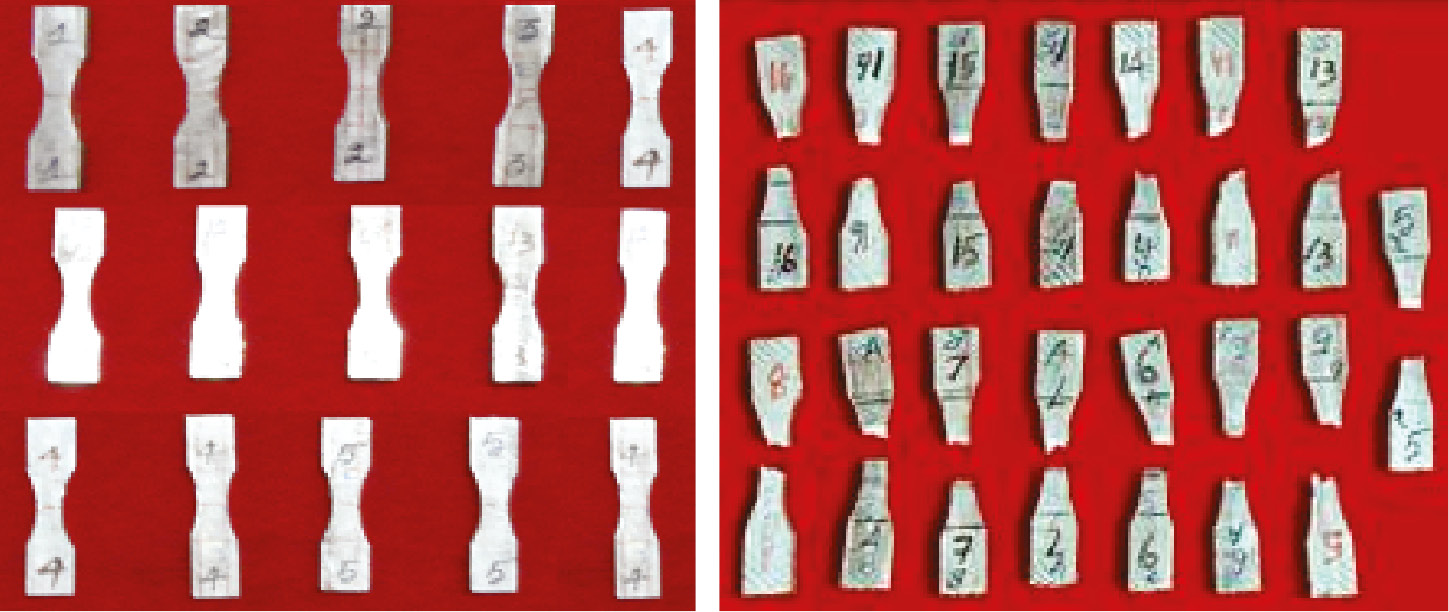
Photograph of tensile test specimen.
(A) Before test and (B) after test.
Effect of TVR on tensile properties of FSPed material.
| Tool velocity ratio (TVR) | Tensile strength (MPa) | Elongation in 25 mm gauge length (%) |
|---|---|---|
| Base metal | 155 | 2 |
| 2.00 | 167 | 2.2 |
| 2.30 | 172 | 4.5 |
| 2.60 | 194 | 7.2 |
| 2.90 | 165 | 5.4 |
| 3.20 | 154 | 3.6 |
The ultimate TS of the specimens increased with the increasing TVR up to 2.6 and then decreased. The load versus displacement curves generated for various TVRs are displayed in Figure 5. The continuous load displacement curve which shows no signatures of upper and lower yielding point. Yielding can represent that the materials undergoes ductile mode of failure while loading. The fractured surfaced were subjected to SEM examination to study the morphology of the worn surfaces. The SEM images of the fractured surfaces (fractographs) of the base metal and for the five TVRs are displayed in Figure 6. The fractographs revealed ductile mode of fracture characterized by the presence of large voids of cup and cone form.

Load displacement curves.

Effect of TVR on fracture morphology.
(A) Base material, (B) TVR=2.00, (C) TVR=2.30, (D) TVR=2.60, (E) TVR=2.90 and (F) TVR=3.20.
3.4 Microhardness
The MH values for different TVRs are displayed in Table 7. From the results, it could be inferred that the TVR of 2.6 yielded the highest MH values in all three regions of the stir zones compared to its counterparts. With the increases in TVR, hardness increases to some extent and then decreases when the stir zone contact area is increased further. It is inferred from the results that proper material flow and formation of equiaxed fine recrystallized grains with uniform distribution of SiC particles is evident in the FSPed region obtained using TVR of 2.6.
Effect of TVR on hardness of the FSPed material.
| Tool velocity ratio (TVR) | Average hardness of SIR (Hv 0.05) | Average hardness of MIR (Hv) | Average hardness of PIR (Hv) | Average hardness of the stir zone (Hv) |
|---|---|---|---|---|
| Base metal | 96 | 84 | 78 | 68 |
| 2.00 | 96 | 84 | 81 | 86 |
| 2.30 | 101 | 95 | 86 | 92 |
| 2.60 | 128 | 119 | 110 | 112 |
| 2.90 | 105 | 98 | 91 | 89 |
| 3.20 | 99 | 85 | 83 | 84 |
4 Discussion
4.1 Effect of tool velocity ratio on stir zone macrostructure and microstructure
It could be inferred from the macrographs that the stir zone with a TVR of 2.6 was defect free and its counterparts had defects. The reasons for the defect formation could be understood by analyzing the macrograph showing the stir zone areas specific to various parts of the FSP too. It is evident from the macrograph for a TVR of 2.00 that the volume of the material displaced by the tool pin was too large for the tool shoulder to handle which resulted in a material accumulation at the SIR. A tunnel defect arose in the retreating side of the SIR as the shoulder could not compress all the displaced material back to the stir zone failing to produce enough consolidation. This shows that the TRS of 800 rpm was not in perfect proportion with the TTS of 40 mm/min to produce a healthy stir zone. Increasing the TRS to 900 rpm caused the TVR to change to 2.30. The material displaced by the pin was consolidated by the shoulder; however, the consolidation was not good enough to eliminate the pin hole defect at the interface of MIR and PIR. The higher value of MIR indicated material stagnation in the middle compared to the PIR. This variation in the material displaced between the MIR and PIR resulted in the pin hole defect. When the TRS was further increased to 1000 rpm, the tool produced a defect free stir zone of uniform size with proportionate SIR, MIR and PIR. The stir zone produced at this TVR of 2.6 yielded much better properties compared to its counterparts. However, increasing the TRS further to 1100 and 1200 produced stir zones with pin hole and tunnel defect on the AS of PIR and SIR, respectively. It could be inferred the TVR of 2.6 delivered the right combination of TRS and TTS to produce defect free zones. From the graph in Figure 7, it could be inferred that the grain size decreased with increasing TVR up to the value of 2.6 and then started increasing.
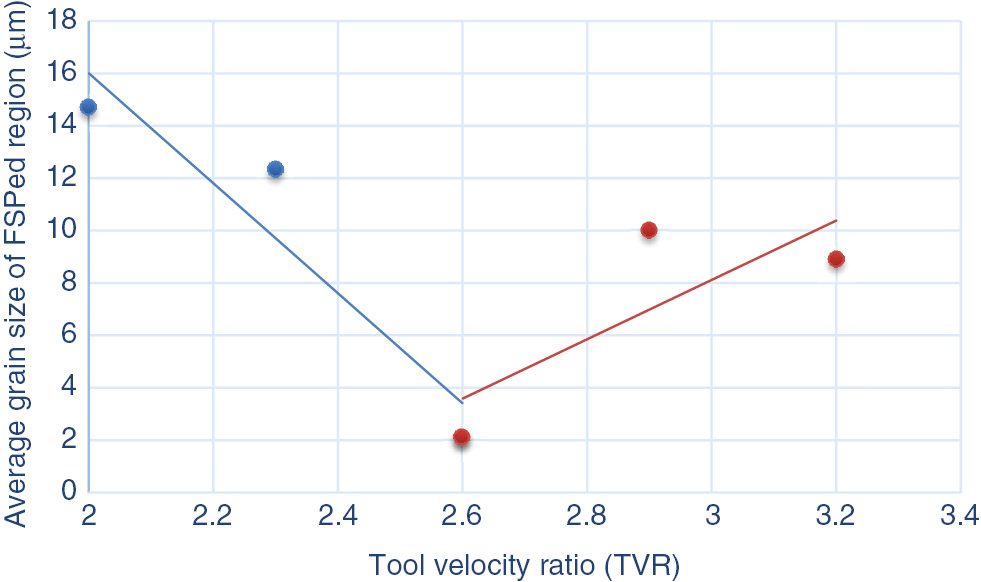
Effect of TVR on average grain size of the matrix.
In other words, the grain size was inversely proportional to the TVR up to 2.6 and then maintained a directly proportional relationship beyond a TVR of 2.6. This clearly proved that the TVR of 2.6 yielded minimum grain size enhancing the properties of the processed zone. Severe plastic deformation is experienced by the grains in the stir zone during FSW which results in a fine recrystallized grain structure [8], [25].
The average grain size (AGS) for a given TVR ratio could easily be estimated using the following regression equations.
The size of the SiC particles also followed the same trend of decreasing first with the TRS up to the value of 2.6 and then increasing linearly beyond 2.6. The graph in Figure 8 shows inverse proportionality till the TVR of 2.6 and direct proportionality >2.6.
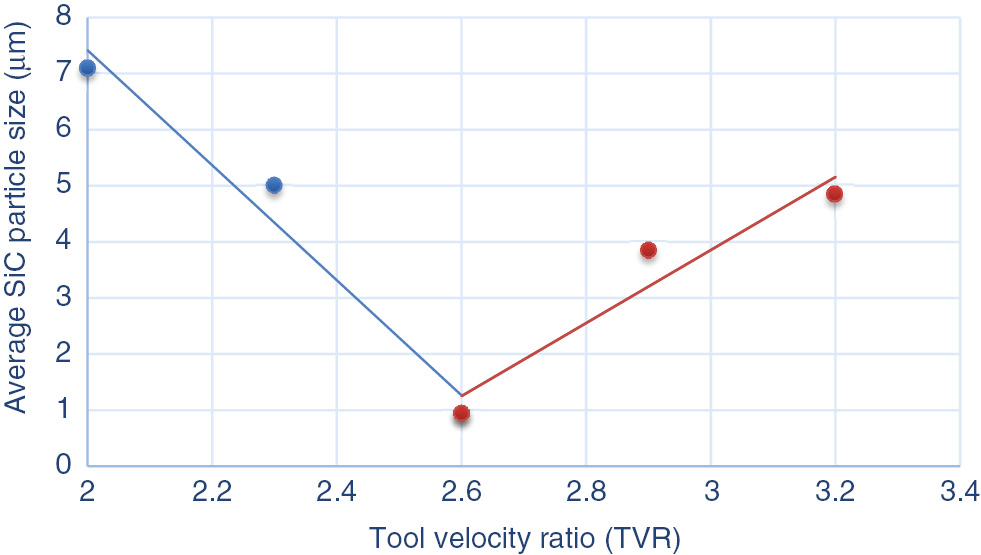
Effect of TVR on average SiCp size.
The average SPS for a given TVR could be estimated using the following regression equations.
4.2 Effect of tool velocity ratio on stir zone tensile properties
The TVR of 2.6 exhibited better TS and elongation when compared to its counterparts. The macrostructure results suggested that the stir zone produced with a TVR of 2.6 was defect free while the others were defective. The cylindrical contour of the stir zone produced for this tool volume ratio indicated uniform operation of the tool pin for this parameter combination. This resulted in breaking up of coarse grains and SiC particles in the base metal in to fine equiaxed grains and uniformly distributed SiC particles. Improvement of the strength is mainly attributed by fine grain size and homogeneous distribution of refined SiCp [26], [27]. In the FSW process defect free weld is possible by an effective and ideal combination of ω and v [19].
The improvement in the tensile properties for this TVR could be attributed the fine microstructure revealed in the OM and SEM micrographs for the tool volume ratio of 2.6. The deterioration in the tensile properties for other TVR could be due to the defective stir zones caused as a result of improper material flow and consolidation. TRS and TTS are essential to get a comparatively maximum TS [19], [28]. The higher TS exhibited for the TVR of 2.6 indicated good bonding between the matrix and the reinforcement which again was confirmed by the higher elongation percentage compared to its counterparts. The ductility exhibited could be attributed to the fine recrystallized grains produced at the TVR of 2.6. The SEM micrographs of the fractured specimens revealed dimples which were an indication of ductile fracture. However, the base metal fractured surface indicated a brittle fracture mode. It could be inferred that FSP enhanced the strength and ductility by refining the grains and breaking down the coarse SiCp present in the bulk material.
From Figure 9 it could be inferred that the TS linearly increased till the TVR of 2.6 showing a directly proportional relationship and decreased thereafter exhibiting an inversely proportional relationship with the TVR.

Effect of TVR on tensile strength of FSPed material.
The TS for any given TVR could easily be estimated using the following regression equations.
4.3 Effect of tool velocity ratio on stir zone micro hardness
The MH values for different TVRs are shown in Table 7. From the results, it could be inferred that the TVR of 2.6 yielded the highest MH values in all three regions of the stir zones compared to its counterparts. From the MH results it could be inferred that the TVR of 2.6 produced higher hardness compared to its counterparts. The surface hardness was influenced predominantly by the tool shoulder. The microhardness increased up to the TVR of 2.6 and then decreased. The defects present in SIR of the stir zones reduced the hardness and the perfectly processed stir zone caused the hardness to hit the highest value at the TVR of 2.6. Dispersion of hard SiC particles and significant micro structural modification also contributed to the increase in hardness. Increase in MH is mainly concerned with the fine grain size which is due to the result of ω and v [19], [29]. The hard SiC particles were broken and evenly distributed in the aluminum matrix at the optimum TRS or 1000 rpm or at the TVR of 2.6. From Figure 10, it could be inferred that the MH first increased linearly up to the TVR of 2.6 maintaining a directly proportional relationship and then decreased beyond the value of 2.6 showing an inversely proportional relationship.
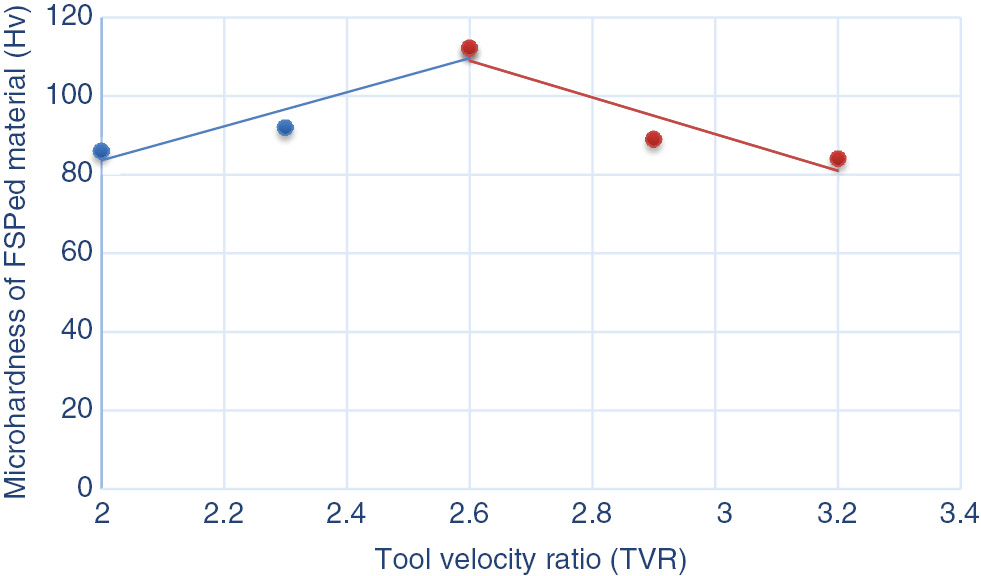
Effect of TVR on hardness of the FSPed material.
The MH for a given TVR could easily be estimated using the following regression equations.
5 Conclusions
From this study following conclusions are derived:
The stir zone with recrystallized equiaxed grains and evenly distributed SiC particles produced at the TVR of 2.6 exhibited better properties compared to its counterparts.
The enhancement in the properties of the stir zone could be attributed to the uniform contour of the stir zone governed by various regions of the stir zone (SIR, MIR and PIR).
The TRS maintained at a suitable proportion with the TTS yields stir zone with exceptional properties. In this investigation, the TRS of 1000 rpm and the TTS of 40 mm/min produced better results compared to its counterparts.
Acknowledgments
The authors wish to extend their sincere thanks to the University Grants Commission (UGC) for financial support under the scheme of the Rajiv Gandhi National fellowship (RGNF).
References
[1] Ibrahim IA, Mohamed FA, Lavernia EJ. J. Mater. Sci. 1991, 25, 1137–1156.10.1007/BF00544448Search in Google Scholar
[2] Alizadeh M, Paydar MH. J. Alloy compd. 2009, 477, 811–816.10.1016/j.jallcom.2008.10.151Search in Google Scholar
[3] Rabinowicz E. Friction and Wear of Materials. John Wiley and Sons: New York, 1965.Search in Google Scholar
[4] Budinski KG. Surface Engineering for Wear Resistance. Prentice Hall, New Jersey, 1988.Search in Google Scholar
[5] Mishra RS, Ma ZY, Charit I. Mater. Sci. Engg. A 2003, 341, 307–310.10.1016/S0921-5093(02)00199-5Search in Google Scholar
[6] Ma ZY. Metall. Mater. Trans.A 2008, 39A, 642–658.10.1007/s11661-007-9459-0Search in Google Scholar
[7] Change CI, Lee CJ, Huang JC. Scrip. Mater. 2004, 51, 509–514.10.1016/j.scriptamat.2004.05.043Search in Google Scholar
[8] Hirata T, Oguri T, Hagine H, Tanaka T, Chung SW, Takigawa Y. Mater. Sci. Engg. A 2007, 456, 344–349.10.1016/j.msea.2006.12.079Search in Google Scholar
[9] Charit I, Mishra RS. Scrip. Mater. 2008, 58, 367–371.10.1016/j.scriptamat.2007.09.052Search in Google Scholar
[10] Jian-Qing Su, Nelson TW, Sterling CJ. Mater. Sci. Engg. A 2005, 405, 277–286.10.1016/j.msea.2005.06.009Search in Google Scholar
[11] Ma ZY, Pilchak AL, Juhas MC, Williams JC. Scrip. Mater. 2008, 58, 361–366.10.1016/j.scriptamat.2007.09.062Search in Google Scholar
[12] Ma ZY, Mishra RS, Mahoney MW. Acta Mater. 2002, 50, 4419–4430.10.1016/S1359-6454(02)00278-1Search in Google Scholar
[13] Feng AH, Xiao BL, Ma ZY. Compos. Sci. Technol. 2008, 68, 2141–2148.10.1016/j.compscitech.2008.03.010Search in Google Scholar
[14] Wang D, Xiao BL, Wang QZ, Ma ZY. Mater. Desig. 2013, 47, 243–247.10.1016/j.matdes.2012.11.052Search in Google Scholar
[15] Berbon PB, Bingel WH, Mishra RS, Bampton CC, Mahaney MW. Scrip. Mater. 2001, 44, 61–66.10.1016/S1359-6462(00)00578-9Search in Google Scholar
[16] Morisada Y, Fhjii H, Naga Oka T, Fukusumi M. Mater. Sci. Engg. A 2006, 419, 344–348.10.1016/j.msea.2006.01.016Search in Google Scholar
[17] Khayyamin D, Mostafapour A, Keshmiri A. Mater. Sci. Engg. A. 2013, 559, 217–221.10.1016/j.msea.2012.08.084Search in Google Scholar
[18] Baramouz M, Besharati Givi MK, Javad S. Mater. Charact. 2011, 62, 108–117.10.1016/j.matchar.2010.11.005Search in Google Scholar
[19] Hariri MB, Shiri SG, Yaghoubinezhad Y, Rahvard MM. Mater. Des. 2013, 50, 620–634.10.1016/j.matdes.2013.03.027Search in Google Scholar
[20] Dolatkhah A, Golbabaei P, Besharati Givi MK, Molaiekiya F. Mater. Des. 2012, 37, 458–464.10.1016/j.matdes.2011.09.035Search in Google Scholar
[21] Sharma SR, Ma ZY, Mishra RS. Scrip. Mater. 2004, 51, 237–241.10.1016/j.scriptamat.2004.04.014Search in Google Scholar
[22] Elangovan K, Balasubramanian V. Mater. Des. 2008, 29, 362–373.10.1016/j.matdes.2007.01.030Search in Google Scholar
[23] Du XH, Wu BL. Trans. Nonfer. Met. Soc. China 2008, 18, 562–565.10.1016/S1003-6326(08)60098-9Search in Google Scholar
[24] Liu HJ, Zhang HJ, Huang YX, Yu L. Trans. Nonfer. Met. Soc. China 2010, 20, 1387–1391.10.1016/S1003-6326(09)60309-5Search in Google Scholar
[25] Humpherys FJ, Hatheriy M. Recrystalization and Related Annealing Phenomena. Elsevier: Oxford, UK, 2004, pp. 285–319.10.1016/B978-008044164-1/50013-XSearch in Google Scholar
[26] Choi D-H, Kim Y-II, Kim D-U, Jung S-B. Trans. Nonfer. Met. Soc. China 2012, 22, S614–S618.10.1016/S1003-6326(12)61773-7Search in Google Scholar
[27] Kwon YJ, Shim SB, Park DH. Trans. Nonfer. Met. Soc. China 2009, 19, S23–S27.10.1016/S1003-6326(10)60239-7Search in Google Scholar
[28] Devaraju A, Kumar A, Kumaraswamy A, Kotiveerachari B. Mater. Des. 2013, 51, 331–341.10.1016/j.matdes.2013.04.029Search in Google Scholar
[29] Know YJ, Shigematsu I, Saito N. Mater. Sci. Engg. A 2007, 436, 344–349.Search in Google Scholar
©2016 Walter de Gruyter GmbH, Berlin/Boston
This article is distributed under the terms of the Creative Commons Attribution Non-Commercial License, which permits unrestricted non-commercial use, distribution, and reproduction in any medium, provided the original work is properly cited.
Articles in the same Issue
- Frontmatter
- Eccentric annular crack under general nonuniform internal pressure
- Path-dependent J-integral evaluations around an elliptical hole for large deformation theory
- On the correct interpretation of compression experiments of micropillars produced by a focused ion beam
- Influences of post weld heat treatment on tensile strength and microstructure characteristics of friction stir welded butt joints of AA2014-T6 aluminum alloy
- Effect of tool velocity ratio on tensile properties of friction stir processed aluminum based metal matrix composites
- Friction surfacing for enhanced surface protection of marine engineering components: erosion-corrosion study
- Propagation of SH waves in a regular non-homogeneous monoclinic crustal layer lying over a non-homogeneous semi-infinite medium
- Tsallis statistics and neurodegenerative disorders