Eight-chain and full-network models and their modified versions for rubber hyperelasticity: a comparative study
-
Mokarram Hossain
 ,
A.F.M.S. Amin
,
A.F.M.S. Amin

Abstract
The eight-chain model, also known as Arruda-Boyce model, is widely used to capture the rate-independent hyperelastic response of rubber-like materials. The parameters of this model are physically based and explained from micromechanics of chain molecules. Despite its excellent performance with only two material parameters to capture bench measurements in uniaxial and pure shear regime, the model is known to be significantly deficient in predicting the equibiaxial data. To ameliorate such drawback, over the years, several modified versions of this successful model have been proposed in the literature. The so-called full-network model is another micromechanically motivated chain model, which has also few modified versions in the literature. For this study, two modified versions of the full-network model have been selected. In this contribution, five modified versions of the Arruda-Boyce model and two modified versions of full-network model are critically compared with the classical eight-chain model for their adequacy in representing equibiaxial data. To do a comparison of all selected models in reproducing the well-known Treloar data, the analytical expressions for the three homogeneous deformation modes, that is, uniaxial tension, equibiaxial tension, and pure shear have been derived and the performances of the selected models are analysed. The comparative study demonstrates that modified Flory-Erman model, Gornet-Desmorat (GD) model, Meissner-Matějka model, and bootstrapped eight-chain model predict well the three deformation modes compare to the classical eight-chain model.
1 Introduction
Rubber-like materials have enormous applications, especially in industrial and engineering fields, such as tires, engine mounts, seals, conveyor belts, base isolations for protecting buildings and bridges from devastating earthquakes [1–5]. Such wide range of applications of rubbers makes the rubber mechanics as one of the major active fields of research in last several decades. Especially, the fast-growing numerical techniques such as the finite element method facilitate sophisticated design and analysis for complex large strain three-dimensional elastomeric components. In the development of numerical models, a simple but advanced constitutive model to capture multiaxial data is an essential ingredient. The large deformability together with recoverability of rubber-like materials are well known for their highly nonlinear load-deformation behavior. These materials are generally modeled by considering homogeneous, isotropic, incompressible or nearly incompressible, geometrically and physically nonlinear (visco) elastic solids. Such idealizations are also supported by experimental data [6, 7].
In the literature [8, 9], elastomeric material models are generally classified into two main categories: purely phenomenological- and micromechanical-based network models. The micromechanically motivated network models, on the one hand, are based on the statistics of cross-linked long chain molecules [8] and the phenomenological models, on the other hand, involve invariant or principal stretch-based macroscopic continuum formulations generally having polynomial structures. The governing parameters appearing in the proposed expressions of the energy functions of the phenomenological models do not have, in most of the cases, any physical interpretation. The three-chain, four-chain, eight-chain, full network models, tube-model, extended-tube model, Flory-Erman model, micro-macro unit sphere model, and the Kroon model are well-known micromechanically inspired models, which can be used for moderate to large elastic deformations of polymeric materials, see for example, Boyce and Arruda [8], Arruda and Boyce [10], Miehe et al. [11], Hossain and Steinmann [9]. Some well-known phenomenological models are Neo-Hooke, Mooney-Rivlin, Ogden, Gent, Yeoh, Attard, Shariff, Hart-Smith, van der Waals, Lopez-Pamies, Pucci-Saccomandi, Carroll, etc., for more details, see Hossain and Steinmann [9] and Steinmann et al. [12].
As mentioned earlier, numerous constitutive models have been proposed during the last several decades to describe the elastic response of elastomers, but only a few of them are able to satisfactorily reproduce experimental data for different deformation modes, that is, uniaxial and biaxial extensions, simple and pure shears. According to Marckmann and Verron [13], the promising candidate for the best model will be the one that can describe the complete behavior of elastomers with a minimal number of material parameters that can be determined from explicit experimental data without facing any difficulty, for example, instability. Marckmann and Verron [13], after comparing 20 models, placed the extended tube model [14], Shariff model [15], micro-macro unit sphere model [11], and Ogden [16, 17] model at the top of their ranking list. Earlier, Boyce and Arruda [8] conducted an excellent review on several hyperelastic models where they utilized Treloar’s experimental data for comparison of three type of deformations (uniaxial, biaxial, and pure shear).
The eight-chain model is a classical micromechanically motivated constitutive model for polymeric materials, where the governing parameters have direct links to the micromechanics of the polymer molecular structures. With only two material constants, this model excellently captures major classical experimental data available in the literature. Despite its excellent performance to capture the uniaxial and pure shear data in the case of Treloar, the model prediction faces a significant deficiency to calibrate the equibiaxial data [8, 18]. Several modified versions of this model were proposed over the last two decades to show a better performance in the equibiaxial range. Some variants are of structural types, whereas the extended or modified parts of some other variants are based purely on phenomenological consideration, cf. [19]. For the sake of modifications over the classical one, some models increase the number of parameters to fit the data, for example, Bechir model [20], whereas some remain with the two parameters, for example, the bootstrapped eight-chain model [18]. Some well-known modified versions of the Arruda-Boyce model are the modified Flory-Erman model [8, 21], Gornet-Desmorat (GD) model [19], bootstrapped eight-chain model [18], Bechir model [20], Meissner-Matejka model [22], and the Kroon model [6]. When a modified model is proposed aiming to show better results in contrast to the original eight-chain model, the modified version is usually compared with the original one but the comparison among the variants of the eight-chain model are not demonstrated so far in the literature. Therefore, such comparative study can work as a guideline for a beginner who wants to work in rubber mechanics to choose an appropriate model from several variants.
The full-network model is also a micromechanically inspired model where polymer chains are assumed to be randomly oriented in space. Due to the computational cost for the integration over a sphere, either analytically or numerically, several simplified approaches for this model have been proposed in the literature [23–25] where analytical or numerical integration over the sphere is bypassed. For this study, we have selected the modified full-network model due to Wu and Giessen [23] and the another one that is proposed in Zuniga and Beatty [24]. The aim of the current study is to present a comparative study among all modified versions so far available in the literature, at least to the best of the author’s knowledge.
The paper is structured as follows: in Section 2 we briefly review the general framework for the derivation of (semi) analytical stress-strain relations from arbitrary free energy functions for the homogeneous cases. In Section 3, the analytical formulations for the three homogeneous deformation modes, that is, uniaxial tension (UN), equibiaxial tension (EB), and pure shear (PS) are derived for all selected models. These are necessary to evaluate the performance of all chosen models in reproducing the experimental data provided by Treloar [26]. To this end, a standard fitting tool is applied to calculate the optimal model parameters with respect to each set of Treloar’s data. Section 3 also presents a comparative study on six modified models along with the original eight-chain and full-network models. Finally, concluding remarks close the paper.
2 Analytical formulations
Concerning comparison of a novel model with the existing one (s), most of the authors used constitutive (semi) analytical expressions and the classical Treloar data. Since these data are given in pairs of principal stretches λi and principal 1st-Piola-Kirchhoff (PK) stresses Pi for different deformation modes, for example, UN, EB, and PS, the analytical formulations for the principal 1st-Piola-Kirchhoff (PK), that is, Pi(λi) need to be derived from the particular free energy function. Then, in order to compare the analytical expression with the experimental data, an optimal set of material parameters for each model and a particular deformation mode has to be identified. For the parameter identification, different optimization techniques can be used. The material investigated by Treloar is characterized as isotropic and incompressible, a case for which principal stretches and 1st-PK stresses are related by
where p denotes the hydrostatic pressure that has to be determined from appropriate boundary conditions, for details see [8, 9]. For the case of invariant based models, that is,
Using Eqs. (1) and (2) we derive the required analytical formulations for the three homogeneous deformation modes. For further details, see Hossain and Steinmann [9] and Steinmann et al. [12]. To identify the material parameter set for each model, an open-source computer code, TRESNEI is used. The code is suitable for bound-constrained nonlinear least-square problems, cf. [27]. For the validation of each model, each set of optimal material parameters for UN, EB, and PS is used to compute the response of the other two deformation modes. Each subsection contains the corresponding figures that also contain the errors between (i) each experiment and its optimal fit, for example, Error(UN-fit) and (ii) the simulations of the other deformation modes and their respective measurements, for example, Error(EB-sim). All error calculations have been performed according to the relation below
that is, sum up the squared differences between fitted/simulated and measured first Piola-Kirchhoff stresses, respectively, averaged by the number of data points M (stretches) available for each deformation mode.
3 Comparative study: model performances
3.1 Eight-chain model
In this model, the cuboid volume element, cf. Figure 1 is assumed to have edges parallel to the principal directions, which is composed of eight chains (hence the name eight-chain model) oriented in the diagonals from the center of the volume to its corners. The relation between edge length a0 of the cuboid and the chain length r0, in the undeformed state, is given by simple geometric relations,
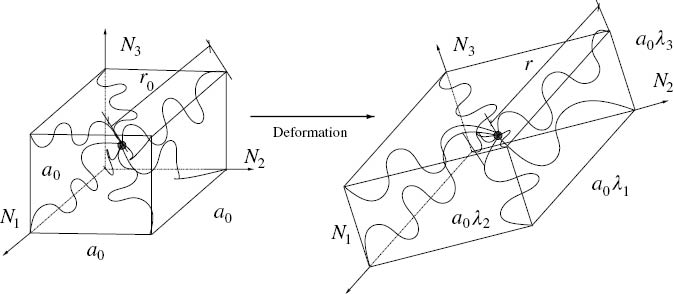
Eight-chain model: initial and deformed chain orientations and stretches.
In Eq. (4), I1 is the first invariant of C, that is, I1=trC. Inserting the Langevin statistics of a single chain, the free energy can be obtained as
with the relative chain stretch
The analytical Pi(λi)-relations for the three deformation modes UN, EB, and PS, which are required to check the performance of the model on the Treloar data, are obtained from Eq. (1) as
Note that in approximating the inverse Langevin function (γ), the Padé approximation is applied due to its superior performance over other approximation procedures, that is,
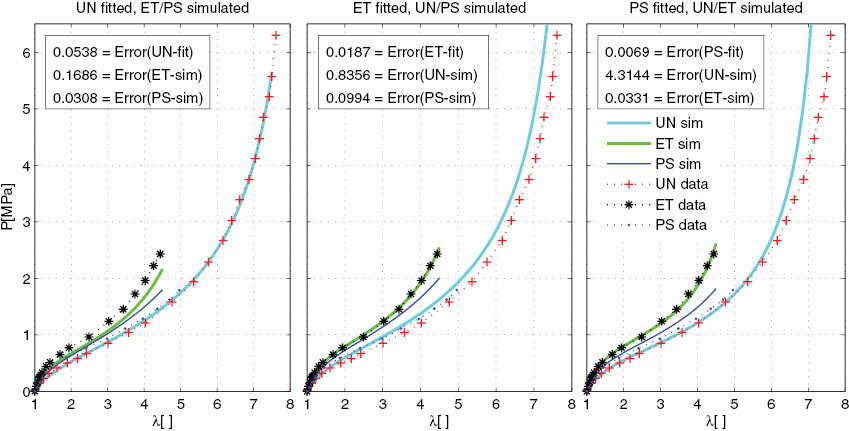
The optimal material parameters obtained by using analytical expressions are utilized to simulate the experimental data of the other two deformation modes and their corresponding errors with respect to the Treloar data are calculated. The results, cf. Figure 2 are obtained by inserting the Padé approximation of the inverse Langevin function in the free energy function. It is clear from the Figure 2 that with a least number of material parameters, that is, two, this model produces better results in all deformation modes.

Performance of the eight-chain model on the Treloar data. The fittings and simulations in two deformation modes (UN and EB) are good to excellent except in the pure shear case where the prediction fails to reproduce the S-shape of uniaxial case at high strains. Uniaxial simulation and fitting are almost concident (left), whereas equibiaxial simulation overestimates the Treloar data.
3.2 Modified Flory-Erman model
In most of the micromechanically inspired models, authors derive the energy functions by considering only the contributions from the cross-linking of polymer chains, whereas the contributions due to entanglements have been neglected. Boyce and Arruda [8] proposed a modification of their original model by adding a constraint term devised by Flory and Erman [21]. The assumption of Flory and Erman is that a long macromolecule network consists of numerous chain connection points, which are constrained from phantom characteristics due to the presence of neighbouring chains. As a result, the elastic strain energy of the network is originated from two contributions, that is, the phantom (ΨΨph) and the topological constraint (ΨΨct) contributions as
Flory and Erman [21] derived the phantom part of the energy function from the Gaussian chain statistics, equivalent to the Neo-Hookean case, that is,
with
where μ, N, γ, λc,r are defined in Section 3.1.
The constraint contribution of the stress-stretch relations has to be derived from the single differentiation of the constraint part of the energy function appearing in Eq. (11) and is demonstrated in Appendix A. If the analytical expressions for UN, EB, and PS fit to the corresponding Treloar data, the optimal material parameter sets are found to be
Each of the parameter sets is used to simulate the experimental data of other two deformation modes. The results are plotted in Figure 3 as well as the corresponding errors from both fitting and simulation of experiments not used for the parameter identification. In comparison to the original eight-chain model, it is interesting to note that the inclusion of the constraint contribution to the eight-chain energy function improves the simulation for the EB in all three deformation cases as well as the simulations for UN and EB by the PS-fitted parameters, cf. Figure 3 (right). A small drawback of the modified model is that the additional contribution for the topological constraint yields a complicated lengthy expression for the stress-stretch relationships, see Appendix A.
![Figure 3: Performance of the Flory-Erman model modified by the eight-chain energy function on the Treloar data. The fitting quality and predictions are excellent, especially if compared to the similarly structured models, for example, the original eight-chain model or the Gent model, cf. Steinmann et al. [12].](/document/doi/10.1515/jmbm-2015-0002/asset/graphic/jmbm-2015-0002_fig3.jpg)
Performance of the Flory-Erman model modified by the eight-chain energy function on the Treloar data. The fitting quality and predictions are excellent, especially if compared to the similarly structured models, for example, the original eight-chain model or the Gent model, cf. Steinmann et al. [12].
3.3 GD model
To improve the prediction capability in multiaxial loadings for rubber-like materials, very recently Gornet et al. [19] proposed a strain energy function based on the first and second strain invariants of the right Cauchy-Green tensor. The first part is dependent on the first invariant and it corresponds to the Hart-Smith model. The equivalence between the eight-chain model and I1-dependent part of the Hart-Smith model is established by Chagnon et al. [28]. To enhance the phantom network, that is, the cross-link part expressed by the first invariant I1, an additional function based on I2 is added to the energy function. Gornet et al. [19] show that such addition will constrain the eight-chains by a new network of chains on the surfaces of the cube, which mimics the behavior of the constraint contribution. Finally, the energy function of the GD model is expressed as
where h1, h2, h3 are material parameters. Evaluation of Eq. (2) provides the corresponding analytical formulations for the UN, EB, and PS cases:
By calibrating the UN, EB, and PS equations to the corresponding Treloar data, the optimal material parameters are found:
For validity of this model, each parameter set obtained from the optimization tool is used to simulate the other two deformation modes. The results are plotted in Figure 4 together with fitting and simulation errors in each case. It can clearly be shown here that the simulations for the EB and PS by the UN-fitted parameters produce results that are quantitatively much more acceptable than any other of the previous models with the same number of parameters, cf. Figures 4 (left and right). The simulations for the EB-fitted parameters overestimate the UN and PS data, cf. Figure 4 (middle), whereas the predictions for the PS-fitted parameters are good to fair, cf. Figure 4 (right).

Comparison between the GD model and the Treloar data. Fitting to the analytical formulations and model prediction quality are excellent, especially in UN and PS. Only predictions for the EB-fitted parameters overestimate the UN and PS data.
3.4 Bootstrapped eight-chain model
In an attempt to improve the results for the eight-chain model at small strain, a new model called bootstrapped eight-chain model with only two material parameters (same as in the original eight-chain model) is proposed by Miroshnychenko and Green [18, 29]. They further assume that in order to improve results, especially in the biaxial deformation, an additive form of the strain energy function that involves two functions, one depends on the first invariant and the other on the second invariant of a deformation tensor, has to be formulated. Such an assertion is also supported by Pucci and Saccomandi [30], Hart-Smith [31]. The full strain energy function of the bootstrapped eight-chain model is written as:
where i1=λ1+λ2+λ3 and the definitions of λc, N are given in Section 3.1. For the complete expression of the eight-chain model, previous subsection is referred. The energy function from Eq. (16) yields three principal stresses as
Using Eq. (17), the analytical formulations for the three different deformation modes, that is, UN, EB, and PS are derived as
In Eqs. (18–20),
Fitting the analytical Eqs. (18–20) to Treloar’s data yields the following parameter sets
Figure 5 depicts all fits, the simulations of complementary deformation modes that are not used during optimization and the deviations in comparison to the Treloar’s data. Both fitting quality and validity of the identified parameters are very good to excellent in the UN and EB cases. Optimization with respect to the PS data provides parameter sets that fail to predict the UN data, cf. Figure 5 (right). Similar to the classical eight-chain model, the bootstrapped model also fails to predict the S-shape in the case of UN for PS-fitted parameters. After analyzing the errors, fittings, and the validation results, it can be concluded that with the same number of parameters, the bootstrapped eight-chain model illustrates better performance in all deformation modes than the classical eight-chain model.

Performance of the bootstrapped eight-chain model on the Treloar data. The fittings and simulations are good to excellent, especially if compared to the similarly structured models, for example, the original eight-chain model or the two-parameter Gent model.
3.5 Meissner-Matějka model
Based on the fact that to cope with the experimental data, not only the contribution from the cross-link part, but also a constraint term in the energy function is essential, Meissner and Matějka [22, 32] proposed an energy function where the cross-link term is derived from the structure-based Arruda-Boyce model and the constraint part is based on the first invariant of the generalized deformation tensor. Note that here the constraint part is exactly same as the constraint part in the extended tube model proposed by Kalikse and Heinrich [33]. Then, the total energy function is expressed:
where μ, N, μe, β(0<β≤1) are material parameters. The definitions of λc,r, γ are given in Section 3.1. Evaluation of Eq. (1) provides the corresponding analytical formulations for the UN, EB, and PS cases:
where λcu, λcb, λcp are defined in Eqs. (6–8). If one fits the UN, EB, and PS equations to the corresponding Treloar data, the optimal material parameters are found to be:
Concerning validity of this model, all resulting curves and corresponding errors in comparison with Treloar’s data are summarized in Figure 6. It reveals excellent fitting and validity of the model in all deformation modes. During optimization for the parameter identification, an important parameter, that is, β (0<β≤1) is kept frozen (β=0.2) as suggested by Kaliske and Heinrich [14] for better fitting and simulation of the Treloar data, even if it can be determined during parameter identification. Note that due to the presence of the constraint contribution in the energy function, the simulations for the equibiaxial case are better than the original eight-chain model. The predictions for the UN and PS cases by the EB-fitted parameters slightly overestimate the Treloar data, cf. Figure 6 (middle). In addition, it can be noted that this model captures all deformation mode data excellently if it is compared to the similarly structured three-parameters model, for example, the modified Flory-Erman model or the Gornet-Desmorat (GD) model.
Performance of the Meissner-Matějka model on the Treloar data. The fitting quality and model predictions are excellent in all deformation modes.
3.6 Bechir model
As mentioned earlier, the classical eight-chain model ignores the contribution from the entanglements-like physical cross-links during deformation of the network. To add the effects of the interactions between chains of the cross-linked network, an extra energy function, in addition to the eight-chain energy function, is appended. The free energy of the constraint network is idealized using the standard three-chain energy function and the free energy of the unconstrained idealized network is constructed by means of the eight-chain model. Therefore, according to Bechir et al. [20], the total free energy function of this model is merely a combination of the two chain models, that is,
where
where
Fitting UN, EB, and PS equations to the corresponding Treloar data, the optimal material parameters are obtained to be
To study the model performance, each parameter set obtained from the optimization tool is used to simulate the other two deformation modes. The results are plotted in Figure 7 together with fitting and simulation errors in each case. Although, this model inherits more parameters, that is, five in total, but it can be clearly seen that each set of optimal parameters produces simulation results for the complementary deformation modes that are not quantitatively improved than any other of the previous models of less parameters.

Performance of the Bechir model on the Treloar data.
3.7 Wu-Giessen model
Several authors [23, 24, 34, 35] coin the term “full-network” where the chains are assumed to be randomly oriented in space for which the strain energy function is derived by integrating the response of all chains over the space. Since the numerical integration for such a full-network model is computationally costly, a weighted average is proposed by combining the three-chain and the eight-chain formulations which might provide better results than the individual three-chain or the eight-chain model [23], that is,
where the parameter ρ is a constant or related to some other physical quantity which is for instance related to the deformation process and Ψ3c, Ψ8c are energy functions for the three-chain and eight-chain models, respectively. Such form of the full-network model was proposed by Wu and Giessen [23] to improve the modeling capacity for amorphous glassy polymers, for example, polycarbonate, where the hyperelastic energy function is used for modelling the so-called back stress. Frequently used relation for ρ is
where
Similar to other models, each parameter set of this model obtained from the fitting procedure is used to simulate the other two deformation modes and the corresponding errors are tabulated. The full-network model suggested by Wu and Giessen [23] predicts a biaxial stress-stretch response which falls in between the results predicted by the eight-chain model and that predicted by the three-chain model. Aiming at better performance over the eight-chain model or the three-chain model, the capability of this model to reproduce the experimental data for all deformation modes does not show any significant improvement so far, cf. Figure 8.

Performance of the full-network model on the Treloar data.
3.8 Zuniga-Beatty model
Zuniga and Beatty [36] at first amend the original eight-chain and three-chain models by using a modified non-Gaussian (Kuhn-Grün) probability function in the case of energy function derivation. Jernigan and Flory [37] show that an amended distribution function, in contrast to the Kuhn-Grün function, provides a much improved approximation to the exact result over the entire range of λγ (relative chain stretch) values. Therefore, Zuniga and Beatty [36] rederive the energy functions for the eight-chain and three-chain models using the amended distribution function. Then, a modified full-network model is proposed by combining the amended versions of the eight-chain and three-chain models in the line of Wu and Giessen [23] concept. Wu and Giessen [23] assume the same value for the number of chain segments, that is, N for the eight-chain and three-chain models, which is unjustified due to inherent geometrical considerations of these two models. Hence, Zuniga and Beatty [36] propose separate values for N, that is,. N3, N8 for the three-chain and eight-chain models, respectively. Due to the amended form for the probability function, the energy functions of the eight-chain and three-chain models are as follows
and
In Eqs. (31) and (32),
where
In Eq. (34), ΛL is related to the principal stretches through the state of deformation to which the continuum is subjected so that the greater stretch λ1=ΛL and the chain stretch for the eight-chain model is
where the expressions for
Concerning the validity of the model, the parameter set obtained from the optimization tool in each deformation case is used to simulate the other two deformation modes. The results are plotted in Figure 9 together with fitting and simulation errors in each case. The fittings and simulations for UN- and EB-fitted parameters are good to excellent in predicting the data for other deformation modes except a small overestimation is observed for the PS data. It can be clearly stated here that with an additional parameter, the Zuniga-Beatty version of the full-network shows better performance than the Wu-Giessen version. The reason might be that (i) Zuniga-Beatty used an improved version of the probability function and (ii) the scaling factor (ρ, in the original version of Wu-Giessen model) is replaced by a deformation-dependent stretch, cf. Eq. (34).

Performance of the Zuniga-Beatty version of the full-network model on the Treloar data. The fitting and simulations in all deformation modes are excellent except an underestimation occurs in the case of UN data for the PS-fitted parameters.
4 Conclusion
In this paper, a comparative study on the classical eight-chain and full-network models and six of their modified versions is presented. Some of the modified versions are of phenomenological types, whereas others are originated from the micromechanics of chain molecules. In order to perform the comparative study, the analytical formulations in the case of three different deformation modes of the eight selected models are derived. Then, the performance evaluation is highlighted of all selected models in reproducing the classical experimental data of Treloar. This study demonstrates that the two-parameter bootstrapped eight-chain model predicts the Treloar data better than the classical eight-chain model. Note that several constitutive models, that is, the modified Flory-Erman model, the Meissner-Matějka model, the GD model, which consider constraint contribution in deriving their free energy functions, predict all three deformation modes quite reasonable than the classical eight-chain model. However, the Bechir model with five parameters does not show improved results in comparison to the original eight-chain model. In the case of full-network model, the Zuniga-Beatty version with an improved probability function for chain statistics shows better performance than the Wu-Giessen form of full-network model. Such performance analysis will help a design engineer or a beginnner in rubber mechanics to choose whether the classical eight-chain model or full-network model or one of their modified versions is appropriate from a considerable number of rubber-like material models available in the literature.
Appendix A: Derivatives of the Flory-Erman energy function (constraint part)
To derive the analytical formulations for different defomation modes, the single derivatives of the energy function (constraint part) of the Flory-Erman model expressed in principal stretches are essential, that is,
Appendix B: Analytical expressions for the amended three-chain and eight-chain models
The analytical expressions for the amended three-chain and eight-chain models for different deformation modes, that is, UN, EB, and PS are as follows:
Uniaxial tension (UN):
where,
Equibiaxial tension (EB):
where,
Pure shear (PS):
where,
References
[1] Amin AFMS. Constitutive Modeling of Strain-Rate Dependency of Natural and High Damping Rubbers. PhD Dissertation, Saitama University: Japan, 2001.Suche in Google Scholar
[2] Amin AFMS, Wiraguna SI, Bhuiyan AR, Okui Y. J. Eng. Mech. ASCE 2006, 132, 54–64.10.1061/(ASCE)0733-9399(2006)132:1(54)Suche in Google Scholar
[3] Amin AFMS, Lion A, Sekita S, Okui Y. Int. J. Plasticity 2006, 22, 1610–1657.10.1016/j.ijplas.2005.09.005Suche in Google Scholar
[4] Milani G, Milani F. J. Eng. Mech. ASCE 2012, 138, 416–428.10.1061/(ASCE)EM.1943-7889.0000340Suche in Google Scholar
[5] Sahu RK, Patra K. Adv. Mater. Res. 2013, 685, 331–335.Suche in Google Scholar
[6] Kroon M. J. Elasticity 2011, 102, 99–116.10.1007/978-1-61779-246-5_6Suche in Google Scholar
[7] Hossain M, Vu D K, Steinmann P. Comp. Mater. Sci. 2012, 59, 65–74.Suche in Google Scholar
[8] Boyce MC, Arruda EM. Rubber Chem. Technol. 2000, 73, 504–523.Suche in Google Scholar
[9] Hossain M, Steinmann P. J. Mech. Behav. Mater. 2013, 22, 27–50.Suche in Google Scholar
[10] Arruda EM, Boyce MC. J. Mech. Phys. Solids 1993, 41, 389–412.10.1016/0022-5096(93)90013-6Suche in Google Scholar
[11] Miehe C, Göktepe S, Lulei F. J. Mech. Phys.Solids 2004, 52, 2617–2660.10.1016/j.jmps.2004.03.011Suche in Google Scholar
[12] Steinmann P, Hossain M, Possart G. Arch. Appl. Mech. 2012, 82, 1183–1217.Suche in Google Scholar
[13] Marckmann G, Verron E. Rubber Chem. Technol. 2006, 79, 835–858.Suche in Google Scholar
[14] Kaliske M, Rothert H. Eng. Computations 1997, 14, 216–232.10.1108/02644409710166190Suche in Google Scholar
[15] Shariff MHBM. Rubber Chem. Technol. 2000, 73, 1–18.Suche in Google Scholar
[16] Ogden RW. P. Roy. Soc. Lond. A Mat. 1972, 326, 565–584.Suche in Google Scholar
[17] Ogden RW, Saccomandi G, Sgura I. Comput. Mech. 2004, 34, 484–502.Suche in Google Scholar
[18] Miroshnychenko D, Green WA. Int. J. Solids Structures 2009, 46, 271–286.10.1016/j.ijsolstr.2008.08.037Suche in Google Scholar
[19] Jerrams S, Murphy N, Eds. Constitutive Models for Rubber VII: Proceedings of the 7th European Conference on Constitutive Models For Rubber, Dublin, Ireland. CRC Press (Taylor & Francis Group, Leiden, The Netherlands), 2012, 265–271.10.1201/b11687Suche in Google Scholar
[20] Bechir H, Chevalier L, Idjeri M. Int. J. Eng. Sci. 2010, 48, 265–274.Suche in Google Scholar
[21] Flory PJ, Erman B. Macromolecules 1980, 15, 800–806.10.1021/ma00231a022Suche in Google Scholar
[22] Meissner B, Matejka L. Polymer 2003, 44, 4599–4510.10.1016/S0032-3861(03)00411-7Suche in Google Scholar
[23] Wu PD, van der Giessen E. Mech. Res. Commun. 1992, 19, 427–433.Suche in Google Scholar
[24] Elias-Zuniga A. Polymer 2006, 47, 907–914.10.1016/j.polymer.2005.11.078Suche in Google Scholar
[25] Itskov M, Ehret AE, Dargazany R. Math. Mech. Solids 2010, 15, 655–671.10.1177/1081286509106441Suche in Google Scholar
[26] Treloar LRG. Trans. Faraday Soc. 1944, 40, 59–70.Suche in Google Scholar
[27] Morini B, Porcelli M. Comput. Optim. Appl. 2012, 51, 27–49.Suche in Google Scholar
[28] Chagnon G, Marckmann G, Verron E. Rubber Chem. Technol. 2004, 77, 724–735.Suche in Google Scholar
[29] Miroshnychenko D, Green WA, Turner DM. J. Mech. Phys. Solids 2005, 3, 748–770.10.1016/j.jmps.2004.10.006Suche in Google Scholar
[30] Pucci E, Saccomandi G. Rubber Chem. Technol. 2002, 75, 839–851.Suche in Google Scholar
[31] Hart-Smith LJ. Z. Angew. Math. Phys. 1966, 17, 608–626.Suche in Google Scholar
[32] Meissner B, Matejka L. Polymer 2004, 45, 7247–7260.10.1016/j.polymer.2004.08.029Suche in Google Scholar
[33] Kaliske M, Heinrich G. Rubber Chem. Technol. 1999, 72, 602–632.Suche in Google Scholar
[34] Treloar LRG, Riding G. Proc. R. Soc. Lond. 1979, A369, 261.Suche in Google Scholar
[35] Beatty MF. J. Elasticity 2003, 70, 65–86.10.1023/B:ELAS.0000005553.38563.91Suche in Google Scholar
[36] Elias-Zuniga A, Beatty MF. I. J. Eng. Sci. 2000, 40, 2265–2294.Suche in Google Scholar
[37] Jernigan RL, Flory PJ. J. Chem. Phys. 1969, 50, 4185–4201.Suche in Google Scholar
©2015 by De Gruyter
This article is distributed under the terms of the Creative Commons Attribution Non-Commercial License, which permits unrestricted non-commercial use, distribution, and reproduction in any medium, provided the original work is properly cited.
Artikel in diesem Heft
- Frontmatter
- Analysis of serrations and shear bands fractality in UFGs
- Eight-chain and full-network models and their modified versions for rubber hyperelasticity: a comparative study
- Microstructural evolution and sliding wear studies of copper-alumina micro- and nano-composites fabricated by spark plasma sintering
- Nonlinear FE simulations of structural behavior parameters of reinforced concrete beam with epoxy-bonded FRP
- Torsional wave propagation in an inhomogeneous crustal layer over an inhomogeneous elastic half space
- Control of a legged robot
- Finite element prediction of seismic response modification of monumental structures utilizing base isolation