HICP and National CPI in Germany: As Similar as Possible, as Different as Needed
-
Thomas A. Knetsch
 ,
Dilyana Popova
,
Dilyana Popova

Abstract
The harmonised index of consumer prices (HICP) co-exists with the national consumer price index (CPI) as a key measure of inflation in Germany. Both indices are based on the same granular price data and uniform compilation methods at the lower levels of aggregation. However, differences arise at the upper level, concerning e.g. coverage, index formula, weighting schemes and revision practices. Weighting is a major source of differences but its impact is expected to diminish because, in the last base year changeover, national accounts replaced household budget surveys as the dominant source for deriving five-year fixed CPI weights. This change increases conformity with the annual updating procedure for HICP weights. By contrast, the integration of the cost of owner-occupied housing (OOH) into the HICP might increase the differences between these key measures if, following the ECB’s request in its 2020/2021 Monetary Policy Strategy Review, the acquisition approach were implemented. Choosing different options can be rationalized with a number of criteria (e.g. alignment with user interest, main purposes, public acceptance, practicality). As differences matter empirically, communication is important.
1 Introduction
Consumer price inflation in Germany is measured with two key indicators – the national consumer price index (CPI) and the harmonised index of consumer prices (HICP). The two indices give, to a large extent, rather similar signals regarding price developments. In quantitative terms, however, CPI and HICP inflation rates often deviate somewhat from each other; in most cases, the deviations are marginal, though they sometimes amount to a considerable size. This indicates that, despite many similarities in measurement concepts and practices, CPI and HICP are still characterized by notable differences. At first glance, these differences may come as a surprise because the sustained efforts towards European harmonization in price statistics have led to a convergence of national concepts to the European standard. However, country-specific peculiarities persist and this is for good reasons. In general, they may reflect varying measurement targets, but also specific traditions in index concepts and compilation techniques.
In this paper, we examine the differences between CPI and HICP inflation in Germany. We identify the various driving factors and assess their relative importance. Using two examples, we illustrate that current challenges in inflation measurement can make the case for either increasing or decreasing the degree of conformity between CPI and HICP. On the one hand, weighting has so far been a major source of deviations but its impact is expected to diminish because, in the last base year changeover, the national accounts replaced household budget surveys (HBS) as the dominant source for deriving five-year fixed CPI weights. This change increases conformity with the annual updating procedure for HICP weights and thus has the potential to reduce the impact of changing weights on HICP inflation in years of CPI base year changeovers.
On the other hand, the integration of owner-occupied housing (OOH) into the HICP would increase the differences between the two concepts if the net acquisitions (NA) approach were adopted because, in the CPI, OOH is measured by the rental equivalence (RE) approach. Even with the non-integration in the HICP so far, a substantive difference in coverage exists, frequently leading to marked contributions to the CPI-HICP inflation differences. We compile an OOH-augmented HICP and compare it with the CPI. We show that differences matter empirically, with deviations between OOH prices and imputed rents being much more important than differing OOH weights. Differences rose to a considerable size in 2021/2022 when house prices were on a steep upward trend and construction prices accelerated strongly. The revived discussion about integrating OOH into the HICP (ECB 2021a, 2021b; Eurostat 2023) demonstrates how important it is to derive methodological choices from measurement targets.
The paper kicks off with a focus on the measurement targets, concepts and methods characterizing the CPI and the HICP. In Section 3, we analyze the differences between CPI and HICP inflation and their driving factors. In Section 4, we elaborate on the compilation procedures for CPI and HICP weights. Section 5 is devoted to a discussion on how OOH should be dealt with in consumer price indices according to relevant criteria, what the practice in the CPI is and what the ECB Governing Council requests for the HICP. Empirical evidence on the impact of OOH on CPI and HICP inflation is also provided. In Section 6, we draw conclusions.
2 A Brief Comparison of CPI and HICP
Consumer price indices are multi-purpose indicators. An overview of the multitude of uses is given by ILO et al. (2020), for instance. From index number theory and practical experience, we know that, on the one hand, there are construction principles and properties which each and every consumer price index should share but, on the other hand, conflicting measurement targets may justify alternative methodological choices. In this section, we briefly compare the CPI and the HICP according to selected criteria. They are summarized in Table 1.
Comparing CPI and HICP according to selected criteria.
| Criterion | CPI | HICP |
|---|---|---|
| Objectives | Measure of consumer price inflation in Germany as a key macroeconomic indicator Compensation scale Deflating nominal values |
Measure of price stability in ECB’s monetary policy Indicator for assessing price convergence regarding a possible accession of a country to the monetary union Indexation of financial instruments |
| Scope | Prices of all goods and services that are purchased by households in Germany | Prices of all purchased goods and services which are part of household final monetary consumption expenditure |
| OOH treatment | Included using the RE approach | Excluded |
| Revision | At every base year changeover, recalculation applying the new weighting scheme as well as newly introduced methods and data back to the beginning of the new base year | Only in narrowly defined exceptional cases (e.g. errors, improved data sources and methods) |
| Index formulaa | Laspeyres index with five-year base year changeover | Chain-linked Laspeyres-type index with annual adjustment of weights |
| Data sources for item weightsa | HBS used as primary source up to changeover to base year 2015; national accounts since changeover to base year 2020 | Primary source as for the CPI, annual adjustment of weights using national accounts |
| Index concepta | Cost-of-goods index (COGI) | |
| Elementary level | Data sources and methods | |
-
aUpper aggregation level.
The measurement objectives of the CPI and HICP are different. The three main purposes of the CPI are listed in its quality report (Destatis 2023b, Section 2.2). First, it is a measure of consumer price inflation in the country. Second, it also plays a key role in indexation, informing decisions on the adjustment of wages, pensions, social security benefits and rents. Third, it is used for the deflation of macroeconomic statistics (e.g. national accounts). The HICP is designed to measure consumer price inflation in Europe according to harmonized principles. In particular, it informs monetary policy decisions in the euro area and allows the assessment of price convergence, which is one of the main criteria for adoption of the euro. According to Destatis (2023a, Section 2.1), it is applied to design inflation-linked bonds while it is generally not recommended to be used as a compensation scale.
CPI and HICP are built on the same granular data, and uniform concepts, methods and compilation techniques are applied up to the elementary level (Destatis 2023a, 2023b, Section 7.1). At the upper level of aggregation, however, differences become noticeable. While CPI and HICP are both cost-of-goods indices (COGI), meaning that the indices measure the total cost of a fixed basket of goods over time, they differ in terms of index concept, including weighting as well as coverage and revision practices.
The CPI is a Laspeyres index where the underlying basket is usually adjusted only once every five years.[1] Hence, it reflects pure price changes in the sense that the basket of goods is fixed from one base year to another. With a base year changeover, the weighting scheme is adjusted using rather detailed and reliable data on the consumption expenditure of households (Mai and Egner 2023, 19). When introduced, however, the new weights lag behind at least three years. On the contrary, the HICP is designed as a chain-linked Laspeyres-type index with an annual adjustment of weights (Eurostat 2024, Chapter 8). The adjustments are made to reflect households’ consumption structures in the previous year. While the consumption pattern underlying the CPI relies on a more reliable database,[2] the HICP reflects the aggregate price development using more up-to-date consumption structures.
As regards coverage, the CPI is based on the prices of all goods and services that are purchased by private households in Germany (Destatis 2023b, Section 2.1.3). Imputed prices are not excluded, making it possible to measure OOH by means of the RE approach. The scope of the HICP, however, is defined by the final monetary consumption expenditure of households (Eurostat 2024, Section 2.3). This concept generally excludes non-monetary and imputed transactions, placing OOH costs according to the RE approach outside the scope of the HICP (Eurostat 2024, Section 2.3.3). OOH costs according to the NA approach are not part of the final monetary consumption expenditure of households but complementary to it (Eurostat 2023, Section 3.6).[3] The actual coverage of the HICP is smaller than its scope because some categories are not covered as a principle (e.g. narcotics, prostitution) or on practical grounds (e.g. games of chance).[4] In the CPI, games of chance and broadcasting licence fees[5] are covered while narcotics and prostitution are excluded, too.
The CPI is revised on a regular basis. With the introduction of a new base year, the CPI is updated back to January of this base year through re-calculation using the new weighting scheme.[6] By contrast, the HICP is rarely revised. Apart from the fact that provisional figures are finalized, revisions may appear if an error is corrected, new or improved basic information is included or national methods are changed (Eurostat 2024, Section 10.4).
The differences in coverage and weighting are directly quantifiable, whereas deviations between the CPI and HICP due to revisions cannot be easily separated from other factors such as methodological issues. We carry out a decomposition analysis in the next section. We refer to the differing measurement objectives in the discussion about the treatment of the OOH cost in CPI and HICP (Section 5).
3 Decomposition of Differences in CPI and HICP Inflation
In this section, we decompose the differences between CPI and HICP inflation into the contributions from coverage and weighting, as well as a third component comprising the remaining differences. These refer to methodological issues and revision policy, among other aspects. We consider the monthly observations of the last four years. Owing to the back revision in the last base year changeover, the CPI inflation rate and its breakdown are homogenous during this period in methodological terms.
We first formally outline the decomposition of the difference between CPI and HICP inflation. Let us write the formulae of the HICP and the CPI as follows:
where
For the decomposition, we consider two auxiliary indices. They are CPIs by their very nature but meet some of the characteristics of the HICP. For instance, the first auxiliary index mimics the coverage of the HICP:
Apart from the coverage, the second auxiliary index additionally shares the (annually changing) weights with the HICP:
Inflation is defined by the annual percentage rate of the price index, denoted by
where co t,m is the effect from differences in coverage, we t,m from differences in weighting and mr t,m from differences in methodology/revision.
We compile the auxiliary indices using the most detailed HICP data publicly available. These are 275 items from the 5-digit level at maximum (H = 275). As shown in Figure 1, the deviations between CPI and HICP inflation are noticeable between mid-2021 and end-2023. They range between +0.9 percentage points (pp) and −2.7 pp in this period. The largest differences are observed throughout the year 2022, when HICP inflation surpasses CPI inflation by 1.0 pp at the minimum.
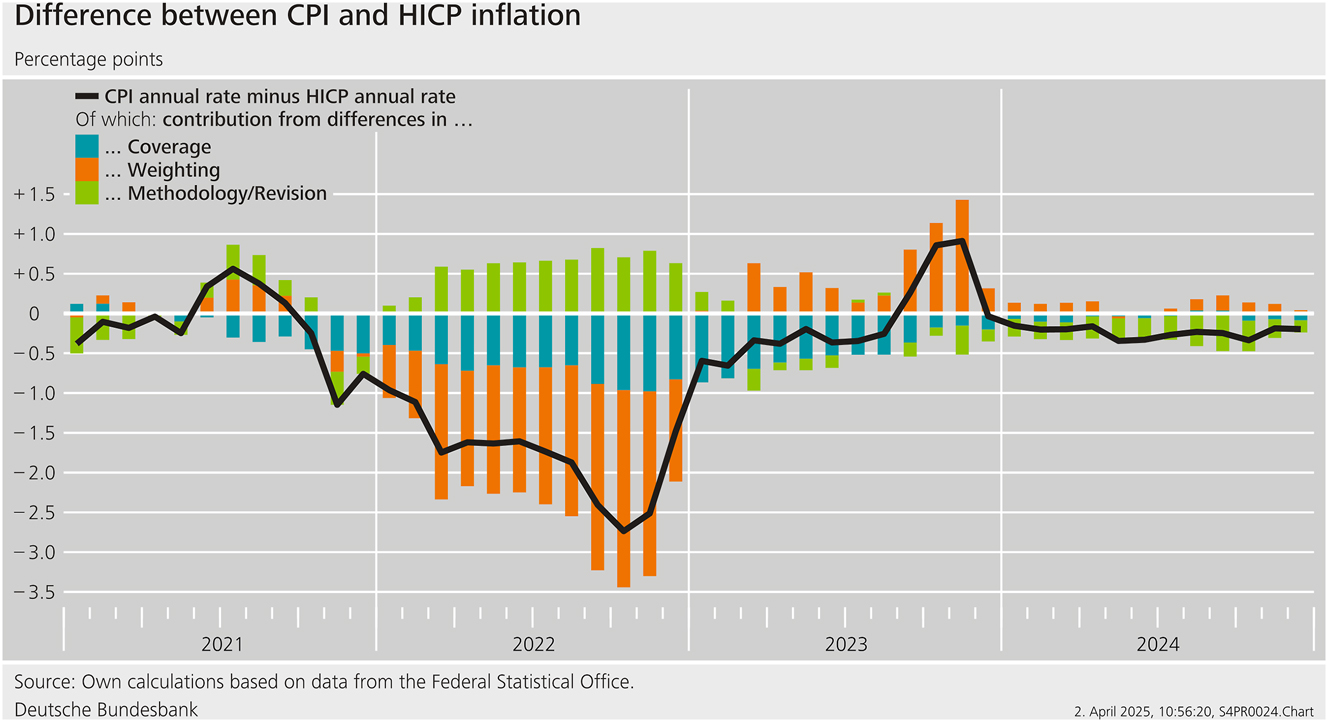
Difference between CPI and HICP inflation.
The 2022 deviations are largely driven by considerable contributions from differences in weighting. The differences in coverage make a noticeable contribution in this year too, while there is a mitigating impact from the remaining factors. In 2023, the impact from weighting differences turns from negative to positive. With differences in coverage still contributing negatively but at a diminishing scale, the overall effect turns positive towards the end of the year, implying that CPI inflation exceeds its HICP counterpart.[7] In contrast, in 2024 HICP and CPI are very similar.
In addition to the monthly observations of CPI-HICP inflation differences, we analyze summary metrics such as the mean deviation (MD) and the mean squared deviation (MSD), where we average over all observations t,m in the sample under consideration, denoted by subscript i = 1, …, I and I = 12T.
where COV = 2(COV co,we + COV co,mr + COV we,mr ) is the sum of the covariance terms.
The results are summarized in Table 2. On average over the years from 2021 to 2024, HICP inflation exceeds CPI inflation by 0.6 pp. The effect from differences in coverage is, in absolute terms, slightly larger than the effect from deviating weighting schemes. This is due to the fact that contributions from differences in coverage are negative almost throughout, whereas the more significant contributions from weighting differences oscillate around the zero line. By eliminating the sign impact, we prove the dominance of weighting differences for the explanation of the CPI-HICP inflation differential in the period under review. The root mean squared deviation of the weighting component is double the size of the coverage component, for instance.
Decomposition of the differences between CPI and HICP inflation.
| Position | Mean deviation (in pp) | Root mean squared deviation (in pp) | Share of mean squared deviation (in %) |
|---|---|---|---|
| Coverage | −0.4 | 0.5 | 23 |
| Weighting | −0.2 | 0.9 | 88 |
| Methodology/revision | 0.0 | 0.4 | 16 |
| Covariance | −28 | ||
| Total | −0.6 | 1.0 | 100 |
-
Sample period: January 2021 – December 2024. The decomposition is based on 275 HICP items from the 5-digit level at maximum.
From the decomposition analysis, we draw the conclusion that differences in coverage and weighting schemes are major sources of deviations between HICP and CPI inflation. In the next section, we focus on how the weighting schemes of the two indices are derived, what their common features are and in what respects they differ from each other. In Section 5, we address the topic of OOH (non-)treatment in the two indices, as this has been the crucial factor explaining the differences in coverage.
4 CPI and HICP Weighting Schemes
Both CPI and HICP weights are based on the fundamental claim that they reflect consumption patterns in a representative manner. Differences appear because the years to which the weighting schemes refer do not match. Recall from Section 2 that CPI weights reflect consumption structures in the base year, which usually change every five years, while HICP weights are adjusted annually to make them representative of the previous year. We henceforth call this year the weight reference period.[8]
Figure 2 gives an indication of the variability of weighting schemes. We calculate the mean absolute deviation (MAD) of item weights using data at the 4-digit level (i.e. 76 or 77 price items). In the five CPI base year changeovers under consideration, item weights change by 1.8 per mille points, on average. This exceeds the MAD of HICP weight changes (0.8 per mille points). This comes as no surprise considering the fact that consumption habits tend to change more markedly over a period of five years than from one year to another.
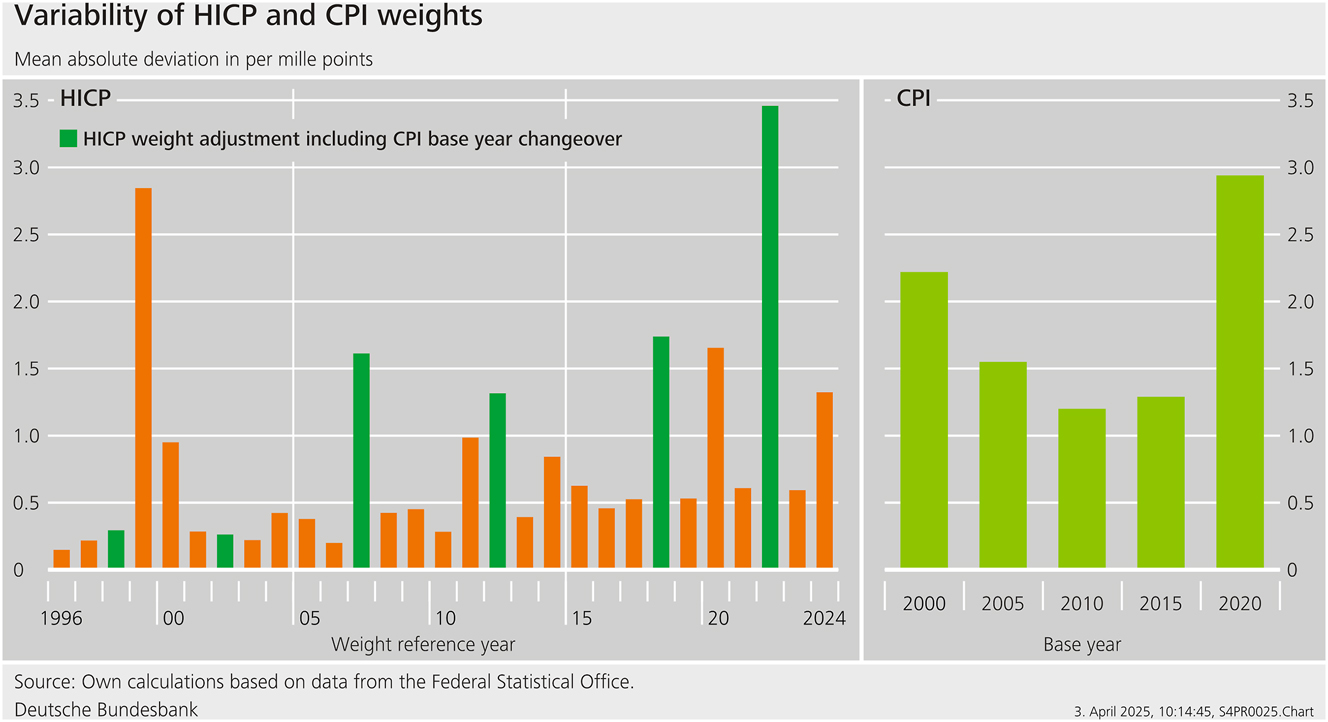
Variability of HICP and CPI weights.
While CPI base years refer to the years ending with a 0 or 5, they are introduced only at the beginning of the (subsequent) years ending with a 3 or 8.[9] In the years of introduction, HICP weights are affected by the CPI base year changeover. This causes more pronounced weight shifts. With 1.4 per mille points, the MAD of the annual HICP weight adjustments is lower in these years than the MAD of CPI weight shifts. This is in stark contrast to the variability of HICP weight shifts in the remaining years. On average, the MAD is 0.7 per mille points. Only the weight reference years 1999 and 2020 stand out. With the significant adjustment of HICP coverage (Destatis 2000, 148; ECB 2000), a statistical reason is crucial for the former case, while the latter is explainable by the considerable changes in consumption patterns caused by the outbreak of the COVID-19 pandemic.
In order to better understand why CPI weights are decisive for HICP weights, we elaborate on the compilation practice in the next part of this section. We follow up with an illustration of the effect of the CPI base year changeover on HICP weights for some special aggregates and selected items. In the final part of this section, we focus on the derivation of CPI weights.
4.1 Derivation of HICP Weights
According to the HICP regulation (EU 2020, Art. 3, 1), the expenditure shares of the penultimate year, for which national accounts data are usually available when the weights are updated, should be made representative for the weight reference year and then price-updated to December of the previous year. The Federal Statistical Office (Destatis) has implemented these legal requirements with a compilation procedure which can be described by the following formula (Elbel and Preißmann 2012):
where
The starting point for the derivation of the HICP weight of item h in year t is the respective CPI weight of the current base year b. Between 2012 and 2021, this weight had been updated from the base year to t−2 using private household consumption expenditure data from the national accounts. Since 2021, early and still unpublished national accounts data for t−1 have been taken instead in order to ensure representativeness during the COVID-19 pandemic.[10] On top of the updating with the private consumption ratio, there is a price update until December of the previous year, which is the price reference period of the HICP.
With the weight updating formula, it is possible to separate out the effect of the CPI base year changeover on HICP weights. In particular, we calculate hypothetical HICP weights using this formula for the years of, and prior to, the year of the CPI base year changeover. The differences between the actual and hypothetical weights are directly attributable to the base year changeover.
Figure 3 displays these changeover effects for HICP special aggregates which are of particular interest in monetary policy assessments. These are food and energy as well as the total excluding these two items. We henceforth call the latter HICPX. It is typically referred to as the special aggregate representing core inflation. With package holidays and gas, we additionally look at two selected items which are strongly affected by the changeover effects.
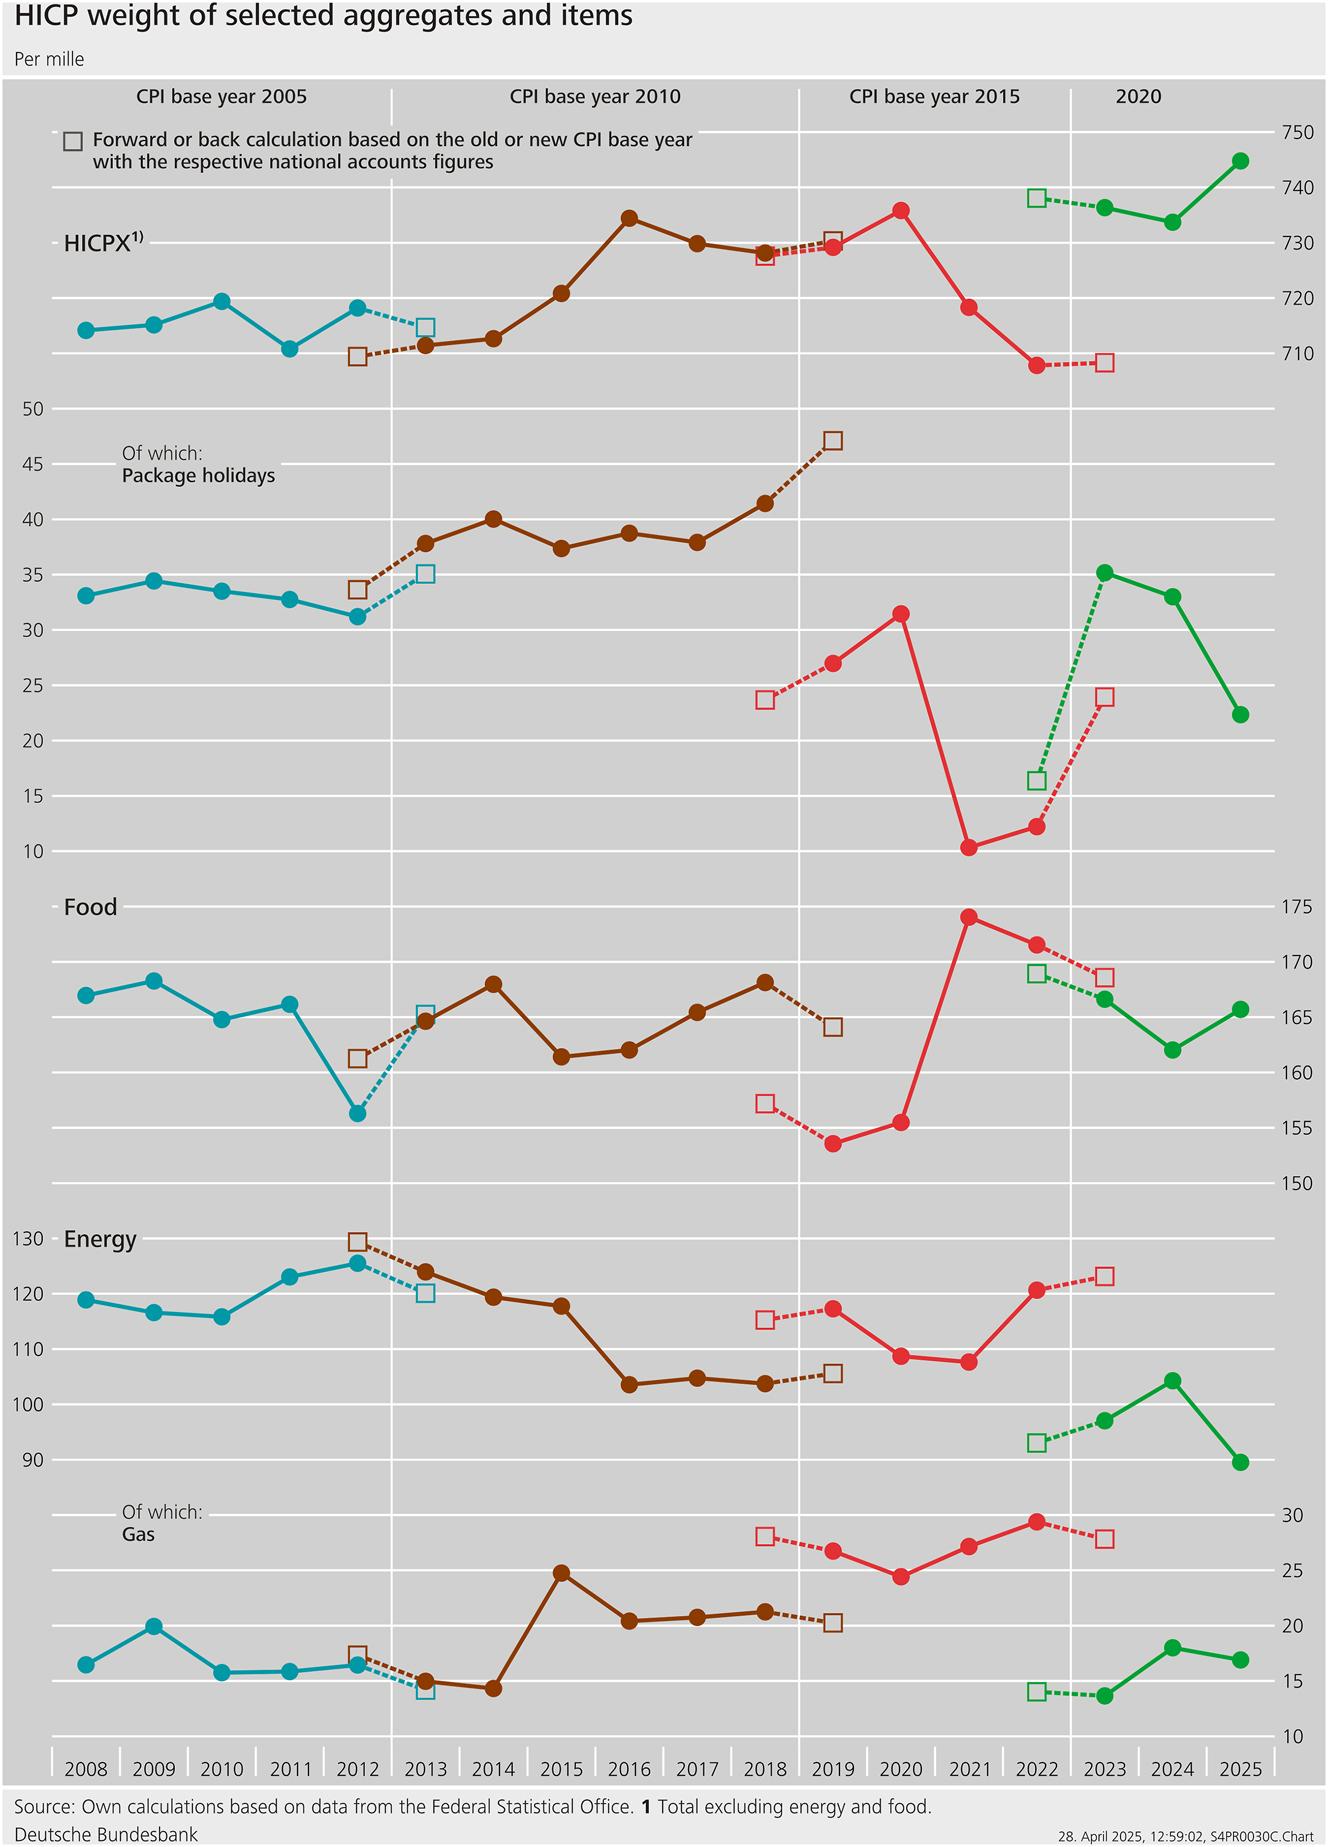
HICP weight of selected aggregates and items.
The adjustment of the HICPX weight from 2022 to 2023 is 2.9 pp and due solely to the CPI base year changeover, as both forward and back calculations based on the old and the new CPI base year, respectively, using national accounts would imply a marginal weight change. This magnitude is notable in comparison with the previous two CPI base year changeovers. The HICP weight of package holidays, which is a subcomponent of the HICPX, jumps by 2.3 pp from 2022 to 2023. This is larger than the decline observed in 2021 due to the COVID-19 pandemic. The normalization of the travel market explains a large part of this increase. From 2018 to 2019, the HICP weight of package holidays is reduced by 1.4 pp. This is solely caused by the changeover from base year 2010 to 2015.
As regards the adjustments of the HICP weight for food, the 2015 CPI base year changeover plays a significant role. It arithmetically contributes to about three-quarters of the weight decline by 1.5 pp. The last base year changeover exerts only a small effect. This is in stark contrast to the observation regarding the HICP weight of energy. It would increase slightly from 2022 to 2023 on the basis of national accounts data while the CPI base year changeover caused a marked drop by 2.4 pp. Concerning the HICP weight of gas, this changeover makes up the overwhelming part of the drop from 2.9 % in 2022 to 1.4 % in 2023. National accounts data would imply only a moderate decrease.
4.2 Derivation of CPI Weights
Against the backdrop that CPI base year changeovers may significantly affect HICP weights, it is worth studying the derivation of CPI weights in more detail. This is particularly important because, with the last base year changeover, the relative importance of the underlying data sources is altered. With effect from this base year changeover implemented at the beginning of 2023, Destatis decided to give national accounts priority over HBS data in the derivation of CPI weights.[11] Mai and Egner (2023, 23) associate this change with the requirement that national accounts data be the primary source of HICP weights as of 1 January 2023, while data from the most recent HBS and other sources are only complementary (EU 2020, Art. 3, 1a).
Owing to this rule, it comes as no surprise that the CPI weighting scheme referring to the base year 2020, implemented in January 2023, is rather similar to the structure of private consumption expenditure in the national accounts. As shown at the top of Figure 4, the differences between the CPI weight and the respective national accounts share are marginal for most of the 39 product items considered for the comparative analysis.[12] The largest deviations, which are found for purchases of vehicles (07.1) and goods and services for vehicles (07.2), as well as insurance services (12.5) and the residual category of other services (12.7), are in the range between 5 and 10 per mille points. On average over all product items under consideration, the absolute deviation is about 1.4 per mille points.
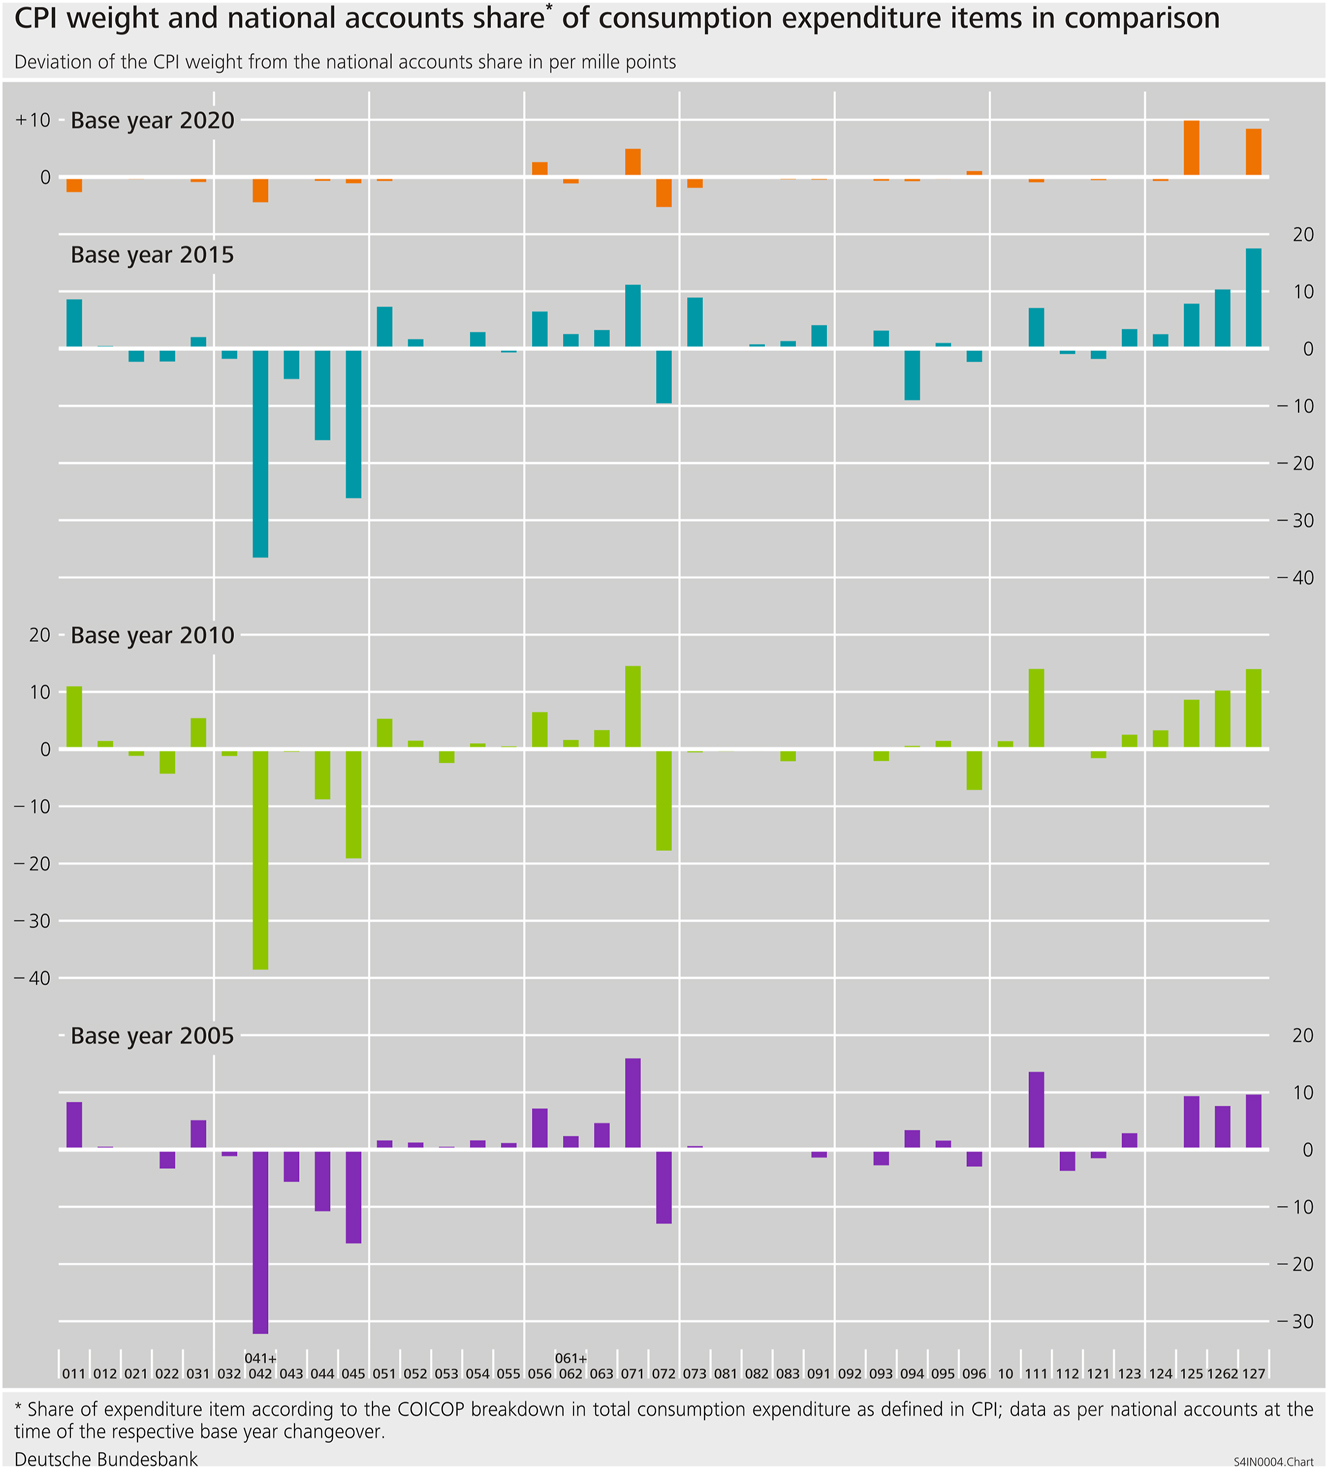
CPI weight and national accounts share* of consumption expenditure items in comparison.
By contrast, the MAD is considerably larger in the three preceding CPI base year changeovers, with 5.9 per mille points for 2015 = 100, 5.5 for 2010 = 100 and 5.3 for 2015 = 100. In Figure 4, we observe the differences not only in the above-mentioned categories but also in a couple of other categories. They belong to the COICOP position 04 (housing, water, electricity, gas and other fuels) and some services such as restaurants, recreation and culture, as well as package holidays.[13] In these cases, the differences between the CPI weight and the national accounts share are rather striking, exceeding 10 per mille points without exception and even partly reaching the interval between 20 and 40 per mille points.
The impact of OOH on headline and core inflation.
With the replacement of the old practice of a HBS-led weight compilation, well-known shortcomings such as outdated survey information and underreporting in specific categories (e.g. alcohol, tobacco) are overcome. In addition, the compilation of CPI weights and the updating procedure for HICP weights is now coherent in terms of the underlying primary data source. This leads us to expect HICP weight adjustments to be much less affected by future CPI base year changeovers than by past ones.
5 Accounting for OOH Costs in Consumer Price Indices
Weighting is a measurement issue for which a higher degree of coherency between CPI and HICP has been achieved. A similar development in the case of OOH is unlikely. In the next part of this section, we discuss the conceptual and practical factors hampering harmonization.[14] We take a look at the German CPI and the HICP in its development perspective proposed by the ECB Governing Council in the 2020/2021 Monetary Policy Strategy Review.[15] In the second part, we complement the empirical picture by presenting OOH-augmented inflation figures for Germany.
5.1 Criteria for Selecting the Approach to OOH Measurement
There are several approaches to OOH measurement in consumer price indices; see Diewert and Shimizu (2021) for an overview. The NA approach measures the expenses for owner-occupied dwellings at the point in time when they become the property of the household sector by purchase or construction. The RE approach and the user cost approach are methods that measure the services flow generated by dwellings during their useful life. The payments approach takes a cash flow view capturing the households’ actual expenses for their dwellings. In measurement practice, we observe simplified forms of these approaches or hybrid versions, too. For a discussion of Germany’s situation, it is sufficient to focus on the RE approach and the NA approach, as the former is implemented in the national CPI while the ECB Governing Council regards the latter as the preferred method for the integration of OOH into the HICP (ECB 2021a, 2021b).
A central message of the vast scientific literature on the treatment of OOH in consumer price indices is that no approach dominates all the others in every respect. Comparative advantages and disadvantages are attributable to each approach. In other words, selecting the appropriate approach essentially means making an overall assessment according to various criteria. ILO et al. (2020, 245–246) list the following: alignment with user needs and the main purpose, conceptual consistency, public acceptance, and practicality of implementation.[16]
We continue with some deliberations about these criteria with regard to the CPI and the HICP. Table 3 gives a summary of the main arguments.
Comparison of the CPI and HICP with regard to the suitability of approaches to measuring OOH.
| Criterion | CPI | HICP |
|---|---|---|
| Alignment with user needs and main purpose |
Deflating nominal values is among the main purposes OOH costs are accounted for in the national accounts via the RE approach OOH costs are accounted for in the national accounts via the RE approach |
Monetary policy and convergence assessment are the clear main purposes Reference to monetary consumption expenditure and observed prices speaks in favor of NA approach Reference to monetary consumption expenditure and observed prices speaks in favor of NA approach |
| Conceptual consistency | RE approach is not consistent with the treatment of other durables | NA approach is consistent with the treatment of other durables |
| Public acceptance | RE approach is considered an established measurement concept in the CPI | In public consultations OOH costs were primarily put into the context of house or construction price developments |
| Practicality of implementation | RE approach is well implemented in Germany due to the large rental market und free pricing | Parallel publication in the interim phase (monthly HICP and quarterly OOH-augmented HICP) is desirable for monetary policy |
By recalling the main purposes of the CPI and the HICP from Section 2, we acknowledge some differences, which play a role in the decision on the treatment of OOH. In particular, the NA approach generally fits the HICP, as its central purpose is to measure inflation for monetary policy and convergence issues in Europe. For central banks, it is relevant to know what happens in monetary transactions entailing signals about prices formed by market activities. Imputed prices as explicitly used in the RE approach are not compatible with that aim. However, they are consistent with an important purpose of the CPI. Deflating nominal values by the CPI ensures consistency because OOH expenses are measured by the RE approach in the national accounts.
As regards consistency with key measurement principles, it is worth stressing that, in both the CPI and the HICP, the price of any durable good is generally recorded at the time of its purchase, ignoring the fact that its useful life exceeds the length of the reporting period. If the NA approach were used in the HICP, the measurement of OOH would be consistent with the treatment of cars, refrigerators and so on. By contrast, measuring OOH by the RE approach is an exceptional case in the CPI. The internal inconsistency, however, makes the CPI coherent with the measurement of durables consumption in the national accounts.
In 2020, the ECB and national central banks carried out listening events in order to take account of public opinion in the monetary policy strategy review. The ECB’s summary of the key findings regarding OOH is that “the vast majority of respondents considered [housing] costs to be relevant to inflation and many stated that they should be more adequately included in the Harmonised Index of Consumer Prices” (ECB 2020). This statement confirms the public’s desire to integrate OOH. Taken literally, it provides no information on the approach the public wishes to be adopted. However, when respondents expressed concerns about “the burden of housing costs”, they primarily thought in terms of the high and rising house prices observed during this period. We interpret this as a soft indicator in favor of the NA approach. In the empirical part, we will show that the steep upward trend of the NA-based OOH price index (OOHPI) is able to capture the worrying experiences of the public while, at the same time, actual rentals for housing kept on rising rather moderately.
The long-standing practice in CPI measurement proves that the RE approach is successfully implementable in Germany. Large rental markets and free pricing in most segments enable Destatis to design surveys, which are usable not only for compiling indices of actual rentals but also for imputing the equivalent rents proxying OOH costs. The NA approach is currently not implementable because of unsolved methodological issues and practical impediments. It is not clear how one can deal with the dual character of the purchase of a house the new owner moves into, i.e. being both a consumption and an investment decision at the same time. In Germany, as in most other European countries, house prices are reported only quarterly, with a significant publication delay.
In order to fill the information gap until the methodological challenges are solved and the practical impediments are removed, ECB (2021a, 2021b) suggests that Eurostat regularly publish a quarterly OOH-augmented HICP by combining the HICP with the experimental OOHPIs, which have been developed in all euro area countries except Greece. So far, they have been used as stand-alone indices. If combined with the HICP, they would make the combined index inferior in terms of frequency and timeliness. However, complementing the monthly HICP with a quarterly OOH-augmented HICP is seen as a value added for monetary policy assessments (ECB 2021a). In contrast, the European Statistical System (ESS) gives more weight to the risk parallel publication may pose to the credibility of the HICP, and does not support Eurostat publishing an experimental OOH-augmented HICP on a regular basis (Eurostat 2023, 9).
To sum up, there are good reasons for both the integration of OOH into the CPI according to the RE approach and the request to include OOH in the HICP according to the NA approach. Using different methodological options is, thus, a deliberate decision against coherency. In the remainder of this section, we show that the incoherency matters empirically.
5.2 Comparing OOH-Augmented Consumer Price Indices
As part of the work preparing the ESS response to the ECB Governing Council recommendation on OOH, experimental calculations combining the HICP with OOHPIs and approximate imputed rentals were carried out. These estimates are available from the beginning of 2011 to mid-2022 but are not updated. Following the Monetary Policy Strategy Review, ECB staff set up a compilation method for analytical NA-based and RE-based OOH-augmented HICPs for the euro area and euro area countries on the basis of publicly available data. The results are not published regularly but on specific occasions (e.g. Eiglsperger et al. 2022, 2024).
The empirical analysis is based on our estimates of NA-based and RE-based OOH-augmented HICPs for Germany. The estimates combining HICP and OOHPI result from applying the common compilation method agreed upon with ECB staff. In order to provide a long time series for the NA-based OOH-augmented HICP, we calculate the OOHPI back to the start of the HICP’s history in 1996, following the Destatis approach (Brunßen and Diehl-Wolf 2018) as closely as possible using house price and construction price indices. Details are found in the Appendix. We compile an RE-based OOH-augmented HICP by weighting the item “Actual rentals for housing” with the share actual and imputed rentals have in the HICP basket according to the national accounts. As the composition of owner-occupied dwellings differs from the stock rented-out,[17] this is an approximation only. Since the last CPI base year changeover, actual and imputed rentals for housing have been split into separate items (Mai and Egner 2023, 26–27), enabling us to exactly calculate the CPI with and without OOH from 2020 onward.
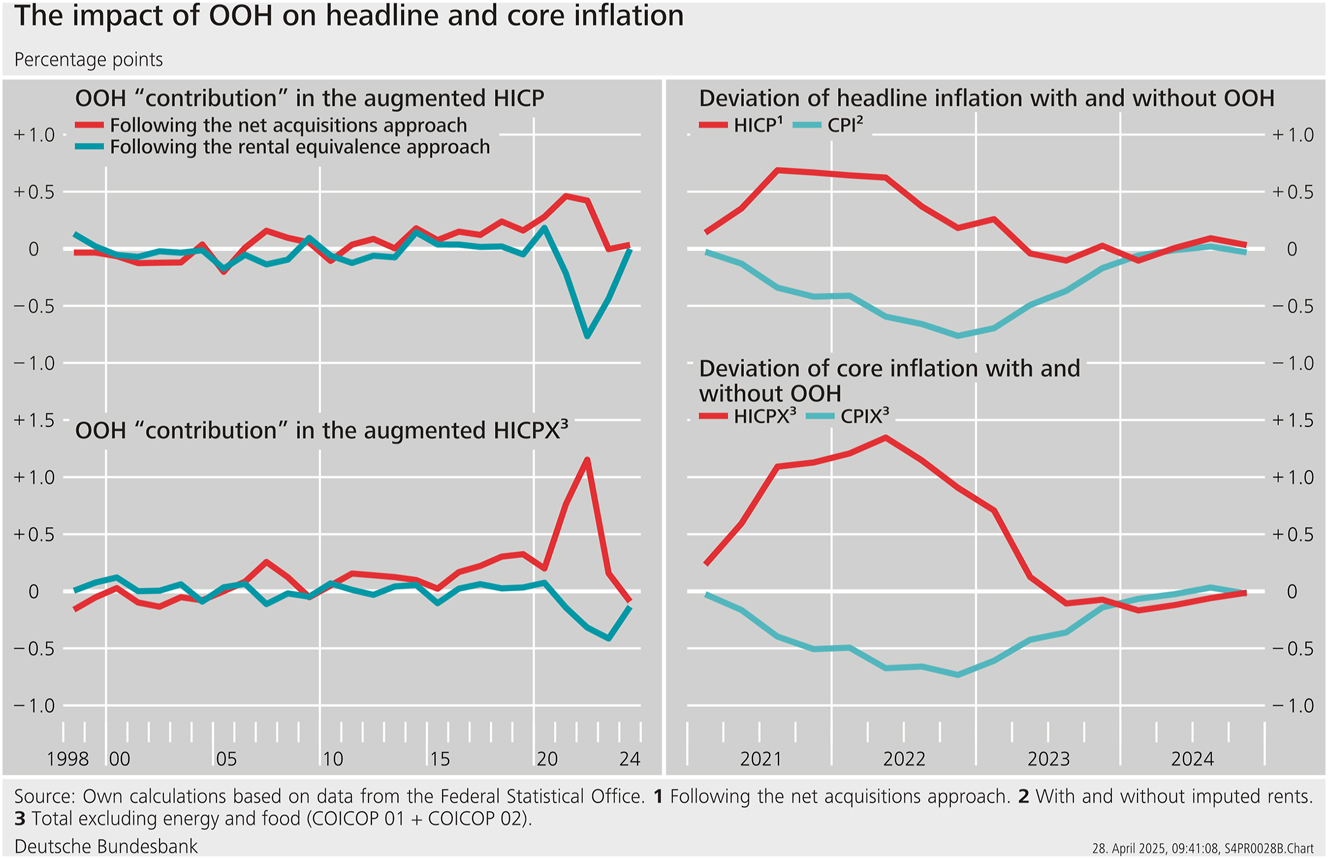
In Figure 5, we display the impact of OOH on the measurement of consumer price inflation according to both approaches. We take a long-run and a short-run view and have a look at headline and core inflation. Considering the long period from 1998 to 2024 enables us to derive rather robust evidence on the systematic OOH impact, given that its contribution is largely driven by developments in housing markets and building construction, the cycles of which are typically more stretched than usual business cycles.[18]
In the long run, the impact of OOH on HICP headline and core inflation would have tended to be neutral. The OOH-augmented HICP has risen by 2.0 % per year (NA approach) and 1.9 % (RE approach) on average over the last 27 years, while the mean headline annual rate has been 1.9 %. Core inflation has averaged at 1.5 % and, augmenting with OOH, the mean would have been 1.6 % according to the NA approach and 1.4 % according to the RE approach. With the exception of the period from 2020 to 2022, the inclusion of OOH would not have affected HICP headline inflation by more than 0.2 pp in absolute value and core inflation by no more than 0.3 pp. These margins are irrespective of the approach used. In almost half of the years, however, NA-based and RE-based augmentations do not exhibit an equally signed impact.
The NA-based OOH contribution clearly reflects the long fluctuations in the housing market and the building construction cycles. From 1998 to 2005, OOH tends to have moderately dampened inflation. Between 2006 and 2012, the inclusion of OOH had, by and large, no significant impact.[19] From 2013 to 2022, the contribution of OOH was steadily positive, tending to increase. The RE-based OOH contribution broadly mirrors the phases of stronger and lower general inflation, as actual rentals increase more smoothly than the prices of the remaining basket of goods on average. The impact was moderately negative in the 2000s and the first half of the 2010s, with the recessionary year 2009 marking an exception. In the low-inflation phase during the second half of the 2010s, rental equivalents made a small positive contribution.
In 2021 and 2022, the deviations between inflation rates with and without OOH have risen to unprecedented levels in absolute value. This is true of both headline and core inflation. The NA-based OOH contribution to HICP headline inflation reaches +0.7 pp between mid-2021 and mid-2022 as a result of strongly rising house prices and rapidly accelerating construction prices. For core inflation, the maximum OOH contribution is +1.3 pp. The dampening effect of rental equivalents on CPI headline inflation steadily increases until end-2022, standing at −0.8 pp. The maximum dampening influence on CPI core inflation is reached with −0.7 pp in the last quarter of 2022.[20]
Irrespective of the approach considered, the OOH impact on headline and core inflation converges in 2023 and is marginal throughout 2024. The evidence in the 2021/2022 period, however, makes it clear that the conceptual differences between the two approaches have the potential to matter significantly in actual inflation measurement.[21]
We disentangle the difference between the NA-based and RE-based OOH-augmented HICP inflation rates into their price and weight components. As displayed in Figure 6, the difference is shaped by the fluctuations in the OOHPI whose variability is much more pronounced than that of actual rentals for housing. In addition, how OOH is weighted in the augmented HICP plays a negligible role in explaining the deviations between the two approaches.[22]
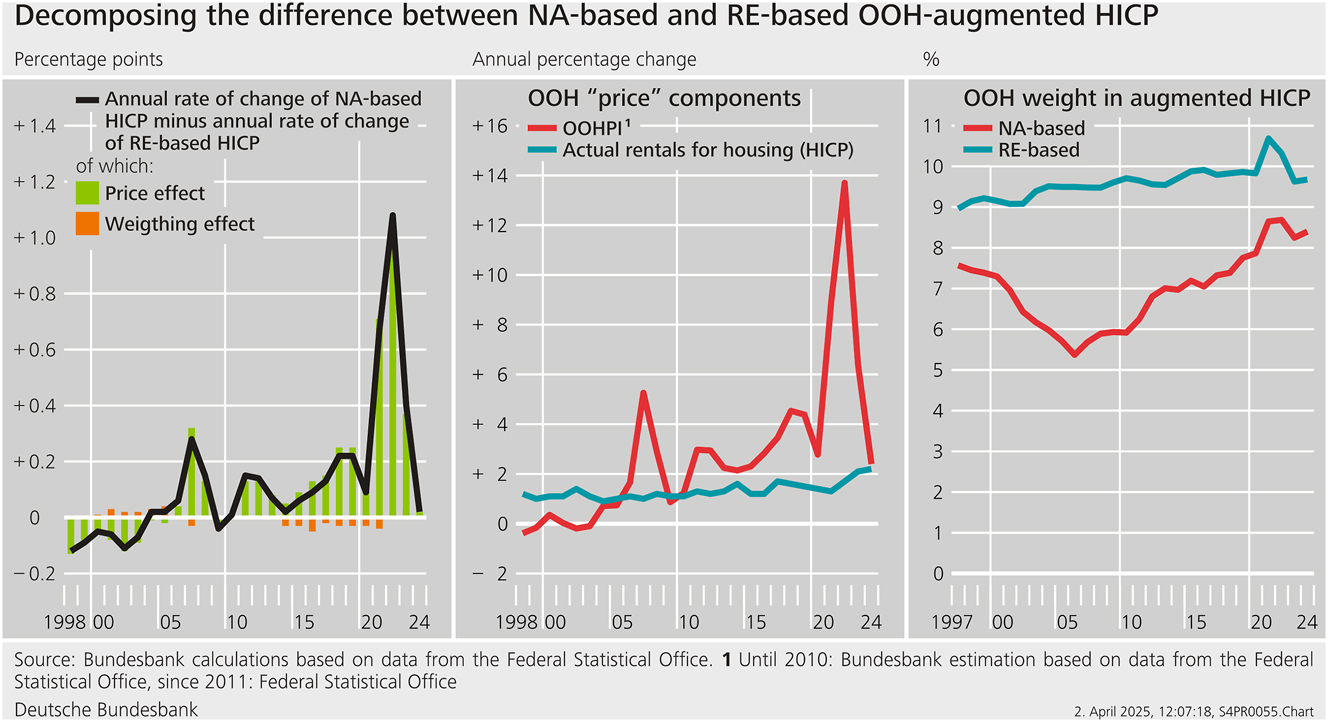
Decomposing the difference between NA-based and RE-based OOH-augmented HICP.
6 Conclusions
The co-existence of the national CPI and the HICP as key measures of inflation in Germany can be explained by the different purposes the two indices serve for users. These justify the adoption of various methodologies, implying that results can deviate from each other. Deviations may pose a challenge for communication. Attempting to actively address communication issues with enriched transparency and interpretation seems to be more beneficial for users than enforcing a higher degree of coherency at the cost of restricting the information content of the indices.
In this paper, we have examined weighting and OOH treatment as two statistical-methodological topics which raise the question of more or less conformity between CPI and HICP. By decomposing the differences between CPI and HICP inflation rates into contributions from coverage, weighting, methodology and revisions, we have found that coverage and weighting have so far been major sources of deviations. In the last base year changeover, the national accounts were prioritized over the HBS for the derivation of CPI weights, implying data source conformity with the compilation of annual HICP weights. As regards weighting, we expect the conformity between CPI and HICP inflation to increase when a new base year is introduced in the future.
We have emphasized the close connection between the measurement targets of the consumer price index and the methodological choice regarding OOH. Measuring OOH with the NA approach in the HICP and with the RE approach in the CPI is justifiable given that the former is primarily designed for monetary policy and convergence issues in Europe while the latter plays a role in indexation and deflating nominal values. However, differences matter empirically. They were particularly sizeable in 2021 and 2022.
The aim of this paper is to document empirical differences between the HICP and the national CPI and relate them to different methodological choices, which are justifiable by the (main) objectives of the indices. It goes beyond the focus of the paper to evaluate empirically whether the indices – as result of these specific choices – serve the intended purposes. This would require a broad-based analytical framework in which the policy settings and the role of the price indices are modelled formally, for instance.
Facing temporarily marked differences between NA-based and RE-based OOH-augmented HICPs at the European level too, Eurostat (2023, 8) concludes that the selection of a single method is required. A lack of consensus has prevented the ESS from moving forward.[23] The time currently being taken to conduct more research on OOH should be used not only to address the critical implementation issues of either approach but also to sharpen public understanding of inflation measures and their purposes. Measuring OOH using different approaches in CPI and HICP raises the likelihood that more substantive communication around publications of inflation figures will be needed.
Acknowledgments
The material was presented at the 18th Meeting of the Ottawa Group in Ottawa in May 2024 and the 25th Conference “Messung der Preise” in Berlin in June 2023. The authors thank Julika Herzberg, who contributed to the development of the compilation method of OOH-augmented HICPs and the comparative analysis of these estimates. The authors also thank the editor and two anonymous referees for their helpful suggestions. The views expressed in this paper are solely those of the authors and should not be interpreted as reflecting the views of the Deutsche Bundesbank or the Eurosystem.
Appendix: Back-Calculation of HICP including OOH
Extending the HICP including OOH to the period before 2010 requires a back-calculation of the OOHPI. To achieve this, we use proxies for four subcomponents, which make up the total OOHPI almost completely (see Table A.1).
Expenditure categories in the OOHPI.
| Item | Mean weight in % | |
|---|---|---|
| O.1 | Owner–occupiers’ housing expenditure | 100.0 |
| O.1.1 | Acquisition of dwellings | 89.9 |
| O.1.1.1 | New dwellings | 83.4 |
| O.1.1.1.1 | Purchases of new dwellings | 9.6 |
| O.1.1.1.2 | Self-build dwellings and major renovations | 73.8 |
| O.1.1.2 | Existing dwellings new to householdsb | – |
| O.1.1.3 | Other services related to the acquisition of dwellings | 6.5 |
| O.1.2 | Ownership of dwellings | 10.1 |
| O.1.2.1 | Major repairs and maintenance | 8.4 |
| O.1.2.2 | Insurance connected with dwellings | 1.4 |
| O.1.2.3 | Other services related to ownership of dwellingsa | – |
-
aItem O.1.2.3 is omitted from this calculation, as this was included for the first time in 2017. bNot included in the OOHPI for Germany. Sample period: 2010 – 2023. Source: authors’ calculations based on Eurostat data.
For the subcomponent “Self-build dwellings and major renovation” (O.1.1.1.2), which is by far the most important item in the German OOHPI,[24] we aggregate the construction price index for newly built dwellings and the producer price index for products for prefabricated wood buildings using weights derived from building completion statistics (cost shares). This closely follows official OOHPI compilation (Dechent 2011).
For the subcomponent “Purchases of new dwellings” (O.1.1.1.1), Destatis uses the subindex for newly built housing from the official house price index (HPI), which is not available back to 1996. For the back-calculation, we use the Bundesbank’s long residential property price index (RPPI) series.[25] It includes the HPI only since 2014 and captures the price movements of all (not just newly built) housing. As shown in Figure A.1, left panel, the annual percentage changes of the HPI component used in the official OOHPI are characterized by a larger volatility than those of the Bundesbank’s RPPI. This might be due, first, to the fact that the prices of new housing are generally subject to stronger fluctuations than the prices of housing overall. Second, the fact that, up to 2013, the HPI suffered from losses of quality with small and non-representative samples may play a role. Overall, it therefore appears justified to use the Bundesbank’s RPPI in the overlapping period as well.
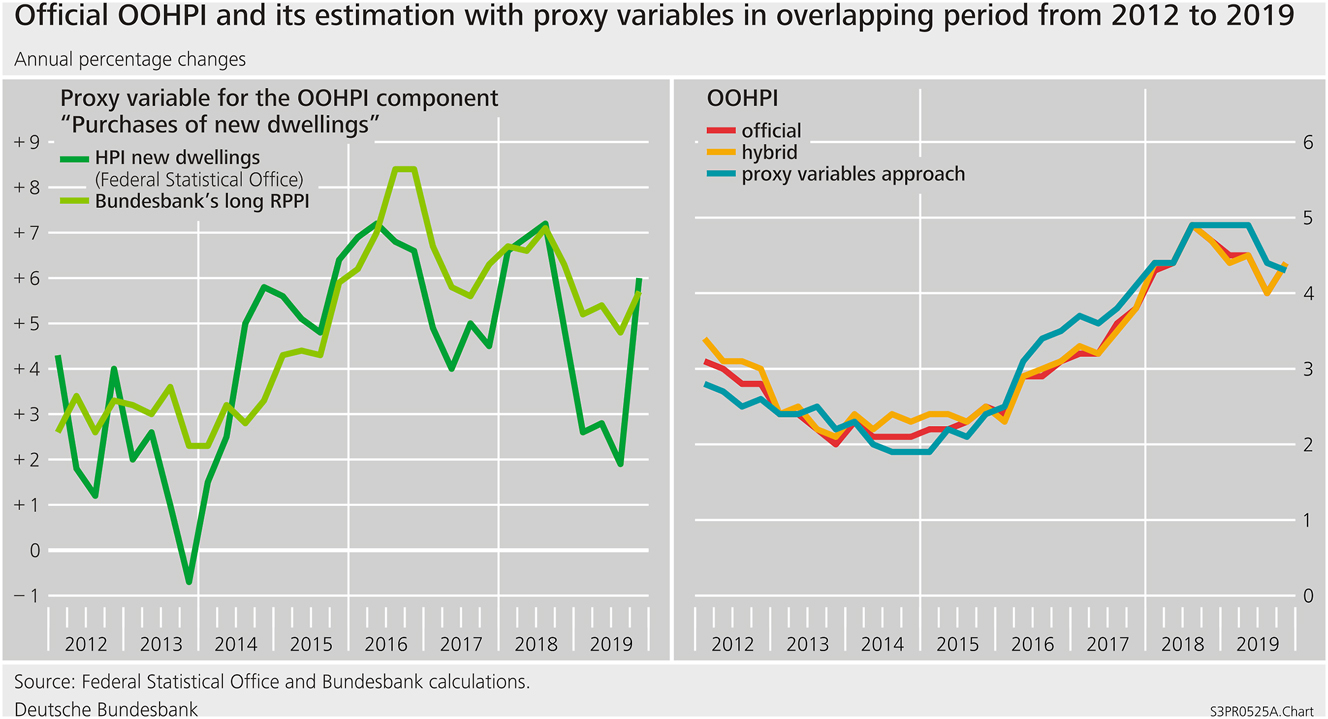
Official OOHPI and its estimation with proxy variables in overlapping period from 2012 to 2019.
In order to measure the subcomponent “Other services related to the acquisition of dwellings” (O.1.1.3), we assume that the rates for agents, solicitors, land register and real estate transfer tax remain constant on average and over time.[26] Hence, this component mimics the price movements of the new dwelling, implying that the Bundesbank’s RPPI is the proxy variable for this i.e. too.
Adopting the approach used in official OOHPI compilation (Brunßen and Diehl-Wolf 2018), we capture the price movements for the subcomponent “Major repairs and maintenance” (O.1.2.1) using the construction price index for residential buildings (excluding minor repairs).
The weighting scheme needed to aggregate the four proxy variables is derived using a number of data sources, as the OOH expenditures and its breakdown are not reported in the national accounts. However, the national accounts item “Gross fixed capital formation of dwellings”, capturing all sectors, is still the starting point. From this, the share attributed to owner–occupiers is derived by applying the average owner-occupancy ratio for new builds, which is approximated by using the statistics on building completions, as these data enable us to differentiate between residential construction for own use or for renting out. The result is owner–occupiers’ construction investment and comprises owner–occupiers’ expenditures for the purchases of new dwellings, self-builds and rebuilds. With data from the German Institute for Economic Research (DIW Berlin), we separate out the expenditures for rebuilds and, by applying to the remainder the share of non-household sectors in total construction costs taken from building completion statistics, we yield an estimate for the “Purchases of new dwellings” (O.1.1.1.1). The rest (which is the part pertaining to the household sector) and the rebuilds proxy the expenditures for “Self-build dwellings” (O.1.1.1.2).
To proxy the owner–occupiers’ expenditures for “Other services related to the acquisition of dwellings” (O.1.1.3), we start from the national accounts item “Cost of ownership transfer on land”. As this item refers to all sectors, we separate out the owner–occupiers’ part by applying the owner-occupancy rate. We perform an analogous calculation starting from the expenditures for repairs in the residential buildings stock in order to yield an estimate for the owner–occupiers’ expenditures for “Major repairs and maintenance” (O.1.2.1).
The expenditure categories are available annually from 1996 onward. Hence, we compile the OOHPI proxy by applying the same Laspeyres-type index formula, with annually changing weights, as the official OOHPI.
To assess the quality of the back-calculation, we compare our approach with the four proxy variables with the official OOHPI in the overlapping period from 2012 to 2019. Figure A.1, right panel, exhibits that the annual percentage changes of our OOHPI proxy do not differ markedly from those of the official OOHPI. The mean absolute deviation amounts to 0.2 pp. The figure also displays a “hybrid” index in which the official OOHPI subcomponents are aggregated using the proxy weights. This index deviates only marginally from the official index, suggesting that the uncertainties regarding the derivation of weights play a minor role. The good approximation in the overlapping period allows us to conclude that the back-calculation of the OOHPI is unlikely to entail any major statistical breaks that might impair interpretation.
References
Brunßen, F., and E. M. Diehl-Wolf. 2018. “Preisindex für selbst genutztes Wohneigentum.” Wirtschaft und Statistik: 68–79. https://www.destatis.de/DE/Methoden/WISTA-Wirtschaft-und-Statistik/2018/05/PreisindizesWohneigentum_052018.pdf?__blob=publicationFile (accessed May 28, 2025).Search in Google Scholar
Dechent, J. 2011. “Preisindizes für Wohnimmobilien: Neues Lieferprogramm, Wägungsschema und Ergebnisse für 2010.” Wirtschaft und Statistik: 1126–34. https://www.destatis.de/DE/Methoden/WISTA-Wirtschaft-und-Statistik/2011/11/wohnimmobilien-112011.pdf?__blob=publicationFile (accessed May 28, 2025).Search in Google Scholar
Destatis. 2000. “Erweiterter Erfassungsbereich für den Harmonisierten Verbraucherpreisindex.” Wirtschaft und Statistik: 148. https://www.statistischebibliothek.de/mir/servlets/MCRFileNodeServlet/DEAusgabe_derivate_00000309/Wirtschaft_und_Statistik-2000-03.pdf (accessed May 28, 2025).Search in Google Scholar
Destatis. 2023a. Harmonisierter Verbraucherpreisindex, Qualitätsbericht. https://www.destatis.de/DE/Methoden/Qualitaet/Qualitaetsberichte/Preise/harmonisierter-verbraucherpreis.html (accessed May 28, 2025).Search in Google Scholar
Destatis. 2023b. Verbraucherpreisindex für Deutschland, Qualitätsbericht. https://www.destatis.de/DE/Methoden/Qualitaet/Qualitaetsberichte/Preise/verbraucherpreis.html (accessed May 28, 2025).Search in Google Scholar
Diewert, E. W., and C. Shimizu. 2021. “Chapter 10: The Treatment of Durable Goods and Housing.” In Consumer Price Index Theory, edited byIMF. https://www.imf.org/en/Data/Statistics/cpi-manual (accessed May 28, 2025).Search in Google Scholar
Eiglsperger, M., R. Arioli, B. Goldhammer, E. Gonçalves, and O. Kouvavas. 2022. “Owner-occupied Housing and Inflation Measurement.” Economic Bulletin: 74–92. https://www.ecb.europa.eu/press/economic-bulletin/articles/2022/html/ecb.ebart202201_01∼f643aad55c.en.html (accessed May 28, 2025).Search in Google Scholar
Eiglsperger, M., I. Ganoulis, B. Goldhammer, O. Kouvavas, M. Roma, and A. Vlad. 2024. “Owner-occupied Housing and Inflation Measurement.” Statistics Paper Series No 47. https://www.ecb.europa.eu/pub/pdf/scpsps/ecb.sps47∼17703a986e.en.pdf?2994502e00494d355e118cf11d5152f0 (accessed May 28, 2025).Search in Google Scholar
Elbel, G., and J. Preißmann. 2012. “Jährliche Neugewichtung des Harmonisierten Verbraucherpreisindex.” Wirtschaft und Statistik: 671–6. https://www.destatis.de/DE/Methoden/WISTA-Wirtschaft-und-Statistik/2012/08/neugewichtung-hvpi-082012.pdf?__blob=publicationFile (accessed May 28, 2025).Search in Google Scholar
European Central Bank. 2000. “Extended and Further Harmonized Coverage of the HICP.” Monthly Bulletin, Box 3: 23. https://www.ecb.europa.eu/pub/pdf/mobu/mb200003en.pdf (accessed May 28, 2025).Search in Google Scholar
European Central Bank. 2020. “Summary Report of the ECB Listens Portal Responses.” https://www.ecb.europa.eu/home/search/review/html/ecb.strategyreview002.en.html (accessed May 28, 2025).Search in Google Scholar
European Central Bank. 2021a. “The ECB’s Monetary Policy Strategy Statement.” https://www.ecb.europa.eu/home/search/review/html/ecb.strategyreview_monpol_strategy_statement.en.html (accessed May 28, 2025).Search in Google Scholar
European Central Bank. 2021b. “Inflation Measurement and its Assessment in the ECB’s Monetary Policy Strategy Review.” Occasional Paper Series 265. https://www.ecb.europa.eu/pub/pdf/scpops/ecb.op265∼a3fb0b611d.en.pdf?ebf31d258ee0b02b8e4ee876fd0d866d (accessed May 28, 2025).Search in Google Scholar
European Union. 2020. “Commission Implementing Regulation (EU) 2020/1148.” Official Journal of the European Union. https://eur-lex.europa.eu/legal-content/EN/TXT/PDF/?uri=CELEX:32020R1148 (accessed May 28, 2025).Search in Google Scholar
Eurostat. 2020. “Guidance on the Compilation of HICP Weights in Case of Large Changes in Consumer Expenditures.” https://ec.europa.eu/eurostat/documents/10186/10693286/HICP_guidance.pdf (accessed May 28, 2025).Search in Google Scholar
Eurostat. 2023. “Owner-occupied Housing and the Harmonised Index of Consumer Prices: Outcome of the Work of the European Statistical System.” 2023 edition. https://ec.europa.eu/eurostat/web/products-statistical-working-papers/w/ks-tc-23-001 (accessed May 28, 2025).Search in Google Scholar
Eurostat. 2024. “Harmonised Index of Consumer Prices (HICP): Methodological Manual.” 2024 edition. https://ec.europa.eu/eurostat/web/products-manuals-and-guidelines/w/ks-gq-24-003 (accessed May 28, 2025).Search in Google Scholar
Hagenkort-Rieger, S., and N. Sewald. 2021. “Theoretical and Practical Approaches to Measuring Inflation in Times of the Coronavirus Pandemic.” https://www.destatis.de/EN/Methods/WISTAScientificJournal/Downloads/approaches-inflation-coronavirus-pandemic-012021.pdf?__blob=publicationFile (accessed May 28, 2025).Search in Google Scholar
Hauf, S., and D. Schäfer. 2019. “Revision der Volkswirtschaftlichen Gesamtrechnungen 1991 bis 2018.” Wirtschaft und Statistik: 61–72. https://www.destatis.de/DE/Methoden/WISTA-Wirtschaft-und-Statistik/2019/05/revision-volkswirtschaftliche-gesamtrechnungen-1991-bis-2018-052019.pdf?__blob=publicationFile (accessed May 28, 2025).Search in Google Scholar
International Labour Office, International Monetary Fund, Organisation for Economic Co-operation and Development, European Union, United Nations, World Bank. 2020. “Consumer Price Index Manual: Concepts and Methods.” Washington, DC: International Monetary Fund. https://www.imf.org/en/Data/Statistics/cpi-manual (accessed May 28, 2025).Search in Google Scholar
Mai, C., and U. Egner. 2023. “Analysen zur Revision 2023 in der Verbraucherpreisstatistik.” Wirtschaft und Statistik: 17–33. https://www.destatis.de/DE/Methoden/WISTA-Wirtschaft-und-Statistik/2023/04/analysen-zur-revision-042023.pdf?__blob=publicationFile&v=4 (accessed May 28, 2025).Search in Google Scholar
© 2025 the author(s), published by De Gruyter, Berlin/Boston
This work is licensed under the Creative Commons Attribution 4.0 International License.