Analyses of data from the first Chinese seismo electromagnetic satellite (CSES-01) together with other earthquake precursors associated with the Turkey earthquakes (February 6, 2023)
-
Mehdi Akhoondzadeh


Abstract
On 6 February 2023, at 01:17:35 and 10:24:49 UTC (LT = UTC + 03:00) two earthquakes with magnitude 7.8 (37.166° N, 37.042° E, depth ∼ 17.9 km) and 7.5 (38.024° N, 37.203° E, depth ∼ 10 km), respectively, heavily struck southern and central Turkey and northern and western Syria. The purpose of this study is to investigate the relation between pre-earthquake anomalies observed in different layers of the earth system and explore the earthquake mechanism of LAIC (Lithospheric Atmospheric Ionospheric Coupling) associated with earthquake precursors. To achieve this goal, electron density and temperature variations obtained from CSES-01 data in the Dobrovolsky’s area the Turkey earthquakes are analyzed in the period from November 1, 2022 to February 10, 2023. Since investigating the LAIC mechanism requires multi-precursor analysis, anomalies obtained from CSES-01 data were compared with the behavior of anomalies obtained from other lithospheric, atmospheric and ionospheric precursors in the same location and time of the study area. These anomalies that were analyzed in the previous study are: (1) TEC data obtained from GPS-GIM maps, (2) electron density and temperature variations obtained from Swarm satellites (Alpha, Bravo and Charlie) measurements, (3) Atmospheric data including water vapour, methane, ozone, CO and AOD obtained from the measurements of OMI and AIRS satellites, and (4) Lithospheric data including number of earthquakes obtained from USGS and also surface temperature obtained from the measurements of AIRS satellite. It should be noted that clear anomalies are observed between 1 and 5 days before the earthquake in electron density and temperature variations measured by CSES-01 during the day and night and they are in good agreement with the variations in the Swarm satellites data and GPS-TEC. The interesting and significant finding is that lithospheric anomalies are detected in the land surface temperature data in the time interval of 19–12 days before the earthquake, and then most of the atmospheric anomalies are observed in the time period of 10–5 days prior to the earthquake and at the end striking ionospheric anomalies are revealed during 5–1 days preceding the earthquake. Therefore, the results of this study confirm the sequence of appearing of earthquake precursors from the lower layers of the lithosphere to the upper layers of the ionosphere during 1–15 days before the earthquake, and finally proving the LAIC mechanism can significantly contribute to the efficiency and lower uncertainty of earthquake early warning systems in the future.
1 Introduction
According to the extensive research that has been done in the field of observing abnormal changes in various physical and chemical parameters (precursor) in the layers of the lithosphere, atmosphere and ionosphere of the earth system before large earthquakes but often in posteriori case studies, the creation of earthquake early warning systems is not far from reach [1]–6]. Until today, using different satellite data sources and utilizing satellite data storage and processing platforms such as GEE (Google Earth Engine), Giovanni, etc., hundreds of earthquake precursors have been proposed. Also by performing multi-precursor and multi-predictor analysis [7], the uncertainty in detecting pre-seismic anomalies has been reduced. Machine learning and Artificial Intelligence (AI) methods have greatly helped to detect unusual non-linear and complex behaviors in time series of different precursors.
It should be noted that due to the complexity of the behavior of different precursors in different earthquakes, it is necessary to investigate and evaluate several earthquakes (statistical analysis). In other words, increasing observations leads to further reduction of uncertainty and systematic and random errors.
One of the existing challenges is the difference in the observation time of pre-seismic anomalies in different layers of the earth. In other words, according to the various hypotheses and seismic mechanisms, it is expected that pre-seismic anomalies will be observed first in the lithosphere, then in the atmosphere and in the upper layers of the ionosphere. Therefore, it is necessary to conduct studies on the interaction between different layers of the earth, or LAIC (lithospheric-atmospheric-ionospheric coupling) mechanisms, to lead to a more precise announce of the time of the upcoming strong earthquakes [8].
This study attempts by using the CSES-01 data together with the results of other precursors obtained in previous studies related to the Turkey earthquakes (February 6, 2023) [9], 10] to investigate the time sequence between the occurrence of pre-seismic anomalies in different layers of the lithosphere, atmosphere and ionosphere.
According to the USGS website (United States Geological Survey) at 4:17:34 and 13:24:49 local time (UTC = LT-3:00) on February 6, 2023, two powerful earthquakes with a magnitude of Mw = 7.8 and 7.5 at locations of 37.22° N, 37.02° E, 10.00 km depth, and 38.024° N, 37.203° E, 10.00 km depth, respectively happened near the border between Turkey and Syria. Figure 1 shows the intensity map and geographic location of the mentioned earthquake. A black star indicates the earthquake epicenter (https://earthquake.usgs.gov/earthquakes).
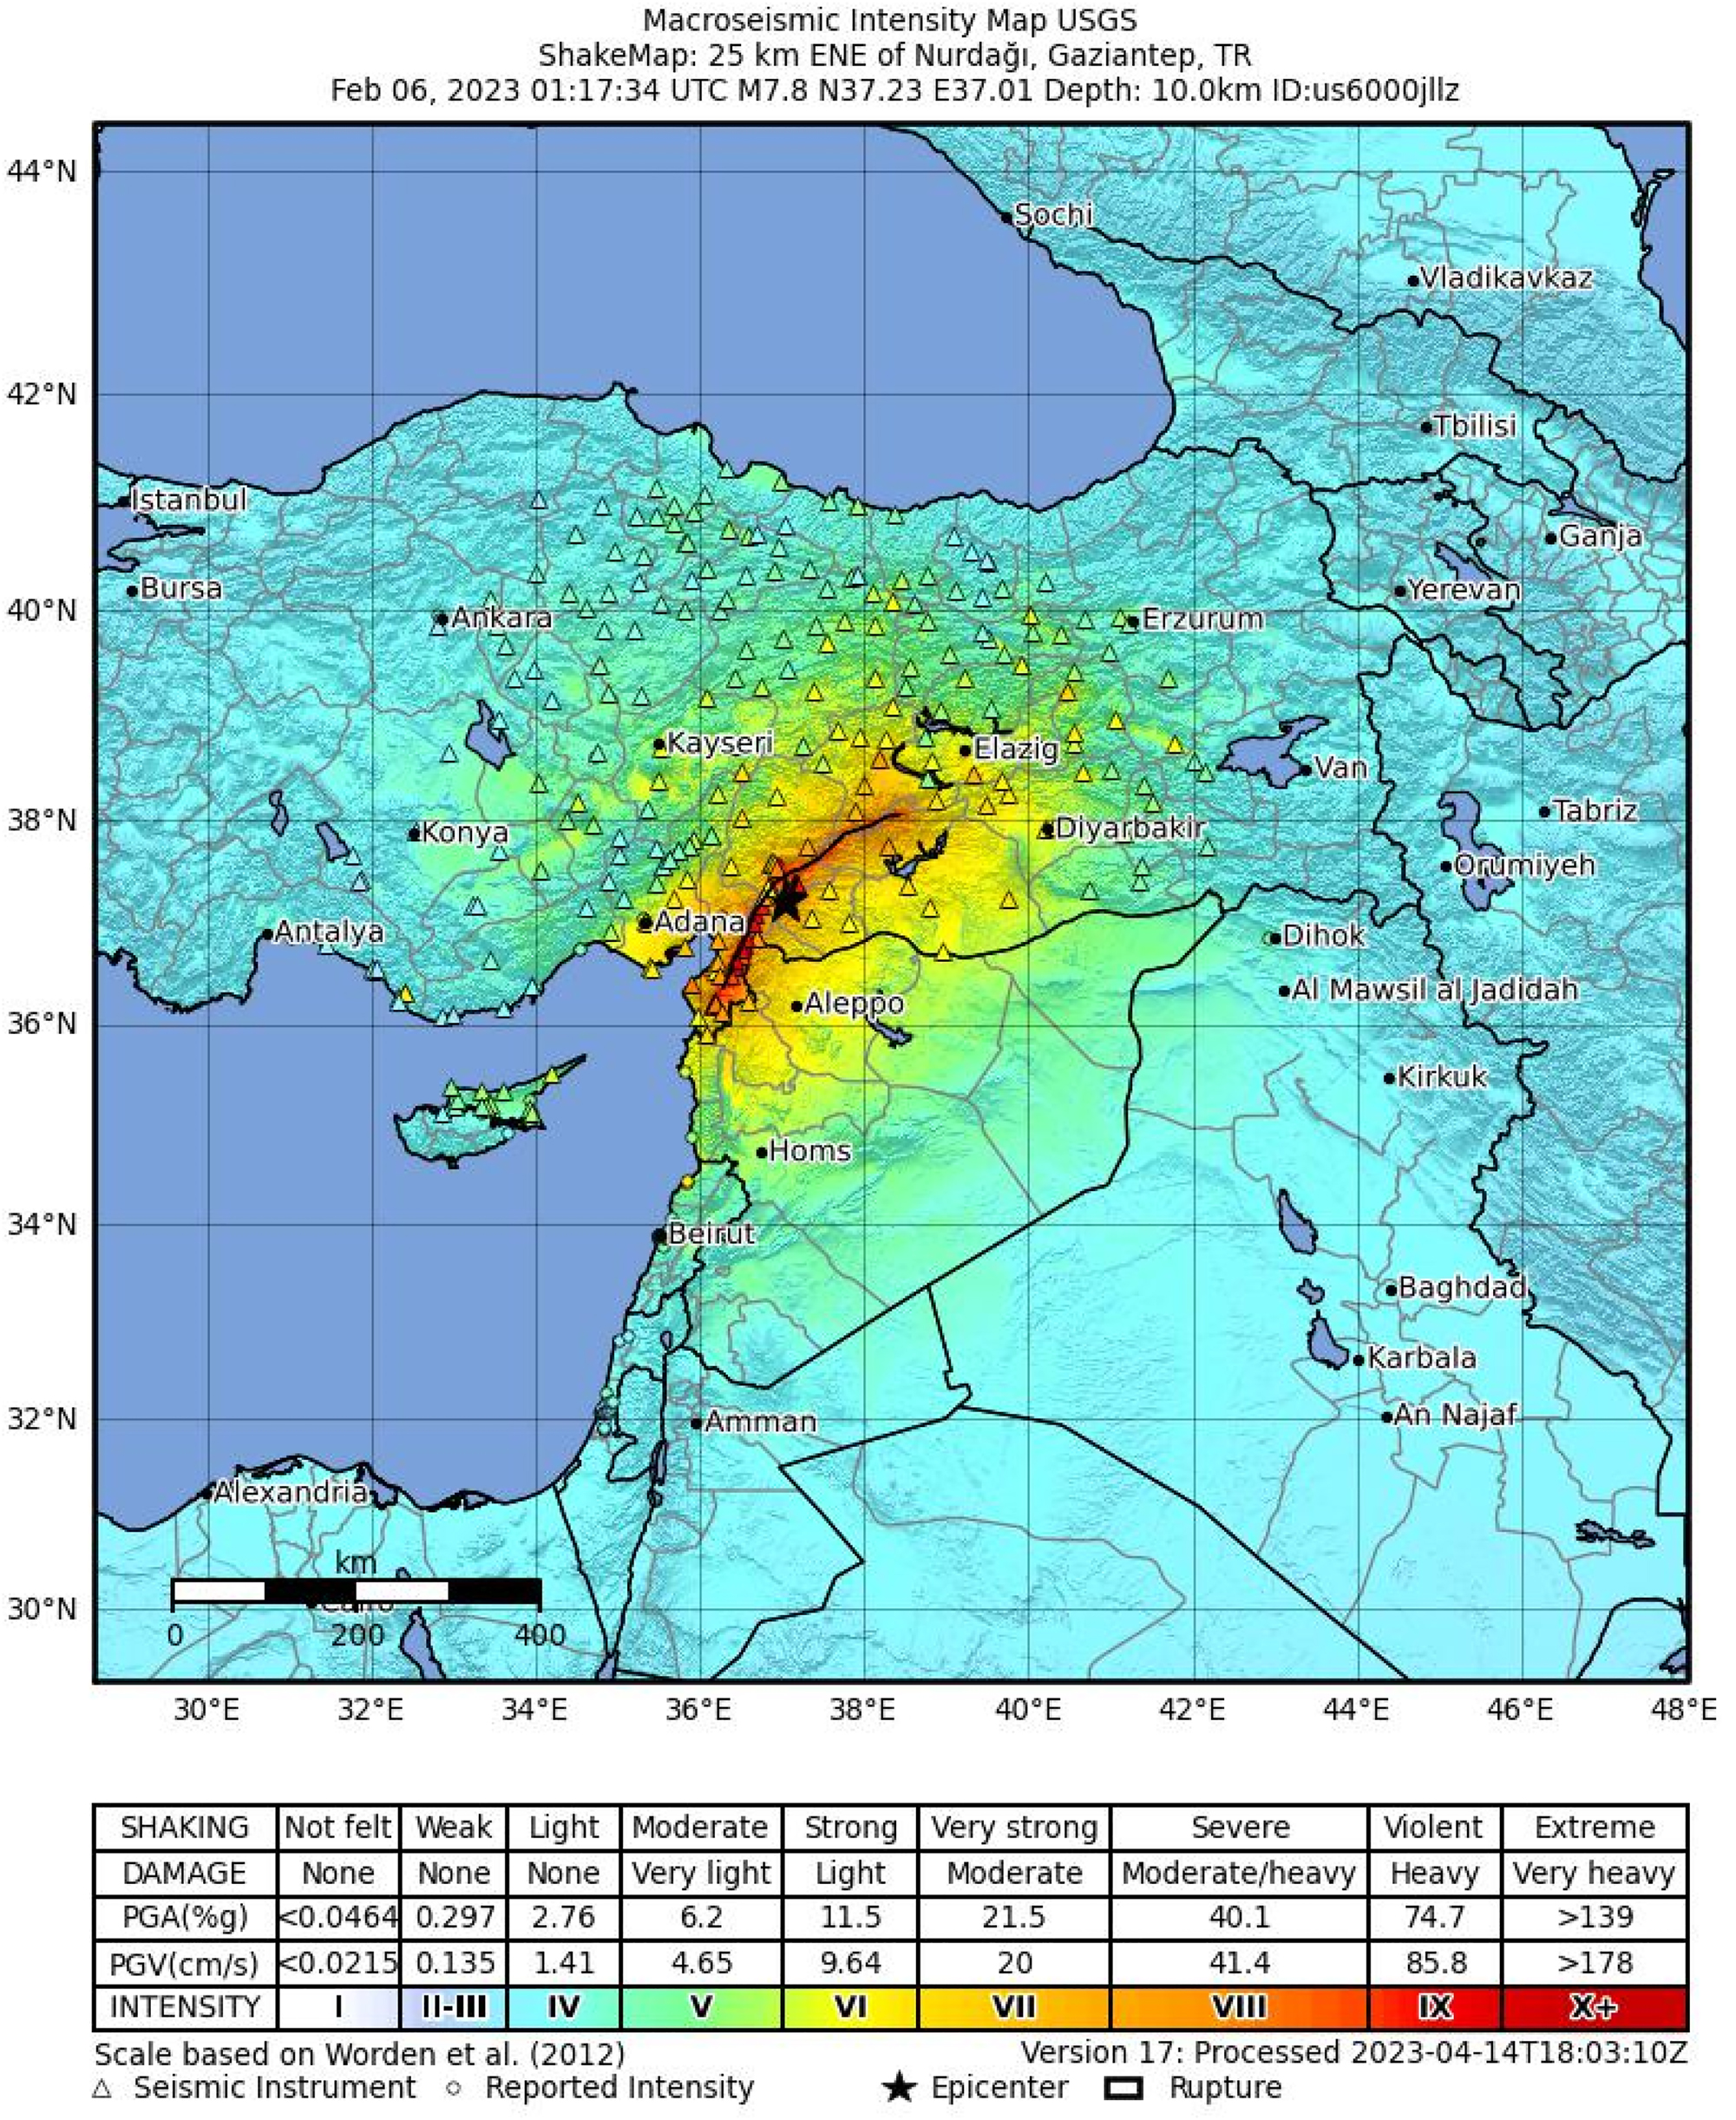
The intensity map and geographic location of the 2023 Turkey earthquake. A black star indicates the earthquake epicenter (https://earthquake.usgs.gov/earthquakes).
After the successful mission of the DEMETER satellite, which was launched with the aim of investigating the relation between ionospheric disturbances and the Earth’s electromagnetic field with seismic and volcanic activity [11], as well as the Swarm satellite mission (Alpha, Bravo, Charlie) [12]–15], on February 2, 2018, the CSES (China Seismo-Electromagnetic Satellite)/Zhangheng 1 with the aim of monitoring the electromagnetic field and ionospheric plasma and relating some their disturbances to seismic activities, was launched with the joint cooperation of China and Italy.
The altitude of the orbit of this sun-synchronous satellite is about 500 km, the inclination angle of this satellite’s orbit is 97.32°, and its revisit time is 5 days. This satellite collects plasma data and the Earth’s electromagnetic field in two modes: (1) Burst, on China and earthquake-prone areas and (2) Survey, other areas, in the range of ±65° magnetic latitudes using the following sensors: (i) LP (Langmuir Probe) to measure the electron density and temperature, (ii) PAP (Plasma Analyzer Payload) to measure the density and temperature of the main plasma ions, (iii) EFD (Electric Field Detector) to measure electric field changes, (iv) SCM (Search-Coil Magnetometer) to measure the magnetic field, (v) HEPP (High-Energy Particle Package) to measure particle energy measurement, (vi) HEPD (High-Energy Particle Detector) to measure electrons and protons, and (vii) GNSS Occultation Receiver for TEC measurement [16], 17].
In this study, the values of electron density and temperature measured by the LP sensor of the CSES-01 in the period from November 1, 2022 to February 10, 2023 in Dobrovolsky’s area [18] the first powerful earthquake of Turkey (February 6, 2023) in order to detect of possible pre-earthquake anomalies are investigated.
The effectiveness of the CSES-01 electron density has been firstly proved by De Santis et al. [19] with a worldwide statistical correlation with strong earthquakes.
The LP sensor measures electron temperature (Te) between 500 K and 10,000 K and electron density (Ne) in a range from 5 × 10² to 1 × 107 cm−3. The data of different sensors of the CSES-01 up to a maximum of 6 months ago can be assessed freely via the website, www.leos.ac.cn.
Therefore, in this paper, in addition to the analysis of two temperature and electron density precursors obtained from CSES-01 data, seven other ionospheric precursors including GPS-TEC and electron density and temperature obtained from the measurements of three Swarm satellites (A, B, C), and 5 atmospheric precursors including water vapour, methane, ozone, CO and AOD obtained from AIRS [20] and OMI sensors, and two other lithospheric precursors including number of earthquakes obtained from USGS web and surface temperature obtained from the measurements of AIRS satellite, have been analyzed in order to justify the LAIC mechanism.
2 Observations and data analysis
2.1 Solar-geomagnetic indices
In order to know the status of solar and geomagnetic activities of the ionosphere, in the studied period from November 1, 2022 to February 10, 2023, the behavior and changes of four indices including ap, Dst and F10.7 have been investigated. Each of these indices express a specific characteristic of the state of the earth’s geomagnetic field. ap index is measured globally by several geomagnetic stations in different latitudes and in linear and logarithmic scales [21], 22]. The Dst index is monitored by four geomagnetic stations around the equator, and in case of geomagnetic storms, large negative values or even large positive values are recorded for it [23]. Figure 2a and b represent the geomagnetic indices of ap and Dst, respectively in the time period of 1st November, 2022 to 10 February 2023. The values of geomagnetic indices are displayed in quiet conditions (i.e. |Dst| ≤ 20 nT, ap < 20) with green color and in non-quiet geomagnetic conditions with red color. A black asterisk indicates the earthquake origin time. The Y-axis indicates the universal time. The horizontal axis represents the days relative to the earthquake occurrence.
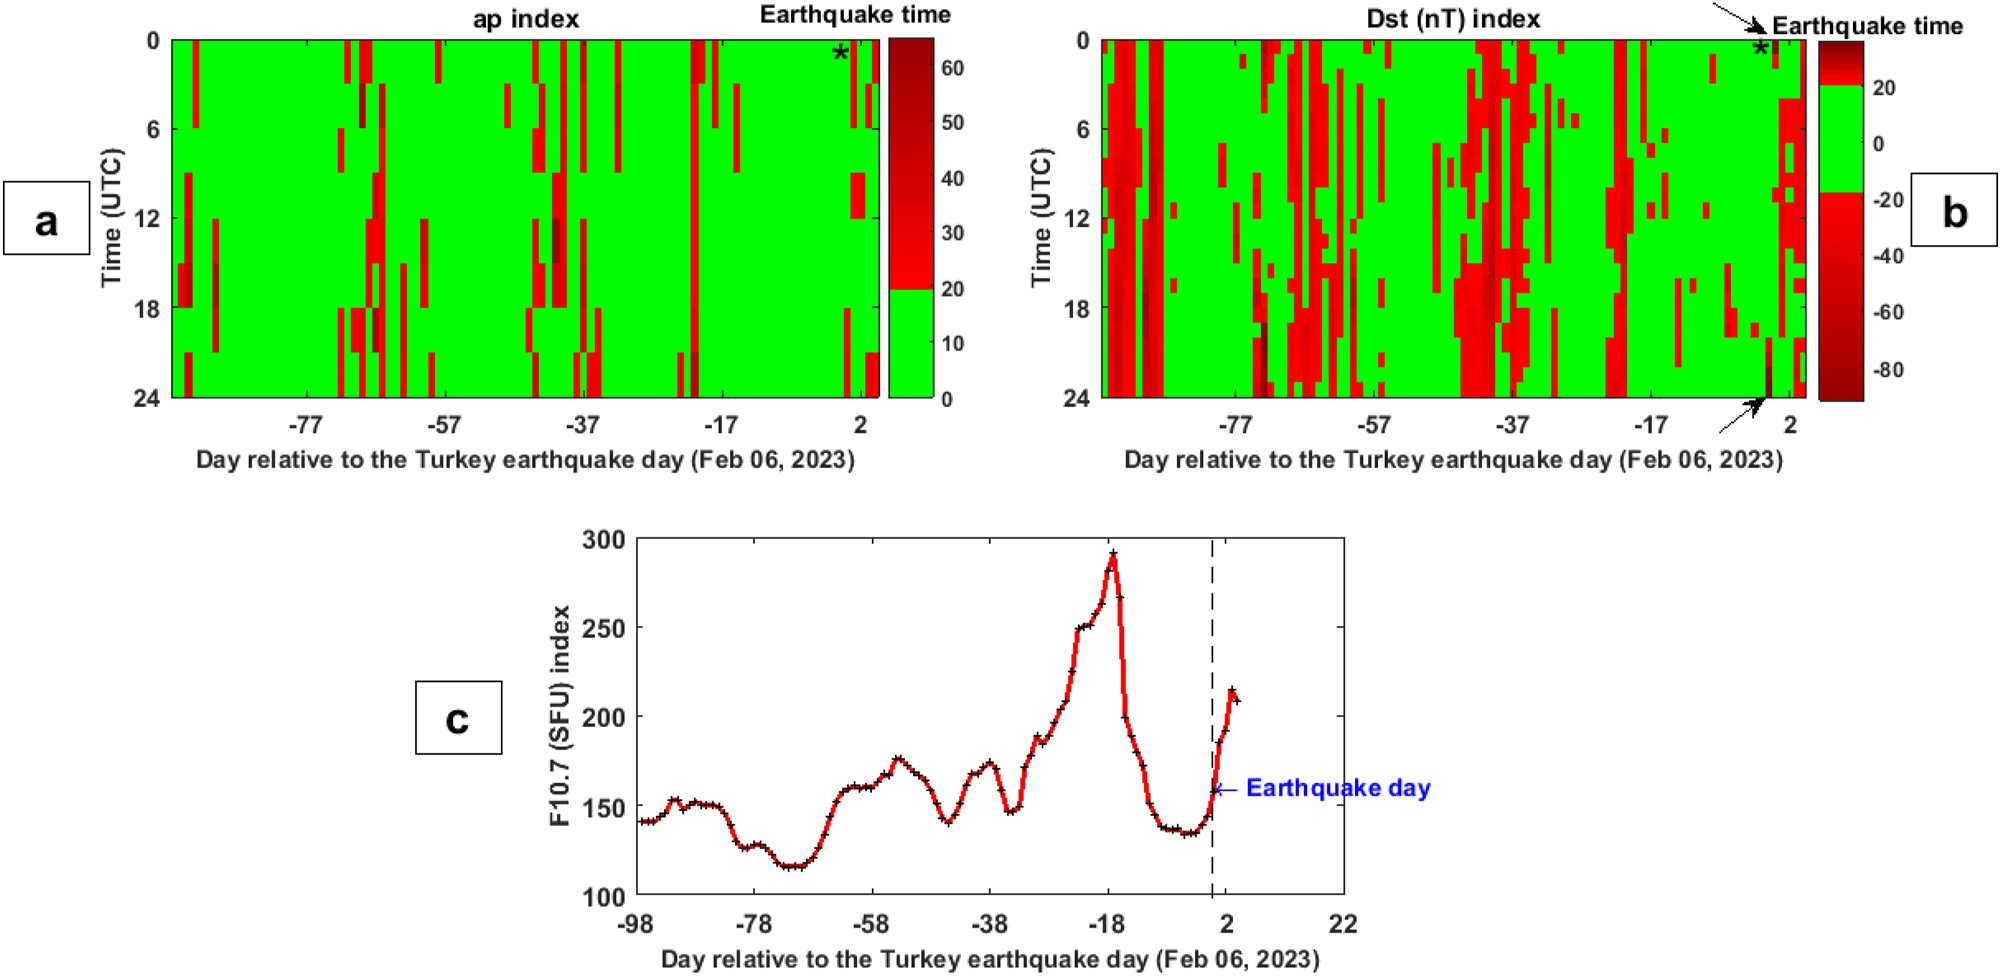
Variations of solar-geomagnetic indices of (a) ap, (b) Dst and (c) F10.7, in the time period of 1 November, 2022 to 10 February 2023. The abscissa represents the days relative to the Turkey (06 February 2023) earthquake day. A black asterisk “*” indicates the earthquake origin time. The values of geomagnetic indices (a and b) are displayed in quiet conditions with green color and in non-quiet geomagnetic conditions with red color.
Figure 2a represents that the ap index has a normal state in the days before the earthquake, but it reaches the border of abnormal changes and the value of 18 from about 2 h before the time of the earthquake to 4 h after it. Figure 2b indicates that the Dst index gradually increases from about 10:00 (UTC) on the day before the earthquake, and at 24:00 (UTC) of the same day (about 2 h before the earthquake) it reaches an abnormal value of 34 and at the time of the earthquake, it reaches a value of 33 (The black arrows in Figure 2b).
In addition to geomagnetic indices, the behavior of solar activities in the studied time period has been investigated using the F10.7 index. Figure 2c shows the time series of solar radio flux (F10.7) in the time period of November 1, 2022 to February 10, 2023. It should be noted that the time period under study is in the time range of the rising of solar activities in the 25th cycle, which is more than the previously predicted values for the number of Sunspots and F10.7 (https://www.swpc.noaa.gov/products/solar-cycle-progression). Figure 2c shows that from about 30–15 days before the earthquake, solar activities intensify, so that in 17 days before the earthquake, the value of the F10.7 index reached its highest value in the studied time period, i.e. 290.0 (SFU). Summarizing the behavior of the four mentioned indices in the studied period shows that solar activities in the period of one month before the earthquake and geomagnetic activities in the hours before the earthquake have shown abnormal behavior. Extensive research has been already done on the relation between solar-geomagnetic activities and the occurrence of large earthquakes, which is beyond the scope of this paper [24].
2.2 CSES-01 data
In order to select CSES-01 data related to the study area, at first, all the transit orbits of the satellite are selected in the Dobrovolsky’s area (R = 100.43M, where R is the radius in kilometres of the earthquake preparation zone and M is the earthquake magnitude [18]) of the earthquake center in the studied time period from November 1, 2022 to February 10, 2023. The radius of the Dobrovolsky area around the epicenter of the Turkey earthquake is about 2260 km. Since the behavior of the ionosphere is different during the day and night due to the activities of the sun, the selected orbits are analyzed in two modes, day and night. In other words, the transit orbits between 6:00 am and 6:00 pm (LT) are in the day mode and the rest of the orbits are in the night data category. Then, for each selected orbit in the Dobrovolsky’s area, the median of the parameter values measured along the satellite orbit is selected as the daily value of the desired parameter. Since the time series obtained from the daily values of the desired parameters (electron density and temperature) have complex, non-linear and seasonal changes, a 5th degree polynomial is fitted on them to remove the trend and finally, the difference between the observed parameter and the fitted graph is obtained (Figures 3, 5, 7 and 8).
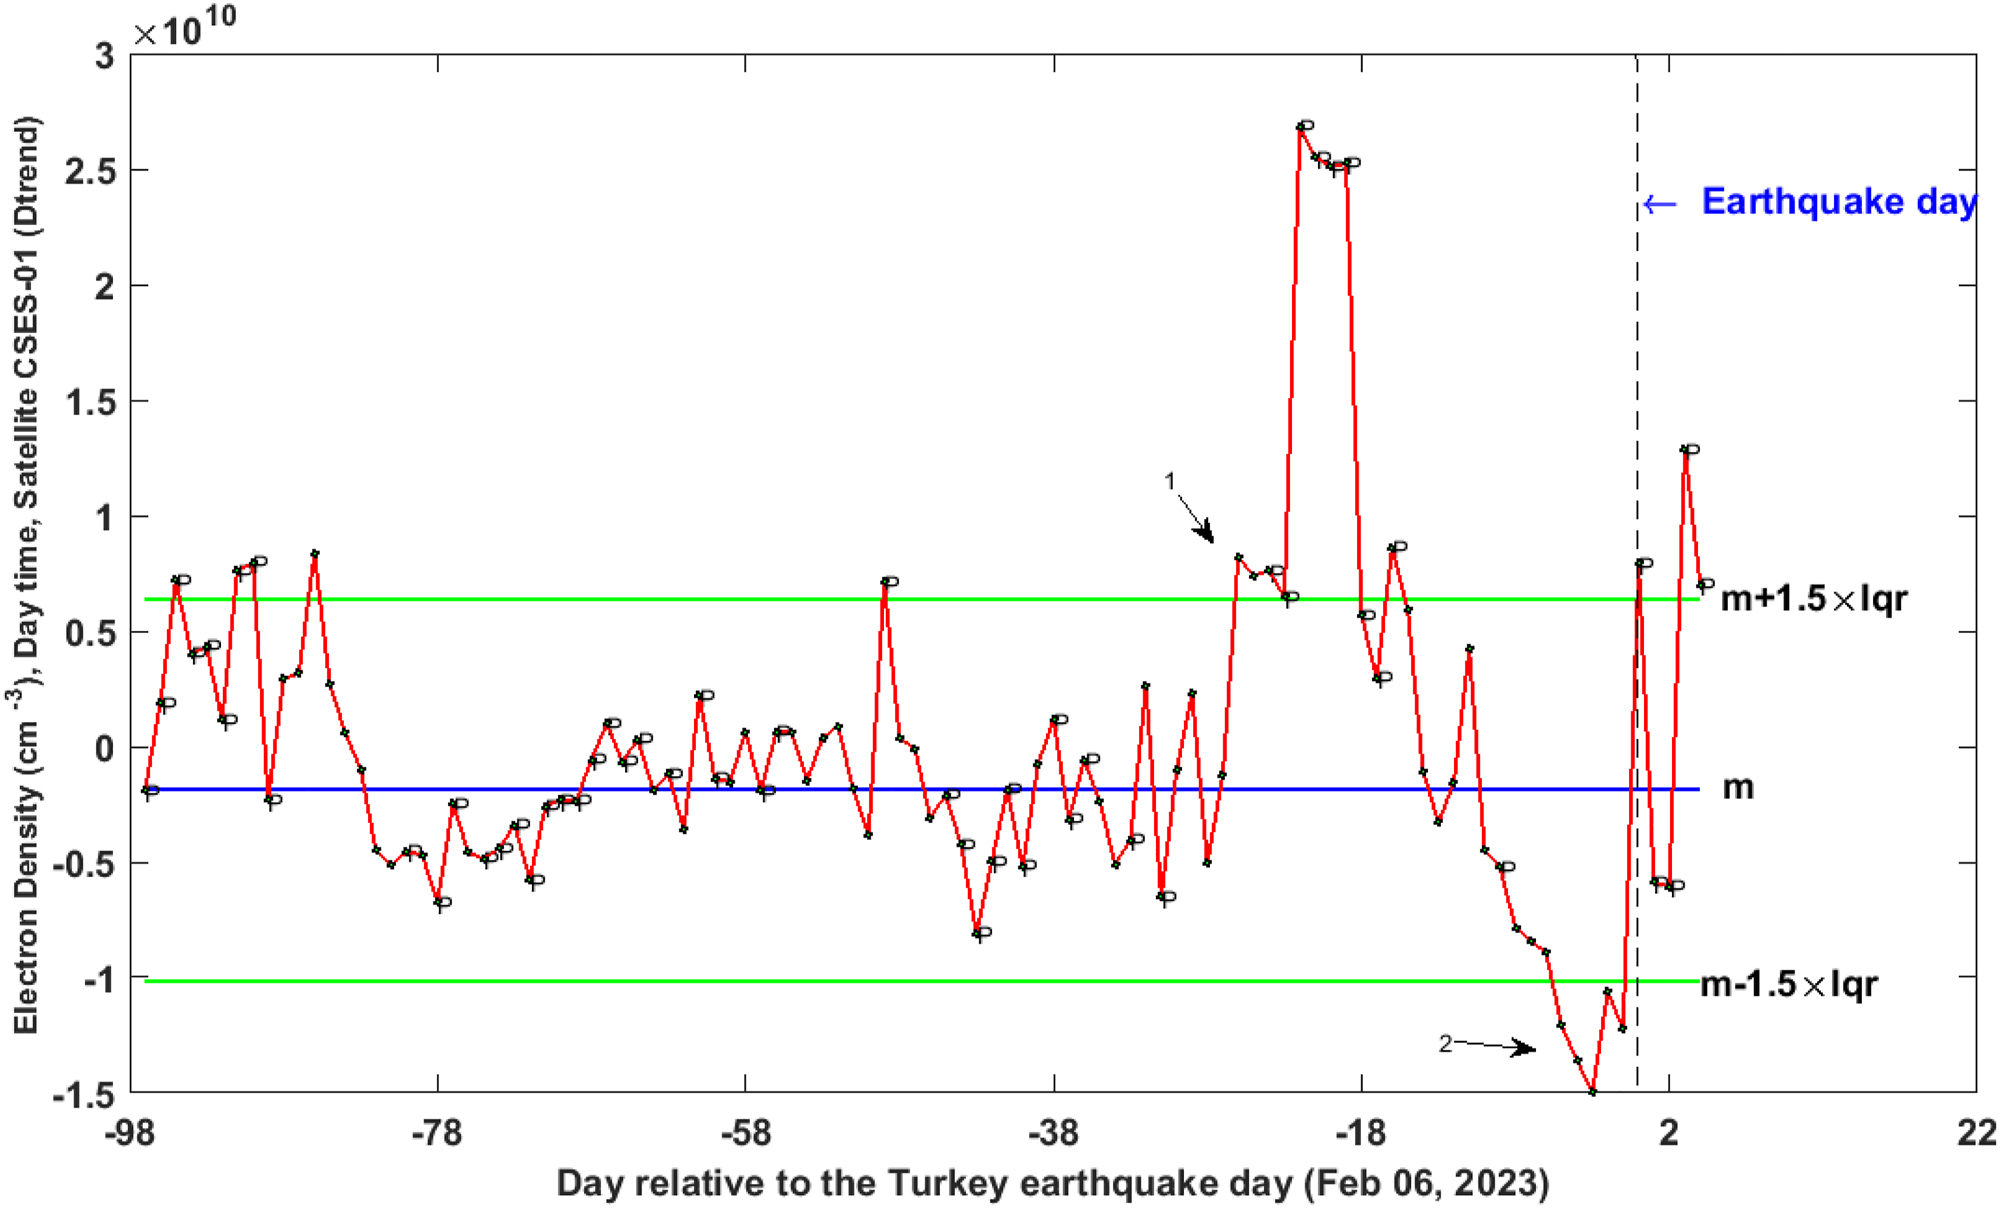
Results of CSES daily median electron density during day time from 1 November, 2022 to 10 February 2023 inside the Dobrovolsky’s area of 2023 Turkey earthquake epicenter. Days accompanied with high solar-geomagnetic activity have been depicted by “P” which means perturbed. The earthquake day is represented as a black vertical dashed line. The green horizontal lines represent the upper and lower bounds m ± 1.5 × iqr. The blue horizontal line indicates the median value (m). The x-axis represents the day relative to the earthquake day. The black arrows show the anomalous days.
Figure 3 shows the median daily variations of the electron density parameter along the transit orbit of the CSES-01 within the Dobrovolsky’s area in the period from November 1, 2022 to February 10, 2023 in daytime mode. In the displayed time series, on days with unusual solar and geomagnetic activities, beside the electron density parameter values, the symbol “P” has been indicated.
It is reminded again that the y-axis shows the difference between the value of the electron density parameter measured by the satellite and the graph fitted on the time series in order to remove the trend. The x-axis shows the studied time period and days relative to the day of the earthquake. The day of the earthquake is represented by a dashed vertical line. The blue horizontal axis shows the median (m) of the parameter values observed in the studied time period and the two green axes show the upper and lower bounds (m ± k × iqr, where k = 1.5) of the electron density parameter changes.
The upper and lower bounds are calculated using the following equations:
At above equations, x, xhigh, xlow, m and iqr indicate the parameter value, upper limit, lower limit, median value and interquartile range, respectively. It is shown that if the absolute value of Dx would be greater than k (
Figure 3 shows that the value of the electron density parameter on 25 and 26 days before the earthquake has exceeded the defined upper limit by 15.38 % and 28.05 % (black arrow 1 in Figure 3). Since these two anomalies observed before the start of days with intense solar and geomagnetic activities, it can be related to upcoming seismic activities with a small probability. It can be seen that between 1 and 5 days before the earthquake, the value of the electron density parameter during the day crosses the lower limit so that it reaches the maximum deviation of 46.88 %, 3 days preceding the earthquake (black arrow 2 in Figure 3).
Akhoondzadeh and Marchetti [9] by analyzing ionospheric plasma data measured by Swarm satellites (A, B, C) in the time and location range of the Turkey earthquake (06 February, 2023), showed that the value of electron density in the time interval of 1–8 days before the earthquake, show an unusual behavior and cross the defined lower permissible limits. Figure 4 shows that the electron density data measured by the three Swarm A, B, C satellites are in good agreement with the electron density data gathered by the CSES-01. Details of anomalies observed in CSES-01 data together with other precursors are listed in Table 1 and Figure 9.
![Figure 4:
Results of Swarm (a–c) electron density data analysis for the Turkey earthquake (6 February 2023) from 1 September 2022 to 17 February 2023 at day time. Blue and green lines represent the median value and the selected thresholds to detect the anomalies. The days accompanied with solar-geomagnetic perturbations, are depicted with the letter “P” on the graph [9].](/document/doi/10.1515/jag-2024-0024/asset/graphic/j_jag-2024-0024_fig_004.jpg)
Results of Swarm (a–c) electron density data analysis for the Turkey earthquake (6 February 2023) from 1 September 2022 to 17 February 2023 at day time. Blue and green lines represent the median value and the selected thresholds to detect the anomalies. The days accompanied with solar-geomagnetic perturbations, are depicted with the letter “P” on the graph [9].
The different precursors accompanied with the detected anomalies.
| Precursor | Anomalous days | Anomalous days after removing | ||
|---|---|---|---|---|
| Layer | Satellite | Parameter | the F10.7 effect | |
| CSES-01 | Ne (D&N) | −26, −5 to −1 (D); −3, −2 (N) | −17, −11, −4, −3 (D); −26, −17, −3, −2 (N) | |
| Te (D&N) | −11, −4, −3 (D); −-39, −3 (N) | −4, −3 (D); −39, −3 (N) | ||
| Swarm A | Ne (D&N) | −8 to −1 (D); −2, −4 (N) | – | |
| Te (D&N) | – | – | ||
| Ionosphere | Swarm B | Ne (D&N) | −9 to −1 (D); −5 to −1 (N) | – |
| (plasma parameters) | Te (D&N) | −1, −3 (D) | – | |
| Swarm C | Ne (D&N) | −8 to −1 (D); −1, −4 (N) | – | |
| Te (D&N) | −1, −3 (D) | – | ||
| GPS | TEC | −3 to −1 (N) | – | |
| Atmosphere | GEE | Water vapor | −10 | – |
| Giovanni | Methane (D&N) | +4 (D); −3 (N) | – | |
| Ozone (D&N) | −8 to +1 (D); −7 (N) | – | ||
| CO (D&N) | −8 to +2 (D); −8, −9 (N) | – | ||
| AOD | −9 | – | ||
| Lithosphere | GEE | Surface temperature | −19 to −12 | – |
| USGS EQ catalogue | Daily number of EQ | −8 | – | |
-
Day is relative to the earthquake day (D: day, N: night, Ne: electron density, Te, electron temperature; TEC, total electron content; AOD, aerosol optical depth and CO, carbon monoxide). Except the anomalies observed by CSES-01, the rest of the anomalies have been already analyzed in previous papers [9], 10]. The last column of the table shows the results of the potentially pre-earthquake anomalies observed in the data collected by CSES-0, after normalization and removing the effects of changes in the F10.7 parameter. The bold values indicate the detected anomalies in this study using CSES-01 satellite measurements.
Figure 5 represents variations CSES daily median electron density during night time from 1 November, 2022 to 10 February 2023 inside the Dobrovolsky’s area. The y-axis indicates the residual obtained from the difference between the daily value of the median of the quantity values in the Dobrovolsky’s area during the night and the fitted 5th degree polynomial to d-trend. It is seen that the value of the electron density during night time in 2 and 3 days prior to the earthquake exceeded the lower bound by 45.10 % and 92.66 %, respectively (black arrow 1 in Figure 5). Akhoondzadeh [10] indicated that the GPS-TEC (Total Electron Content) value has prominently crossed the allowed bounds 1–3 days before the earthquake. Figure 6 represents the results of TEC analysis for the Turkey earthquake (6 February 2023) using median method during the period from 1 November 2022 to 17 February 2023. Each panel shows respectively, (a) variations of TEC, (b) variations of DTEC (calculated by Equation (3)), (c) observed TEC anomalies without considering the solar-geomagnetic conditions and (d) observed TEC anomalies during quiet solar-geomagnetic conditions. The x-axis shows the days relative to the earthquake day. The y-axis represents the universal time. An asterisk “*” indicates the earthquake origin time. Therefore, the results of the analysis of the electron density parameter around the spatial and time range of the earthquake during the day and night show that this parameter value shows clear abnormal changes in the time interval of 1–5 days before the earthquake (Figures 3–6).
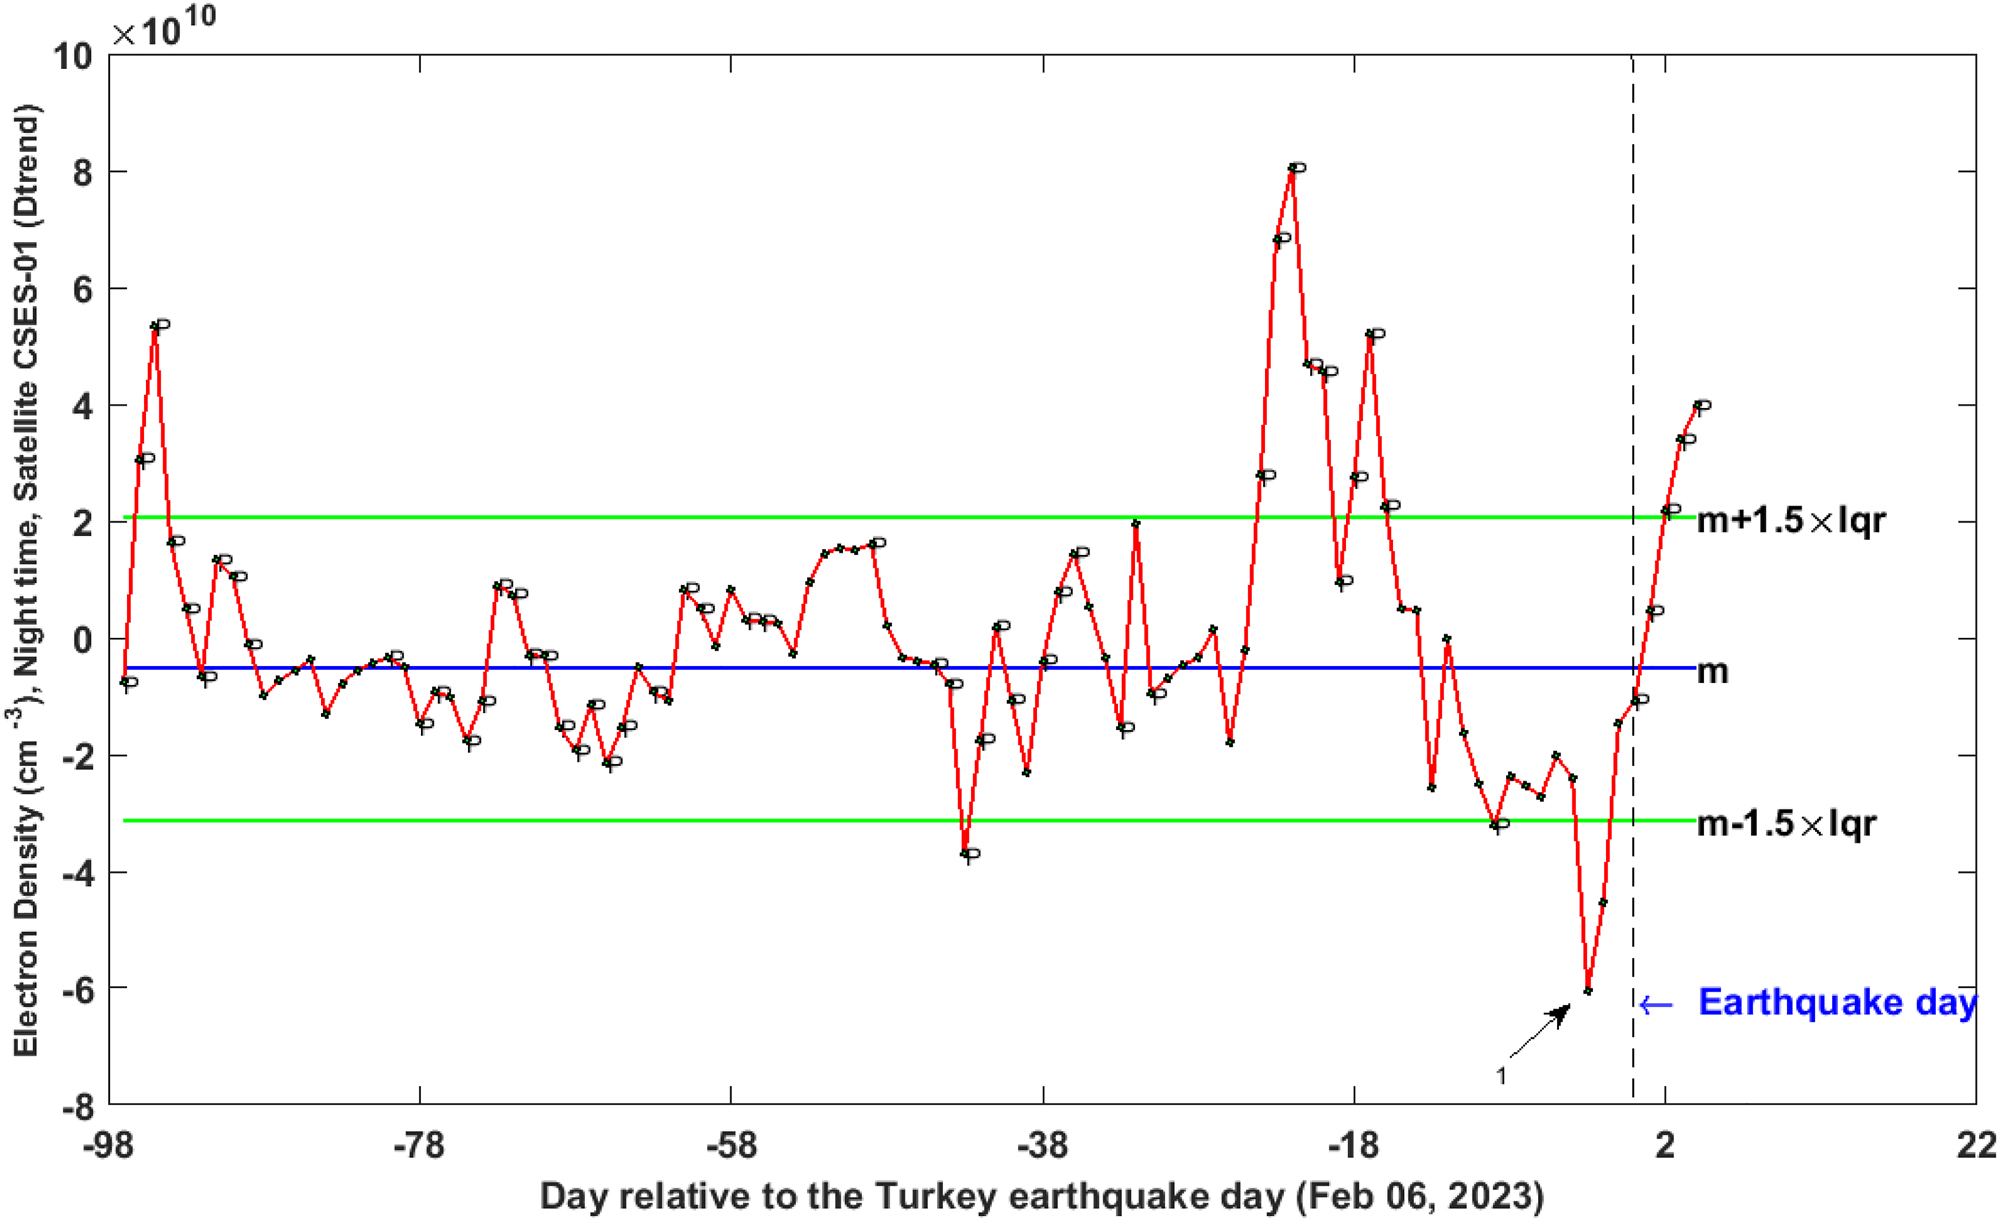
Same as Figure 3 but at night time.
![Figure 6:
Results of TEC analysis for the Turkey earthquake (6 February 2023) using median method during the period from 1 November 2022 to 17 February 2023. (a) TEC variations, (b) DTEC variations (DTEC is calculated according to Equation (3); where Dx = DTEC, c) observed TEC anomalies without considering the solar-geomagnetic conditions and (d) observed TEC anomalies by regarding the quiet solar-geomagnetic conditions. An asterisk “*” represents the earthquake origin time. The x-axis indicates the days relative to the earthquake day. The y-axis shows the universal time [10].](/document/doi/10.1515/jag-2024-0024/asset/graphic/j_jag-2024-0024_fig_006.jpg)
Results of TEC analysis for the Turkey earthquake (6 February 2023) using median method during the period from 1 November 2022 to 17 February 2023. (a) TEC variations, (b) DTEC variations (DTEC is calculated according to Equation (3); where Dx = DTEC, c) observed TEC anomalies without considering the solar-geomagnetic conditions and (d) observed TEC anomalies by regarding the quiet solar-geomagnetic conditions. An asterisk “*” represents the earthquake origin time. The x-axis indicates the days relative to the earthquake day. The y-axis shows the universal time [10].
Figures 7 and 8 show, respectively, the variations of the median value of the electron temperature parameter during the transit orbit of the CSESE-01 satellite inside the Dobrovolsky’s area of the Turkey earthquake epicentre in the period from November 1, 2022 to February 10, 2023 during the day and night. The value of electron temperature during the day in 11 days before the earthquake exceeds the lower limit by 46.94 % (black arrow 1 in Figure 7). Figure 7 also shows that the temperature of the electron in 3 and 4 days before the earthquake, similar to the changes in the electron density, had an abnormal behaviour and exceeded the defined upper limit by 16.45 % and 0.29 % (black arrow 2 in Figure 7). Figure 8 emphasizes that during the night, the electron temperature significantly exceeds the defined allowable range by 66.3 % in the 3 days before the earthquake (black arrow 2 in Figure 8). It can also be seen that the night-time value of the electron temperature in the 39 days before the earthquake has abnormal changes of 23.87 % (black arrow 1 in Figure 8), but since this abnormal day is between the days with intense solar-geomagnetic activities, there is little possibility that it is related with forthcoming seismic activities.

Same as Figure 3 but for the electron temperature parameter.
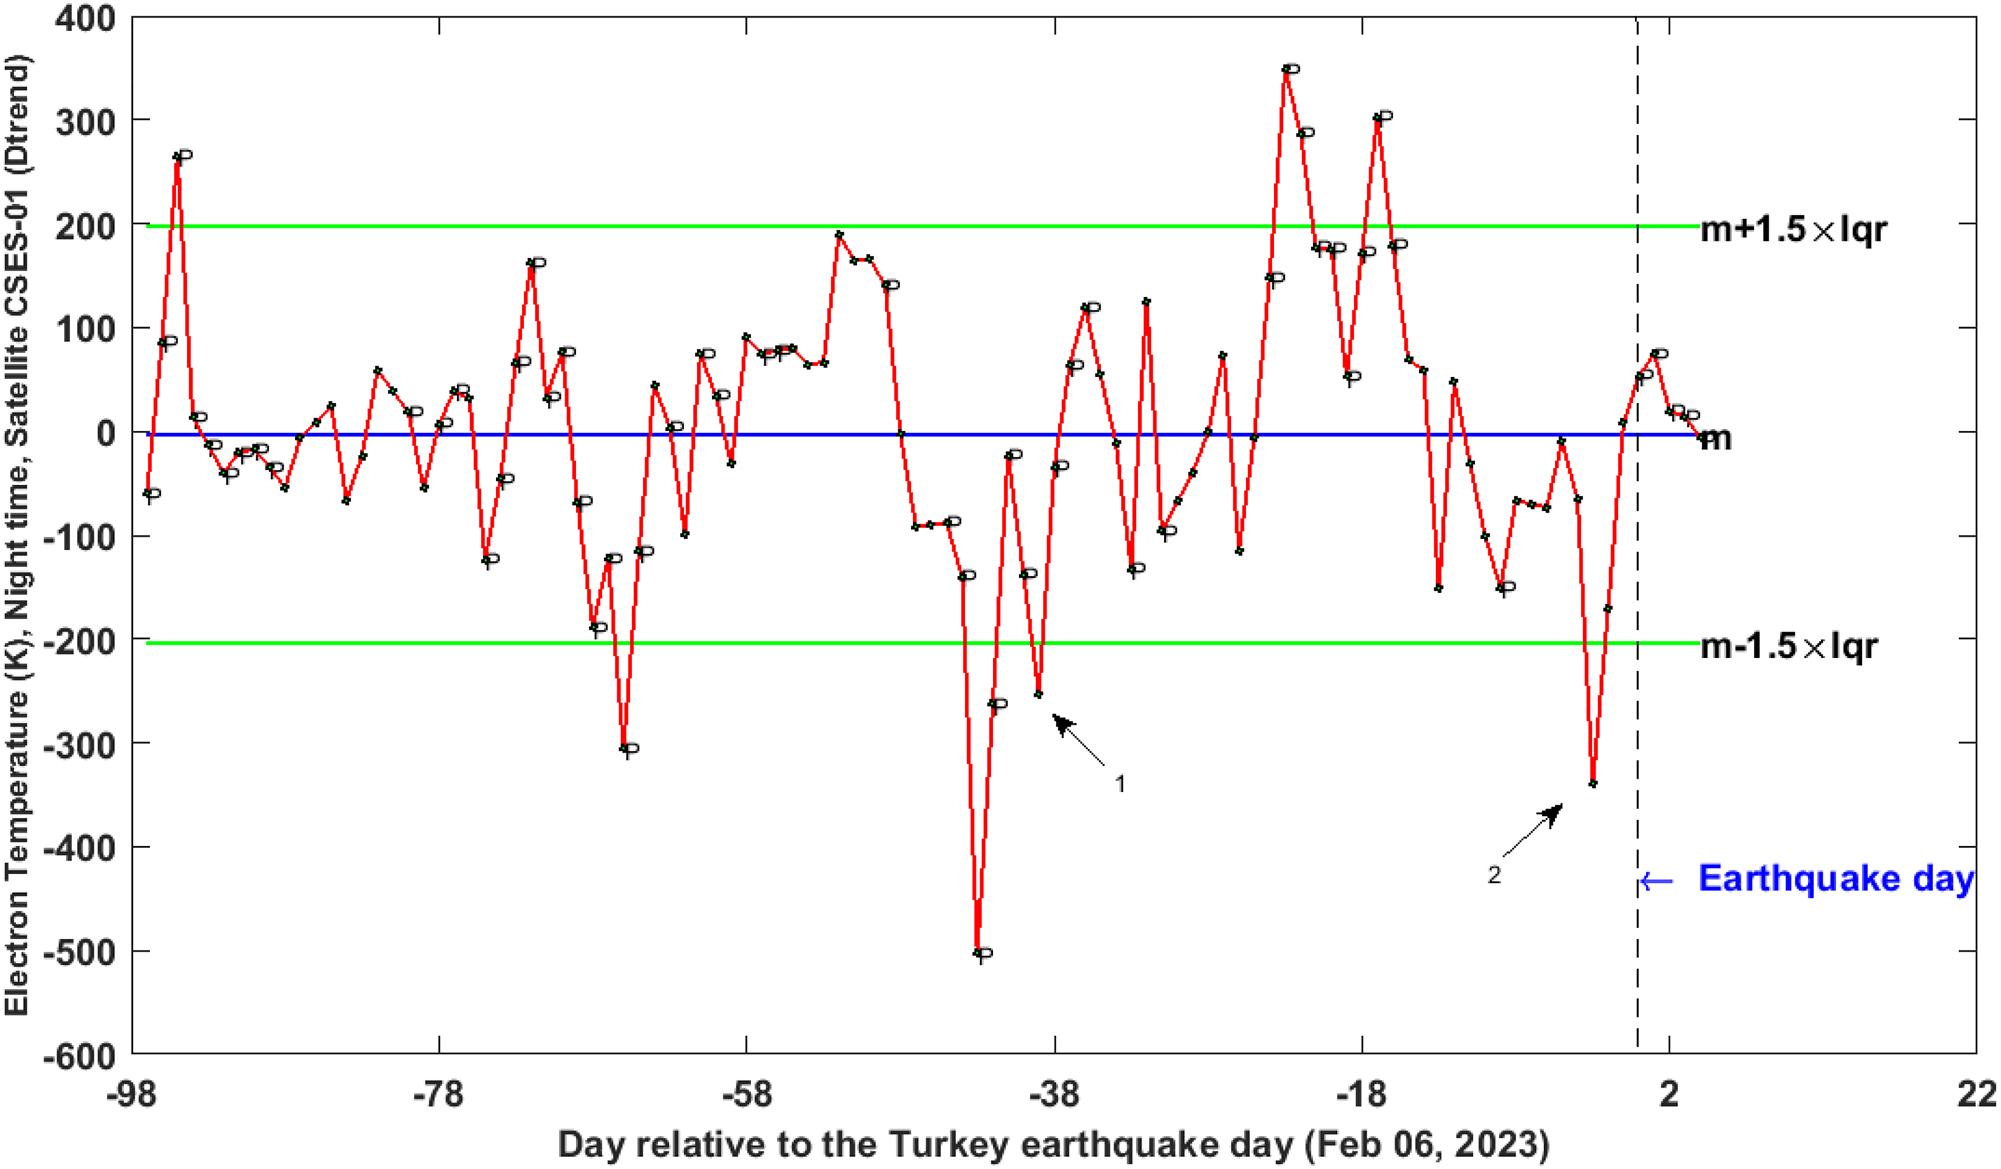
Same as Figure 7 but at night-time.
Figure 9 shows an overview of all anomalies observed in different layers of the Earth, including the lithosphere, atmosphere and ionosphere, in the period from November 1, 2022 to February 10, 2023. Times with intense solar and geomagnetic activity are shown with a red background and other times with a white background. The day of the earthquake is indicated by a black star. The x-axis shows days related to the day of the earthquake. The y-axis represents UTC time. Lithospheric, atmospheric and ionospheric anomalies are shown in green, blue and black colours, respectively. It can be seen that the land surface temperature as a lithospheric precursor has abnormal changes in the period from 19 to 12 days before the earthquake (black arrow 1 in Figure 9). After that, in the time interval of 9 days before the day of the earthquake, the studied atmospheric precursors including water vapour, methane, ozone, CO and AOD show anomalous variations (black arrow 2 in Figure 9). In the following, clear ionospheric anomalies in electron density and temperature parameters measured by CSES-01 and Swarm (A, B, C) and GPS-TEC satellites between 1 and 5 days before the earthquake are detected. The highest number of anomalies is observed between 1 and 5 days before the earthquake. Until today, various mechanisms have been proposed to justify the occurrence of anomalies in different physical and chemical parameters in different layers of the earth and the relation between these layers. None of these hypotheses have been conclusively proven. Some of them include: the production of electromagnetic waves due to piezo-electric and tribo-electric effects caused by the pressure of rocks near the epicentre of the earthquake [1]; Warm gases radiated due to melt fluids formed inside the earth before the earthquake [3]; the activation of positive roles due to the pressure of underground rocks and their reaching the surface of the earth [25]; the radiation of radioactive gas or metallic ions such as radon, which leads to an increase in the earth’s potential [26]; emission of atmospheric gravity waves (AGW) due to the creation of gas-water around the earthquake epicenter [3]. The ions created from the earth form a layer of charged particles before the earthquake, which plays an important role in the transmission of the electric field to the atmosphere and then to the ionosphere [27]–29]. Also, the generated seismic electric field affects the earth’s electromagnetic field lines and leads to changes in electron density and temperature before earthquakes [30]. Therefore, Figure 9 clearly shows the transmission of seismic anomalies in different layers of the earth in a period of about 15 days before the earthquake. But it should be noted that this time period and speed of transmission from the lower layers to the upper layers of the atmosphere and ionosphere and interaction between them, according to the characteristics of each earthquake such as magnitude, focal depth, geomorphology and tectonics of the region, can be variable in different case studies.
![Figure 9:
An overview of all anomalies observed in different layers of the earth, including the lithosphere, atmosphere and ionosphere, in the period from November 1, 2022 to February 10, 2023. Times with intense solar and geomagnetic activity are shown with a red background and other times with a white background. The day of the earthquake is indicated by a black star. The x-axis shows days related to the day of the earthquake. (CET, CSES electron temperature; CED, CSES electron density; SAE, Swarm A electron density; SAT, Swarm A electron temperature; SBE, Swarm B electron density; SBT, Swarm B electron temperature; SCE, Swarm C electron density; SCT, Swarm C electron temperature; AOD, aerosol optical depth; CO, carbon monoxide; Oz, ozone; Me, methane; WV, water vapor; NE, number of earthquakes; LST, land surface temperature). Arrows 1 and 2 indicate that lithospheric anomalies (arrow 1) were observed before atmospheric and ionospheric anomalies (arrow 2). Except the anomalies observed by CSES-01, the rest of the anomalies have been already analyzed in previous articles [9], 10].](/document/doi/10.1515/jag-2024-0024/asset/graphic/j_jag-2024-0024_fig_009.jpg)
An overview of all anomalies observed in different layers of the earth, including the lithosphere, atmosphere and ionosphere, in the period from November 1, 2022 to February 10, 2023. Times with intense solar and geomagnetic activity are shown with a red background and other times with a white background. The day of the earthquake is indicated by a black star. The x-axis shows days related to the day of the earthquake. (CET, CSES electron temperature; CED, CSES electron density; SAE, Swarm A electron density; SAT, Swarm A electron temperature; SBE, Swarm B electron density; SBT, Swarm B electron temperature; SCE, Swarm C electron density; SCT, Swarm C electron temperature; AOD, aerosol optical depth; CO, carbon monoxide; Oz, ozone; Me, methane; WV, water vapor; NE, number of earthquakes; LST, land surface temperature). Arrows 1 and 2 indicate that lithospheric anomalies (arrow 1) were observed before atmospheric and ionospheric anomalies (arrow 2). Except the anomalies observed by CSES-01, the rest of the anomalies have been already analyzed in previous articles [9], 10].
Returning to the data analysis and precursors searching we see that variations of all measured parameters (Figures 3, 5, 7 and 8) are suppressed by changes of F10.7 index (Figure 2c). It is seen that electron concentration (as well as records from the Swarm satellites) follow the F10.7 variations especially before the earthquake and the points in the upper figures marked as the candidate in precursors, actually seem consequences of the sharp F10.7 changes. It is not concluded that all marked outliers are due to F10.7 but it seems that situation is very complex and would be better to purify the data from the F10.7 effects as it was done for example in Pulinets et al. [31]. Figure 10 represents the results of the analysis of plasma parameters collected by CSES-01 after normalization and removing the effects of F10.7 parameter variations. The last column of the table shows these potentially pre-earthquake anomalies observed in the data collected by CSES-0, after normalization and removing the effects of changes in the F10.7 parameter. It can be seen that with this new analysis, there is no change in the observed anomalies in the parameter of electron temperature during day and night. But in the daytime data of electron density, on 17 and 11 days before the earthquake, as well as in the night data of electron density, on 26 and 17 days before the earthquake, new anomalies are detected, and some of the previously detected anomalies are removed.
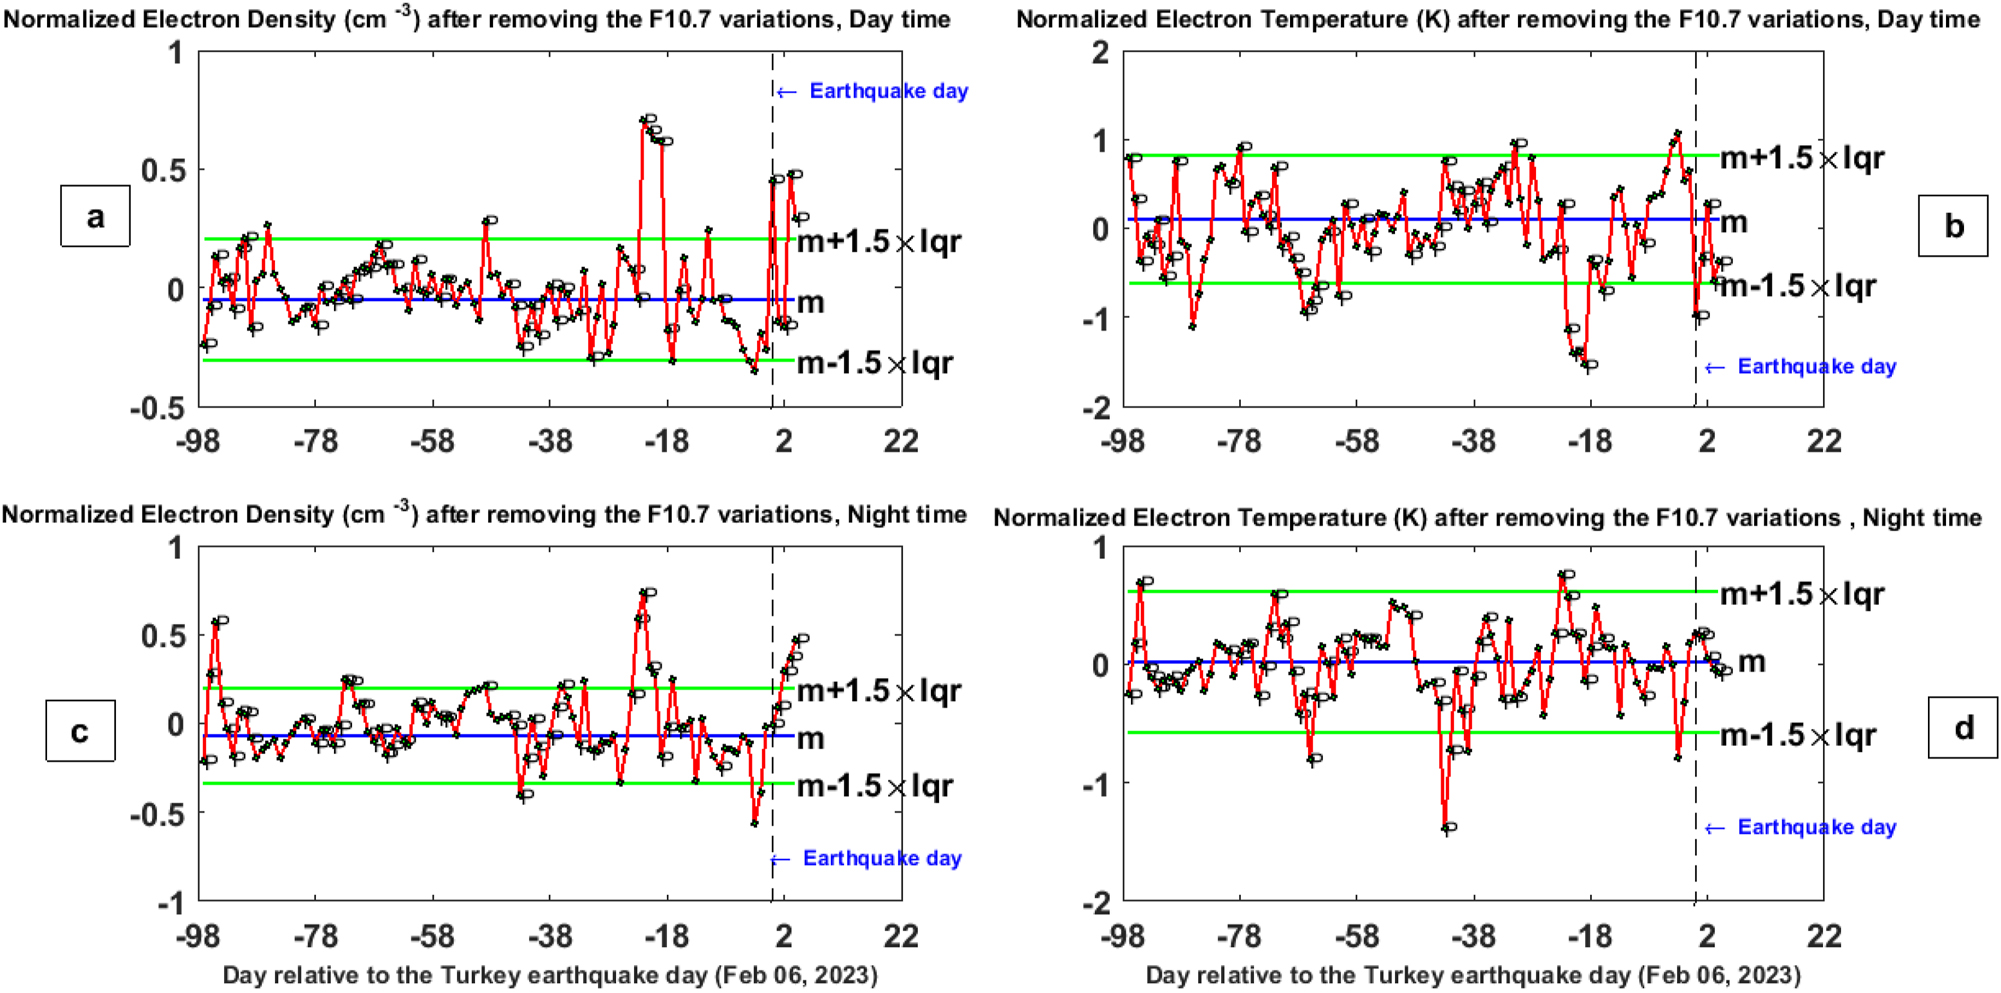
The results of the analysis of plasma parameters collected by CSES-01 after normalization and removing the effects of F10.7 parameter variations, (a) electron density during the day, (b) electron temperature during the day, (c) electron density during the night and (d) electron temperature in the night. The vertical dashed line shows the day of the earthquake. The horizontal axis shows the days before and after the earthquake occurrence. The green horizontal lines represent the upper and lower bounds m ± 1.5 × iqr. The blue horizontal line indicates the median value (m).
3 Conclusions
In this study, using the time series obtained from the data of CSES-01, abnormal variations in electron density and temperature parameters were observed in the period of 1–5 days before the event in the Dobrovolsky’s area the Turkey earthquake. In previous studies, clear ionospheric anomalies in GPS-TEC data in the time interval 1–3 days before the earthquake [10], as well as electron density and temperature data obtained from three Swarm satellites (A, B, C) in the time interval 1–8 days prior to main shock [9] have been observed. Therefore, this good agreement between CSES-01 and Swarm and GPS-TEC satellites data emphasizes the importance and necessity of using CSES-01 data in studies related to earthquake precursors. One of the main challenges of creating earthquake early warning systems is the uncertainty of the mechanism of occurrence of earthquake precursors in different layers of the earth (LAIC) and their with each other. For this purpose, it is necessary to make a comparative study between earthquake precursors obtained in different layers of the lithosphere, atmosphere and ionosphere. This process leads to the reduction of uncertainty in announcing the time of occurrence of large earthquakes in earthquake warning systems. It should be noted that the lithospheric anomalies (land surface temperature) are observed during the 19–12 days before the earthquake, and then most of the atmospheric anomalies (water vapour, methane, ozone, CO and AOD) are detected in the time period of 10–5 days prior to the earthquake and finally the striking ionospheric anomalies are appeared between 5 and 1 days prior to the earthquake.
Therefore, the findings of this study emphasize that prominent anomalies in the earthquake precursors in a time interval of about 15 days before the earthquake, first in the lithosphere and then in the upper layers, i.e. in the atmosphere and ionosphere, respectively are observed.
It is also necessary to mention that before the occurrence of powerful earthquake in Turkey, the solar and geomagnetic indices show abnormal variations, which is necessary to investigate the hypothesis of the relation between solar-geomagnetic activities and the occurrence of large earthquakes in this study area in the future studies.
Today, the variety of remote sensing satellites has increased significantly and the possibility of monitoring different layers of the earth with good spatial and temporal resolution has been provided. Several platforms such as GEE and Giovanni make available various products in the form of images and time series in different formats in the shortest possible time. The possibility of using different classical and intelligent algorithms in the analysis of time series of earthquake precursors has also provided the possibility of detecting complex and non-linear anomalies. As a result, we can hope to create earthquake warning systems with low uncertainty in the future.
Acknowledgments
The author would like to acknowledge the China National Space Administration and Italian Space Agency for the data of CSES-01 available upon request and formal approval at www.leos.ac.cn, Space Weather Canada for the solar data that are freely available at https://www.spaceweather.gc.ca/solarflux/sx-5-flux-en.php, Giovanni web site for the atmospheric data that are freely available at http://giovanni.sci.gsfc.nasa.gov/giovanni/, the China Earthquake Administration, The Global USGS earthquake catalogue is freely available from https://earthquake.usgs.gov/earthquakes, European Space Agency (ESA) for the Swarm data that are freely available at HTTP or FTP (anonymous login) erver: swarm-diss.eo.esa.int and NASA NOAA for the geomagnetic indices that are freely available at https://www.ngdc.noaa.gov/geomag/indices/indices.html.
-
Research ethics: Not applicable.
-
Author contributions: The author has accepted responsibility for the entire content of this manuscript and approved its submission.
-
Competing interests: The author states no conflict of interest.
-
Research funding: No funding.
-
Data availability: The raw data can be obtained on request from the corresponding author.
References
1. Parrot, M. Use of satellites to detect seismo-electromagnetic effects, main phenomenological features of ionospheric precursors of strong earthquakes. Adv Space Res 1995;15:1337–47.10.1016/0273-1177(95)00072-MSearch in Google Scholar
2. Liu, JY, Chuo, YJ, Shan, SJ, Tsai, YB, Pulinets, SA, Yu, SB, et al.. Pre-earthquake-ionospheric anomalies registered by continuous GPS TEC. Ann Geophys 2004;22:1585–93. https://doi.org/10.5194/angeo-22-1585-2004.Search in Google Scholar
3. Hayakawa, M, Molchanov, OA. Seismo- electromagnetics: lithosphere-atmosphere-ionosphere coupling. Tokyo: Terra Scientific Publishing Co; 2002:477 p.Search in Google Scholar
4. Pulinets, SA, Boyarchuk, KA. Ionospheric precursors of earthquakes. Berlin: Springer; 2004.Search in Google Scholar
5. Akhoondzadeh, M, Parrot, M, Saradjian, MR. Electron and ion density variations before strong earthquakes (M > 6.0) using DEMETER and GPS data. Nat Hazards Earth Syst Sci 2010;10:7–18. https://doi.org/10.5194/nhess-10-7-2010.Search in Google Scholar
6. De Santis, A, Balasis, G, Pavón-Carrasco, FJ, Cianchini, G, Mandea, M. Potential earthquake precursory pattern from space: the 2015 Nepal event as seen by magnetic Swarm satellites. Earth Planet Sci Lett 2017;461:119–26. https://doi.org/10.1016/j.epsl.2016.12.037.Search in Google Scholar
7. Akhoondzadeh, M, Marchetti, D. Developing a fuzzy inference system based on multi-sensor data to predict powerful earthquake parameters. Rem Sens 2022;14:3203. https://doi.org/10.3390/rs14133203.Search in Google Scholar
8. Pulinets, SA, Ouzounov, D. Lithosphere-atmosphere-ionosphere coupling (LAIC) model – an unified concept for earthquake precursors validation. J Asian Earth Sci 2011;41:371–82. https://doi.org/10.1016/j.jseaes.2010.03.005.Search in Google Scholar
9. Akhoondzadeh, M, Marchetti, D. Study of the preparation phase of Turkey’s powerful earthquake (6 February 2023) by a geophysical multi-parametric fuzzy inference system. Rem Sens 2023;15:2224. https://doi.org/10.3390/rs15092224.Search in Google Scholar
10. Akhoondzadeh, M. Kalman filter, ANN-MLP, LSTM and ACO methods showing anomalous GPS-TEC variations concerning Turkey’s powerful earthquake (6 February 2023). Rem Sens 2023;15:3061. https://doi.org/10.3390/rs15123061.Search in Google Scholar
11. Parrot, M. The micro-satellite DEMETER. J Geodyn 2002;33:535–41. https://doi.org/10.1016/S0264-3707(02)00014-5.Search in Google Scholar
12. Haagmans, R, Bock, R, Rider, H. Swarm; ESA’s magnetic field mission; 2013. Available from: https://earth.esa.int/documents/700255/1805948/ESA+magnetic+field+mission/36942f02-b2d4-4787-af81-eb19efb74265.Search in Google Scholar
13. Catapano, F, Buchert, S, Qamili, E, Nilsson, T, Bouffard, J, Siemes, C, et al.. Swarm Langmuir probes’ data quality validation and future improvements. Geosci Instrum Methods Data Syst 2022;11:149–62. https://doi.org/10.5194/gi-11-149-2022.Search in Google Scholar
14. Xiong, C, Jiang, H, Yan, R, Lühr, H, Stolle, C, Yin, F, et al.. Solar flux influence on the in-situ plasma density at topside ionosphere measured by Swarm satellites. J Geophys Res Space Phys 2022;127:e2022JA030275. https://doi.org/10.1029/2022ja030275.Search in Google Scholar
15. Akhoondzadeh, M, De Santis, A, Marchetti, D, Shen, X. Swarm-TEC satellite measurements as a potential earthquake precursor together with other Swarm and CSES data: the case of Mw7.6 2019 papua new guinea seismic event. Front Earth Sci 2022;10:820189. https://doi.org/10.3389/feart.2022.820189.Search in Google Scholar
16. Shen, XH, Zhang, XM, Yuan, SG, Wang, LW, Cao, JB, Huang, JP, et al.. The state-of-the-art of the China seismo-electromagnetic satellite mission. Sci China Technol Sci 2018;61:634–42. https://doi.org/10.1007/s11431-018-9242-0.Search in Google Scholar
17. Pignalberi, A, Pezzopane, M, Coco, I, Piersanti, M, Giannattasio, F, De Michelis, P, et al.. Inter-calibration and statistical validation of topside ionosphere electron density observations made by CSES-01 mission. Rem Sens 2022;14:4679. https://doi.org/10.3390/rs14184679.Search in Google Scholar
18. Dobrovolsky, IR, Zubkov, SI, Myachkin, VI. Estimation of the size of earthquake preparation zones. Pure Appl Geophys 1979;117:1025–44. https://doi.org/10.1007/bf00876083.Search in Google Scholar
19. De Santis, A, Marchetti, D, Perrone, L, Campuzano, AS, Cianchini, G, Cesaroni, C, et al.. Statistical correlation analysis of strong earthquakes and ionospheric electron density anomalies as observed by CSES-01. Il Nuovo Cimento 2021;44:1–14. https://doi.org/10.1393/ncc/i2021-21119-1.Search in Google Scholar
20. Aumann, HH, Chahine, MT, Gautier, C, Goldberg, MD, Kalnay, E, McMillin, LM, et al.. AIRS/AMSU/HSB on the aqua mission: design, science objectives, data products, and processing systems. IEEE Trans Geosci Rem Sens 2003;41:253–64. https://doi.org/10.1109/TGRS.2002.808356.Search in Google Scholar
21. Mayaud, PN. Derivation, meaning and use of geomagnetic indices. Geophysical monograph series. Washington, DC: American Geo. Union; 1980, vol 22.10.1029/GM022Search in Google Scholar
22. Matzka, J, Bronkalla, O, Tornow, K, Elger, K, Stolle, C. Geomagnetic kp index. V. 1.0. GFZ Data Serv 2021. https://doi.org/10.5880/Kp.0001.Search in Google Scholar
23. Nose, M, Iyemori, T, SugiuraKamei, MT. World data center for geomagnetism. Geomagn Dst Index 2015. https://doi.org/10.17593/14515-74000.Search in Google Scholar
24. Akhoondzadeh, M, De Santis, A. Is the apparent correlation between solar-geomagnetic activity and occurrence of powerful earthquakes a casual artifact? Atmosphere 2022;13:1131. https://doi.org/10.3390/atmos13071131.Search in Google Scholar
25. Freund, F. Stress-activated positive hole charge carriers in rocks and the generation of pre-earthquake signals. In: Hayakawa, M, editor. Electromagnetic phenomena associated with earthquakes. Trivandrum: Transworld Research Network; 2009:41–96 pp.Search in Google Scholar
26. Pulinets, SA, Legen, AD, Gaivoronskaya, TV, Depuev, VK. Main phenomenological features of ionospheric precursors of strong earthquakes. J Atmos Sol Terr Phys 2003;65:1337–47. https://doi.org/10.1016/j.jastp.2003.07.011.Search in Google Scholar
27. Park, CG, Dejnakarintra, M. Penetration of thundercloud electric fields into the ionosphere and magnetosphere, 1. Middle and auroral latitudes. J Geophys Res 1973;84:960–4.10.1029/JA078i028p06623Search in Google Scholar
28. Kim, VP, Hegai, VV, Illich-Svitych, PV. On one possible ionospheric precursor of earthquakes. Phys Solid Earth 1994;30:223–6.Search in Google Scholar
29. Pulinets, SA, Boyarchuk, KA, Hegai, VV, Kim, VP, Lomonosov, AM. Quasielectrostatic model of atmosphere-thermosphere-ionosphere coupling. Adv Space Res 2000;26:1209–18. https://doi.org/10.1016/s0273-1177(99)01223-5.Search in Google Scholar
30. Namgaladze, AA, Klimenko, MV, Klimenko, VV, Zakharenkova, IE. Physical mechanism and mathematical modelling of earthquake ionospheric precursors registered in total electron content. Geomagn Aeron 2009;49:252–62. https://doi.org/10.1134/s0016793209020169.Search in Google Scholar
31. Pulinets, MS, Budnikov, PA, Pulinets, SA. Global ionospheric response to intense variations of solar and geomagnetic activity according to the data of the GNSS global networks of navigation receivers. Geomagn Aeron 2023;63:60–73. https://doi.org/10.1134/s0016793222600898.Search in Google Scholar
© 2024 Walter de Gruyter GmbH, Berlin/Boston
Articles in the same Issue
- Frontmatter
- Review
- Advancing polar motion prediction with derivative information
- Original Research Articles
- Analyses of data from the first Chinese seismo electromagnetic satellite (CSES-01) together with other earthquake precursors associated with the Turkey earthquakes (February 6, 2023)
- Regional evaluation of global geopotential models and three types of digital elevation models with ground-based gravity and GNSS/levelling data using several techniques over Sudan
- Correlation between rate of TEC index and positioning error during solar flares and geomagnetic storms using navigation with Indian constellation receiver measurements
- Analyzing recent deformation in Wadi Hagul, Eastern Desert, Egypt, via advanced remote sensing and geodetic data processing
- Monitoring of a rockfill embankment dam using TLS and sUAS point clouds
- The Modified Ambiguity Function Approach with regularization for instantaneous precise GNSS positioning
- A new challenge for cadastral surveying in Taiwan: feasibility analysis using combination on CORS data and online PPP service
- Occurrence characteristics of ionospheric scintillations in the civilian GPS signals (L1, L2, and L5) through a dedicated scintillation monitoring receiver at a low-latitude location in India during the 25th solar cycle