Collusion and Price Behavior in the U.S. Pork Industry
-
Yuliya V. Bolotova


Abstract
This research analyzes the U.S. pork industry dynamics in light of the alleged output price-fixing cartel of the largest pork processors revealed in the antitrust lawsuits filed by pork buyers beginning in 2018. The empirical evidence may suggest that pork production, the farm, wholesale, and retail values of pork, and marketing margins increased, but the farm sector share decreased in the cartel period (2009–2019), as compared with the pre-cartel period (1998–2008). The wholesale pork pricing by pork processors is consistent with oligopoly pricing in both the pre-cartel and cartel periods. While the estimated decrease in cost pass-through between these two periods may reflect an increase in the seller (oligopoly) market power of pork processors in the cartel period, this cost pass-through decrease is not statistically significant from zero. The retail pork pricing by food retailers is consistent with perfectly competitive pricing in both the pre-cartel and cartel periods.
1 Introduction
Beginning in 2009, several largest U.S. pork processors implemented production cuts at various stages of the pork supply chain to mitigate the oversupply problem adversely affecting their profitability. Some of these pork processors are vertically integrated companies, who make decisions affecting hog quantities produced at the farm (production) level through either direct farm ownership or via production contracts.
Beginning in 2018, pork buyers started filing class action antitrust lawsuits against the largest pork processors alleging that by implementing production cuts the pork processors engaged in an unlawful conspiracy with the purpose of fixing, increasing, and stabilizing wholesale and retail pork prices as early as January 2009 and violated Section 1 of the Sherman Antitrust Act (1890) (National Hog Farmer 2018; USA TODAY 2018).
This research analyzes the U.S. pork industry dynamics (changes in pork production and availability; the farm, wholesale, and retail values of pork; marketing margins; farm sector share; and the nature of wholesale and retail pork pricing) in light of the alleged output (pork) price-fixing cartel of the largest pork processors. Section 2 provides the U.S. pork industry background. Section 3 describes production cuts and the alleged pork price-fixing cartel. Section 4 presents a descriptive statistical analysis of pork production and availability, pork values, marketing margins, and farm sector share in the U.S. pork supply chain in the period of alleged pork price-fixing cartel and a prior (more competitive) period. Section 5 introduces a theoretical framework explaining the relationship between wholesale and farm pork prices and the relationship between retail and wholesale pork prices by focusing on cost pass-throughs at the wholesale and retail levels of the pork supply chain. Section 6 presents econometric models of wholesale and retail pork pricing. Section 7 summarizes the estimation results and is followed by the conclusion.
2 U.S. Pork Industry: Structure and Hog Procurement Practices
The U.S. pork industry is concentrated, meaning that several large pork processors control most of pork production and marketing in the country (MacDonald, Dong, and Fuglie 2023). In 2007 (prior to the implementation of production cuts), the combined market share of the five largest pork processors was 74.3 % (Congressional Research Service 2009). As of 2007, Smithfield Foods and Tyson Foods were the two largest firms in the pork industry, with respective market shares of 28.4 and 17.6 %; JBS USA was the third largest firm with a market share of 11.1 % (Congressional Research Service 2009).
Market concentration in the pork industry decreased in recent years. Because several new pork processing plants owned by hog producers were opened in Iowa, Minnesota, and Michigan in the last few years, the combined market share of the four largest pork processors decreased from approximately 70 % in 2016 to 64 % in 2020 (Meyer and Goodwin 2021). As of 2020, the four largest firms in the pork industry were Smithfield Foods, JBS USA, Tyson Foods, and Clemens Food Group, followed by Seaboard Farms and Triumph Foods (Table 1).
The 10 largest companies in the U.S. pork industry and their market shares, 2020.
| Company | Plant slaughter capacity | Market share | |
|---|---|---|---|
| Heads per day | % | ||
| 1 | Smithfield | 130,300 | 25.4 |
| 2 | JBS | 93,000 | 18.2 (43.6) |
| 3 | Tyson Foods | 81,800 | 16.0 (59.5) |
| 4 | Clemens Food Group | 23,700 | 4.6 (64.2) |
| 5 | Seaboard Farms, OK | 22,500 | 4.4 (68.6) |
| 6 | Triumph Foods | 21,300 | 4.2 (72.7) |
| 7 | Seaboard Farms, IA | 20,400 | 4.0 (76.7) |
| 8 | Hormel | 19,000 | 3.7 (80.4) |
| 9 | Indiana Packing Co. | 16,700 | 3.3 (83.7) |
| 10 | WholeStone Farms | 11,500 | 2.2 (85.9) |
| Industry total | 512,370 | 100.0 |
-
The pork plant slaughter capacity is from Meyer (2020). Market shares are calculated by the author. The cumulative market shares are in parentheses.
To procure hogs used to produce pork products, pork processors use a variety of contractual arrangements: the spot (cash) market, marketing (forward) contracts, and production contracts (Greene 2019; Lawrence et al. 2019). Under spot and marketing contracts, hog producers (farmers) sell hogs to pork processors. Hog producers own hogs and are responsible for making production, marketing, and pricing decisions (Bolotova 2022a).
In recent decades, the use of production contracts between hog producers and pork processors has increased (Davis et al. 2022; McBride and Key 2013). For example, the share of hogs raised under production contracts was 69 % in 2015 (Davis et al. 2022). According to production contracts, hog producers raise (feed and finish) pigs/hogs for pork processors in exchange for a payment (fee). Pork processors own pigs/hogs that hog producers raise for them. Consequently, pork processors make decisions that affect hog quantities produced by hog producers under these contracts.
Production contracts specify responsibilities of pork processors and hog producers (Davis et al. 2022; Lawrence et al. 2019; McBride and Key 2013; Swinton and Martin 1997). Typically, under production contracts pork processors are responsible for providing pigs, feed, veterinary and medical supplies and services, transportation of pigs to and from the farms, and they also determine production management practices. Hog producers are responsible for providing hog housing facilities, land, labor, utilities, operating expenses, and following production management practices determined by the processor.
3 Production Cuts and Alleged Pork Price-Fixing Cartel
3.1 Production Cuts in the U.S. Pork Supply Chain
A dramatic increase in feed prices, coupled with the effects of hog production and price developments, adversely affected the profitability of pork processors beginning in 2009 (Giamalva 2014; Hofstrand 2009; Hurt 2008; In Re Pork Antitrust Litigation 2020). Excessive pork supplies started being observed by the end of 2007 and continued in 2008 indicating a pork oversupply (overproduction) problem (Hurt 2008). In addition, the prices of corn and soybean meal, the two major feed types used in hog production, started increasing dramatically in 2008 (Becker 2008; Hofstrand 2009; Schnepf 2008). Pork processors, who used production contracts with hog producers, had to pay higher feed prices. Feed costs account for more than 65 % of all pork production expenses (Pork Checkoff 2009–2011). Pork processors, who purchased their hogs using the spot market and/or marketing contracts, had to pay higher hog prices, which were due to higher feed prices.
The largest pork processors implemented production cuts at various stages of the pork supply chain beginning in 2009 (In Re Pork Antitrust Litigation 2020). These production cuts were necessary to decrease quantities of hogs and pork produced in the period of increasing feed prices and weakening pork demand to maintain a viable profitability level of pork processors and to avoid financial losses (Giamalva 2014; Hofstrand 2009; Hurt 2008; Lawrence et al. 2008).
The largest pork processors periodically made public statements revealing the industry oversupply problem adversely affecting their profitability and their intent to implement production cuts. The following excerpts are four examples.
| “In May 2009, …, the CEO and President of Smithfield, stated: In terms of chronology of how I say we proactively managed this business, in February of last year--February of ‘08, not February of ‘09-- we made the decision with the over-supply of livestock to take the leadership position and start reducing our sow herds because we saw the overproduction and the oversupplies of the hogs into the market, which was driving our hog market down. We started a reduction of 50,000 sows and 1 million of our 18 million pigs, we started taking out of the system. ”” (In Re Pork Antitrust Litigation 2020: paragraph 138). |
| “In July 2009, Smithfield’s CEO went on to note in Smithfield’s annual report in July 2009: “I strongly believe that the hog production industry has reached an inflection point where, due to deep and extended losses, liquidation is now a recognized reality by all in the industry. To date, Smithfield has already reduced the size of its U.S. herd by two million market hogs annually, and we are initiating a further reduction of 3 % of our U.S. sow herd, effective immediately. This reduction, combined with the additional cuts by our fellow producers should shrink supply to a point where the industry can return to profitability. This liquidation is long overdue.” (Emphasis added).” (In Re Pork Antitrust Litigation 2020: paragraph 141). |
| “In August of 2009, Tyson Foods, Inc. Chief Operating Officer, …, confirmed: Hog supplies will be down in Q4 year over year but still adequate. We do expect to see liquidation accelerate and pork production decrease into 2010 and beyond to improve producer profitability. We will continue to watch forward hog supplies to drive more exports, monitor demand, focus on cost, mix, and pricing to generate revenue.” (In Re Pork Antitrust Litigation 2020: paragraph 142). |
| “In September 2009, the CEO of Smithfield stated that he had conversations with “sizable large producers” and that they would be doing some liquidation: We can’t solve the problem. But the answer to that is yes, I have had conversations with several sizable, more than sizable large producers, in fact very large producers, and I would tell you they are doing some liquidation. But again, I don’t think they can solve it. |
| I think this industry has got to solve it collectively. I do believe everyone is now looking, and when I’m talking to people who are financially extremely strong and they are cutting back, that’s got to be a statement about those people who are not financially strong. But the answer is, yes, there are others cutting back. We’re not the only one. ” (In Re Pork Antitrust Litigation 2020: paragraph 145). |
3.2 Alleged Pork Price-Fixing Cartel
In 2018, pork buyers at the wholesale and retail levels started filing class action antitrust lawsuits against the largest pork processors in the country alleging that they engaged in an unlawful pork price-fixing conspiracy as early as January 2009. Smithfield, Tyson, JBS/Cargill, Hormel, Seaboard, Triumph, Clemens, and Indiana Packers were named as the defendants in the complaints filed with the court (In Re Pork Antitrust Litigation 2020, 2022). The complaints state that the largest pork processors implemented the following allegedly anticompetitive and coordinated production cuts to decrease quantities of hogs and pork produced to increase wholesale and retail pork prices with the purpose of increasing their profit (In Re Pork Antitrust Litigation 2020: paragraphs 119–163).
At the breeding stage, the pork processors decreased the size of breeding stocks and the number of female hogs. Because of the increasing use of production contracts, pork processors had some control over the breeding stage of the pork supply chain.
At the production stage, the pork processors increased the use of production contracts. Consequently, they increased control over hog quantities procured under these contracts and over pork quantities they produced.
At the production stage, the pork processors decreased the number of hogs by implementing partial liquidations of their herds.
At the processing stage, the pork processors controlled hog slaughter rates and decreased the plant capacity utilization (decreased hog quantities processed at a plant).
The pork processors increased pork export volume, which decreased pork quantities available for domestic market.
The pork processors reported that pork prices increased following production cuts. For example, in its 2016 annual report, JBS stated that pork prices increased by 18 % at the end of 2016 following increased demand and output restrictions (In Re Pork Antitrust Litigation 2020: paragraph 127).
The pork buyers (plaintiffs) alleged that the largest pork processors engaged in a pork price-fixing conspiracy (cartel) by publicly communicating their intentions to implement production cuts and by sharing private, competitor-sensitive information related to production, cost, and profit for the purpose of benchmarking the performance of individual firms. The information exchanges were accomplished by partnering with Agri Stats, a third-party data aggregation service (In Re Pork Antitrust Litigation 2020: paragraphs 34–66). This firm gathered competitor-sensitive confidential data related to production, costs, and financial performance from pork processors, processed these data, and shared the results with the processors. The benchmarking efforts accomplished using the Agri Stats data were expected to improve the profitability of pork processors.
Classic cartels are typically organized in oligopolistic markets characterized by a high level of market concentration (a relatively small number of large sellers), a homogeneous product with inelastic demand, and high barriers to entry (Bolotova 2009; Carlton and Perloff 2004; Stigler 1964). When oligopolists form a cartel, they aim to act as a single monopolist to increase their joint profit (Besanko and Braeutigam 2002). To be successful, cartel members must develop an effective agreement affecting their product prices and/or quantities in a way that increases their joint profit and effectively enforce this agreement. Cartel members should be able to prevent cheating of individual cartel members on the agreement. The latter occurs when a cartel member aims to increase their individual profit, instead of acting in a way that would increase the joint profit of cartel participants.
In their complaints, the pork buyers (plaintiffs) argued that the pork industry structure and characteristics facilitated a successful price-fixing conspiracy of the largest pork processors and contributed to its success (In Re Pork Antitrust Litigation 2020, 2022). As it is stated in the complaint filed by direct buyers, the pork industry is highly concentrated, has high barriers to entry, pork is a homogeneous product with inelastic demand, and pork processors have numerous opportunities to collude (In Re Pork Antitrust Litigation 2020: paragraphs 82–118).
First, a high level of concentration coupled with the extensive use of production contracts allows the largest pork processors to control the entire pork supply chain (from farm to retail) and effectively coordinate their pork pricing. The combined market share of the largest pork processors, who implemented production cuts, was approximately 80 %. Second, it is too costly and time consuming for new firms to enter pork processing. It would take hundreds of millions of dollars to construct a large-scale pork processing plant. In addition, new entrants would have to incur additional costs to obtain the required permits.
Third, pork is a homogenous product, meaning that it is practically indistinguishable across pork processors. For example, pork loin manufactured by Tyson is practically indistinguishable from pork loin manufactured by Smithfield. Pork loins produced by both firms have similar nutritional values, packaging, and branding. Producers of homogenous products compete on price. Product homogeneity makes it easier for cartel participants (pork processors) to develop an agreement on a common price structure and effectively enforce it. The demand for pork is inelastic, meaning that consumers will not quickly decrease quantities of pork they purchase in response to increasing pork prices.
Fourth, the largest pork processors have numerous opportunities to collude. The largest pork processors are members of several industry organizations, and they also participate in the industry meetings taking place on a regular basis. During the industry meetings and events, the representatives of the largest pork processors have opportunities to communicate and share companies’ current and future business plans, as well as discuss production, pricing, and other non-public proprietary information in informal settings. Finally, the benchmarking service provided by Agri Stats allowed the largest pork processors to effectively enforce their price-fixing agreement. The pork processors used data provided by Agri Stats to monitor each other’s compliance with their agreement affecting pork production and pricing and to detect and/or prevent cheating of individual pork processors on their cartel agreement.
The pork buyers claimed that the alleged pork price-fixing cartel was a violation of Section 1 of the Sherman Act (1890). As a result, they had to pay higher prices for pork products and were overcharged. Section 1 of the Sherman Act prohibits contracts, combinations, and conspiracies in restraint of trade in interstate commerce. Price-fixing agreements (cartels or conspiracies) are examples of the restraints of trade that are most damaging to the market. Price-fixing agreements aim to increase, decrease, or fix (stabilize) product prices, and can be verbal, written or inferred from the conduct of firms (Federal Trade Commission 2024).
The market effects of a typical output price-fixing cartel are a decrease in the product quantity available in the market, an increase in the product price buyers pay, a welfare transfer from buyers to producers (overcharge), and a deadweight loss, due to which there are buyers who do not purchase the product because of higher prices (Besanko and Braeutigam 2002; Hovenkamp 2005).[1] The overcharge is the basis for damages that plaintiffs aim to recover during antitrust litigations.
Cartel overcharge measured in $ per unit is the difference between the price charged by cartel members and a more competitive (benchmark or but-for) price (Bolotova 2009; Connor and Bolotova 2006; Nieberding 2006). The latter is a price that would exist in the market if collusion did not take place. The price before collusion and the price after collusion are some examples of the benchmark (but-for) prices (Connor and Bolotova 2006).
The total $ overcharge attributed to all buyers of the cartelized product is the overcharge measured in $ per unit times product quantity sold/purchased during the cartel period. This product quantity is affected by the cartel period length, which may be defendant-specific, depending on the period during which each defendant was involved in collusive actions. During antitrust litigations, overcharges are calculated using transaction prices and quantities obtained from the defendants.[2]
The overcharge measured in $ per pound of pork can be generally defined as the difference between the pork price charged by pork processors-defendants in the alleged cartel period and the pork price they would have charged absent the cartel. An example of the latter price is the pork price that pork processors-defendants charged in the pre-cartel period.
The buyers who purchase pork products directly from the pork processors-defendants (for example, food retailers and wholesalers) are entitled to recover treble damages (three times the overcharge) under the Clayton Act (1914), a federal law. The buyers who purchase pork products indirectly from the pork processors-defendants (for example, final consumers) are entitled to recover damages in selected states, where antitrust or similar laws allowing indirect buyers to recover damages due to antitrust violations exist.
As of March 2024, Smithfield Foods, JBS USA, and Seaboard settled the lawsuit with direct pork purchasers for $77.3643 million, $24.5 million, and $9.750 million, respectively (Pork Antitrust Litigation webpage 2024).[3] As of March 2024, Smithfield Foods and JBS USA settled the lawsuit with indirect pork purchasers for $75 million and $20 million, respectively (Pork Indirect Purchaser Antitrust Litigation webpage 2024). In their settlement agreements, these pork processors did not admit to any wrongdoing.
4 Descriptive Statistical Analysis
4.1 Pork Production, Export, and Availability
Table 2 summarizes descriptive statistics for the U.S. yearly pork production, export, availability for domestic consumption, and availability per capita for the period of alleged price-fixing cartel (the cartel period: 2009–2019) and a prior, more competitive period (the pre-cartel period: 1998–2008).[4] The yearly average pork production increased from 20,338 million pounds in the pre-cartel period to 24,239 million pounds in the cartel period (or by 19 %).[5] While the implementation of production cuts on average did not decrease pork quantities produced in the cartel period, it might have decreased the pork production’s growth rate.
U.S. pork production, export, and availability (1998–2019).
| Average/coefficient of variation (CV) | Pork production | Pork export | Pork availability | Pork availability per capita |
|---|---|---|---|---|
| Million pounds | Pounds | |||
| Pre-cartel period: 1998–2008 | ||||
|
|
||||
| Yearly average | 20,338 | 2,209 | 18,933 | 65 |
| CV | 0.07 | 0.48 | 0.02 | 0.02 |
|
|
||||
| Cartel period: 2009–2019 | ||||
|
|
||||
| Yearly average | 24,239 | 5,186 | 19,781 | 62 |
| CV | 0.07 | 0.13 | 0.07 | 0.05 |
|
|
||||
| Change: cartel period, relative to pre-cartel period | ||||
|
|
||||
| Yearly average | 3,901 | 2,977 | 848 | −3 |
| Yearly average (%) | 19 | 135 | 4 | −5 |
| CV | 0.002 | −0.36 | 0.04 | 0.03 |
| CV (%) | 3 | −74 | 205 | 122 |
-
Data Source: USDA ERS (2022a). CV is the coefficient of variation (=Standard Deviation/Average). The descriptive statistics are calculated by the author.
The yearly average pork export increased from 2,209 million pounds in the pre-cartel period to 5,186 million pounds in the cartel period (or by 135 %). A substantial increase in the export of pork decreased pork quantities available for domestic consumption in the cartel period. The yearly average quantity of pork available for domestic consumption increased from 18,933 million pounds in the pre-cartel period to 19,781 million pounds in the cartel period (or by 4 %). The yearly average quantity of pork available per capita decreased from 65 pounds in the pre-cartel period to 62 pounds in the cartel period (or by 5 %). This is because the pork export increased, and there was an increase in the U.S. population in this period.
4.2 Farm, Wholesale, and Retail Values of Pork, Farm Sector Share, and Marketing Margins
Table 3 summarizes descriptive statistics for the farm, wholesale, and retail values of pork, marketing margins, and farm sector share for the pre-cartel period (1998–2008) and the cartel period (2009–2019). The farm, wholesale, and retail values of pork are proxies for prices at the farm, wholesale, and retail levels of the pork supply chain.[6] Figure 1 depicts monthly farm, wholesale, and retail values of pork. Figure 2 depicts monthly farm sector share, farm-to-wholesale margin, and wholesale-to-retail margin, all expressed as a percentage of the retail value of pork.[7]
U.S. pork farm, wholesale and retail values, farm sector share, farm-to-wholesale and wholesale-to-retail margins (1998–2019).
| Variable/formula | Unit of measurement | Pre-cartel period (1998–2008) | Cartel period (2009–2019) | Change in cartel period, relative to pre-cartel period | |||
|---|---|---|---|---|---|---|---|
| Average | CV | Average | CV | Average (%) | CV (%) | ||
| Farm value (FP) | Cents per pound | 76.50 | 0.19 | 94.99 | 0.22 | 18.5 (24.2) | 0.03 (15.1) |
| Wholesale value (WP) | Cents per pound | 114.21 | 0.12 | 149.12 | 0.14 | 34.9 (30.6) | 0.02 (20.8) |
| Retail value (RP) | Cents per pound | 269.68 | 0.06 | 359.70 | 0.09 | 90.0 (33.4) | 0.03 (46.2) |
| Farm-to-wholesale margin: WP-FP | Cents per pound | 37.71 | 0.11 | 54.13 | 0.22 | 16.4 (43.5) | 0.11 (99.8) |
| Farm-to-wholesale margin: [(WP-FP)/WP]*100 % | % of wholesale value | 33.59 | 0.19 | 36.64 | 0.22 | 3.1 (9.1) | 0.03 (16.2) |
| Farm-to-wholesale margin: [(WP-FP)/RP]*100 % | % of retail value | 14.02 | 0.12 | 14.98 | 0.18 | 1.0 (6.8) | 0.06 (47.2) |
| Wholesale-to-retail margin: RP-WP | Cents per pound | 155.47 | 0.07 | 210.58 | 0.13 | 55.1 (35.4) | 0.06 (78.1) |
| Wholesale-to-retail margin: [(RP-WP)/RP]*100 % | % of retail value | 57.72 | 0.06 | 58.51 | 0.08 | 0.8 (1.4) | 0.02 (33.8) |
| Farm sector share: [FP/RP]*100 % | % of retail value | 28.26 | 0.16 | 26.51 | 0.21 | −1.8 (−6.2) | 0.05 (29.9) |
-
Data source for farm, wholesale, and retail values of pork is USDA ERS (2022b). The farm, wholesale, and retail values of pork are not adjusted for inflation. CV is the coefficient of variation (=Standard Deviation/Average). The marketing margins, farm sector shares, and descriptive statistics are calculated by the author.
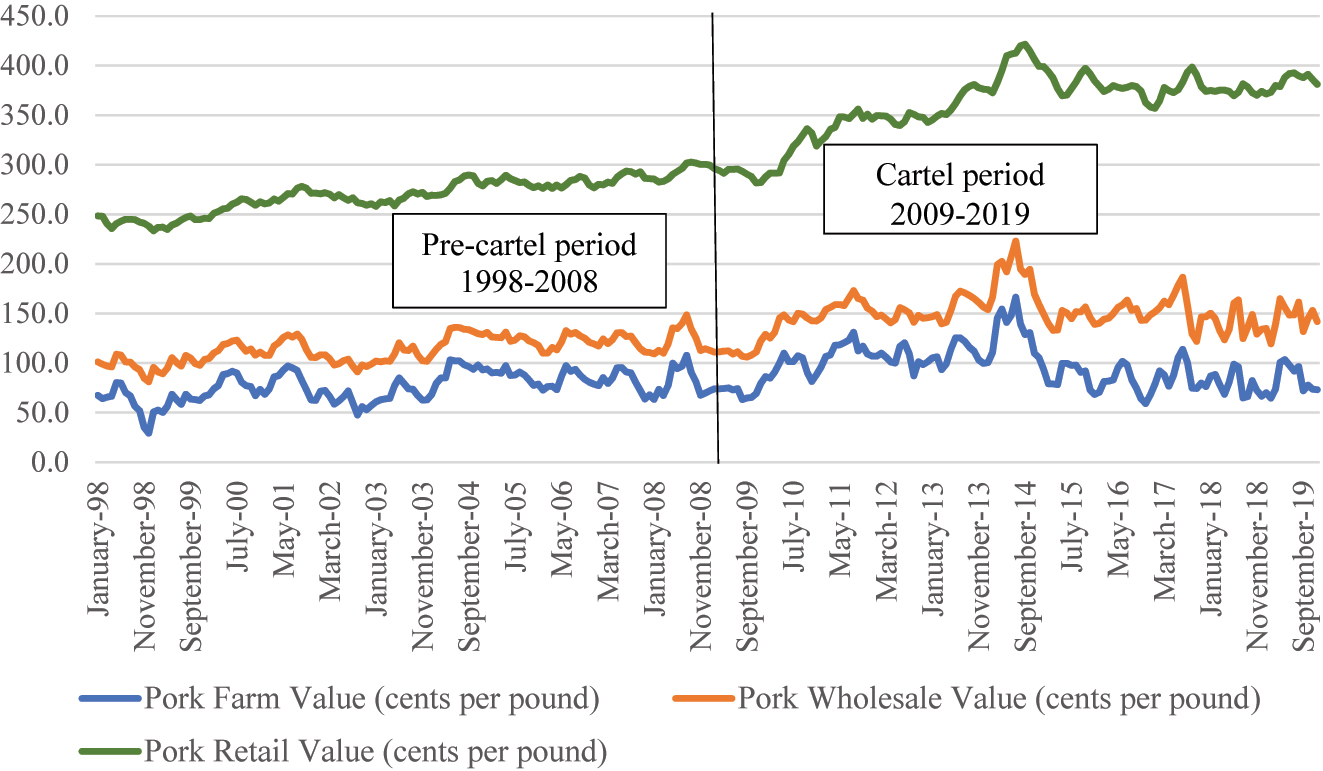
U.S. pork industry: monthly farm, wholesale, and retail pork values (1998–2019). Data source is USDA ERS (2022b) .
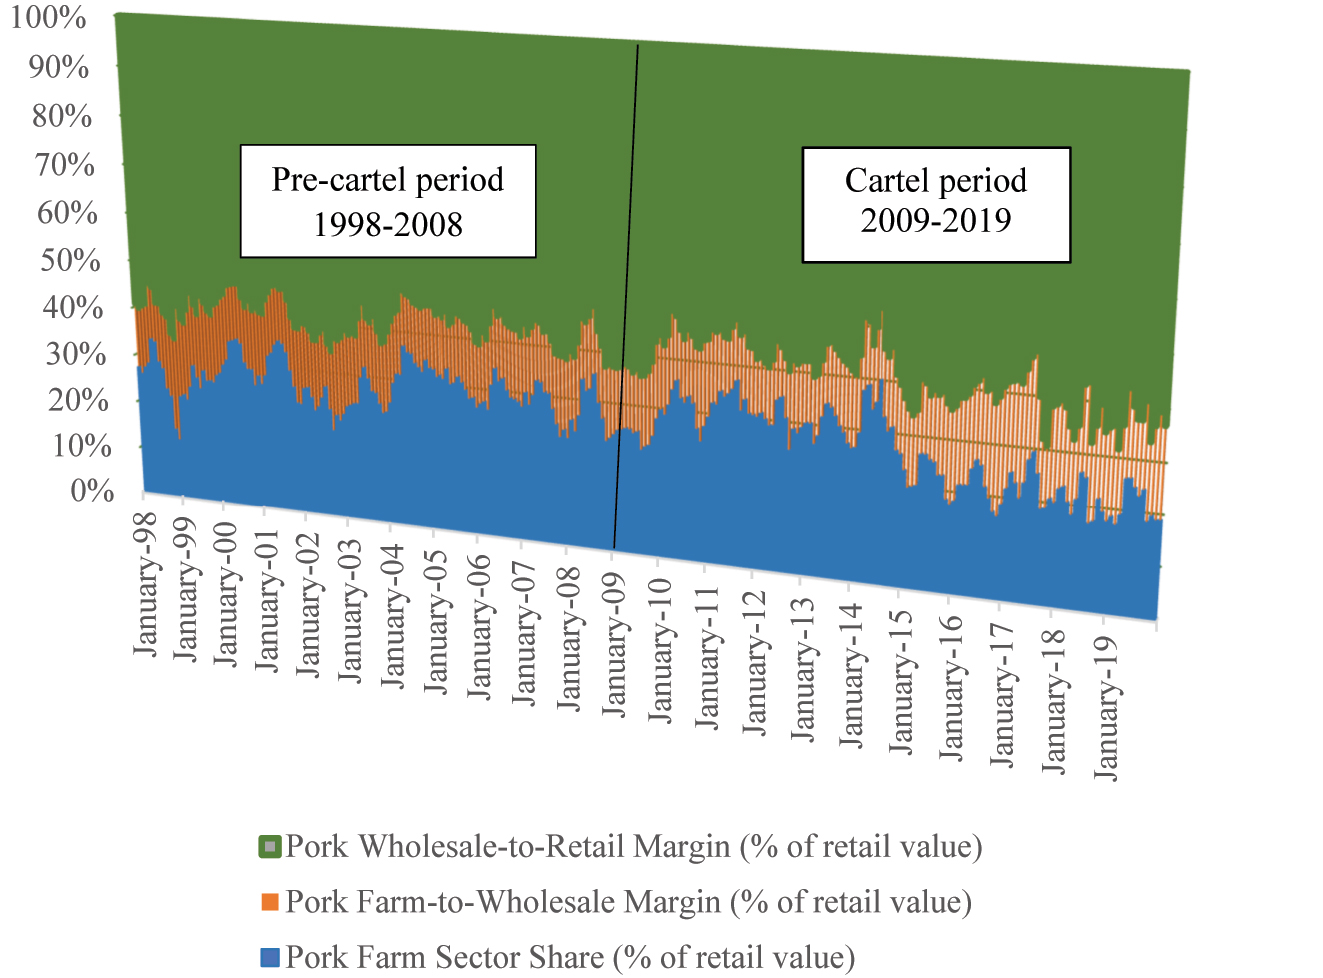
U.S. pork industry: the monthly farm sector share, farm-to-wholesale margin, and wholesale-to-retail margin expressed as a percentage of the retail pork value (1998–2019). The measures depicted in the figure are calculated by the author using farm, wholesale and retail values of pork reported in USDA ERS (2022b) .
The following changes take place between the pre-cartel and cartel periods. The monthly average farm value of pork increases from $0.77 per pound to $0.95 per pound (or by 24.2 %). The monthly average wholesale value of pork increases from $1.14 per pound to $1.49 per pound (or by 30.6 %). The monthly average retail value of pork increases from $2.70 per pound to $3.60 per pound (or by 33.4 %).
The monthly average farm-to-wholesale margin increases from $0.38 per pound to $0.54 per pound (or by 43.5 %). The farm-to-wholesale margin includes pork processing costs and profit of pork processors. The monthly average wholesale-to-retail margin increases from $1.55 per pound to $2.11 per pound (or by 35.4 %). The wholesale-to-retail margin includes pork retailing costs and profit of food retailers attributed to pork sales.
Expressed as a percentage of the wholesale value of pork, the monthly average farm-to-wholesale margin increases from 33.59 to 36.64 % (or by 9.1 %). The observed increase in the farm-to-wholesale margin may be due to increased pork processing costs and/or increased profit of pork processors due to a short-term exercise of their seller market power caused by the implementation of production cuts.
Expressed as a percentage of the retail value of pork, the monthly average farm-to-wholesale margin increases from 14.02 to 14.98 % (or by 6.8 %), the monthly average wholesale-to-retail margin increases from 57.72 to 58.51 % (or by 1.4 %), and the monthly average farm sector share decreases from 28.26 to 26.51 % (or by 6.2 %).
5 Theoretical Framework: The Relationship Between Wholesale and Farm Prices and Cost Pass-Through in the Pork Industry
Figure 3 is a graphical representation of the theoretical framework that explains increases in the output (pork) price that are due to increases in the input (hog) price.[8] Within this framework, the pork price increase is due to the hog price increase. The latter increase is due to higher feed (corn and soybean meal) costs. Figure 3 provides insights on the relationship between the wholesale pork price and hog price and the nature of wholesale pork pricing (perfectly competitive or oligopoly/monopoly pricing) evaluated using an econometric analysis presented in the next sections. Figure 3 depicts an inverse demand curve for pork at the wholesale level (labeled as “P”) reflecting a linear price-dependent demand function and a Marginal Cost curve (labeled as “MC”) reflecting a constant Marginal Cost function. Marginal Cost of producing pork largely depends on hog costs (and feed costs). The profit-maximizing pork price-quantity combinations for two market structures are depicted in the figure: a perfectly competitive industry equilibrium labeled as “C” (Qc and Pc: original scenario) and a monopoly equilibrium labeled as “M” (Qm and Pm: original scenario).
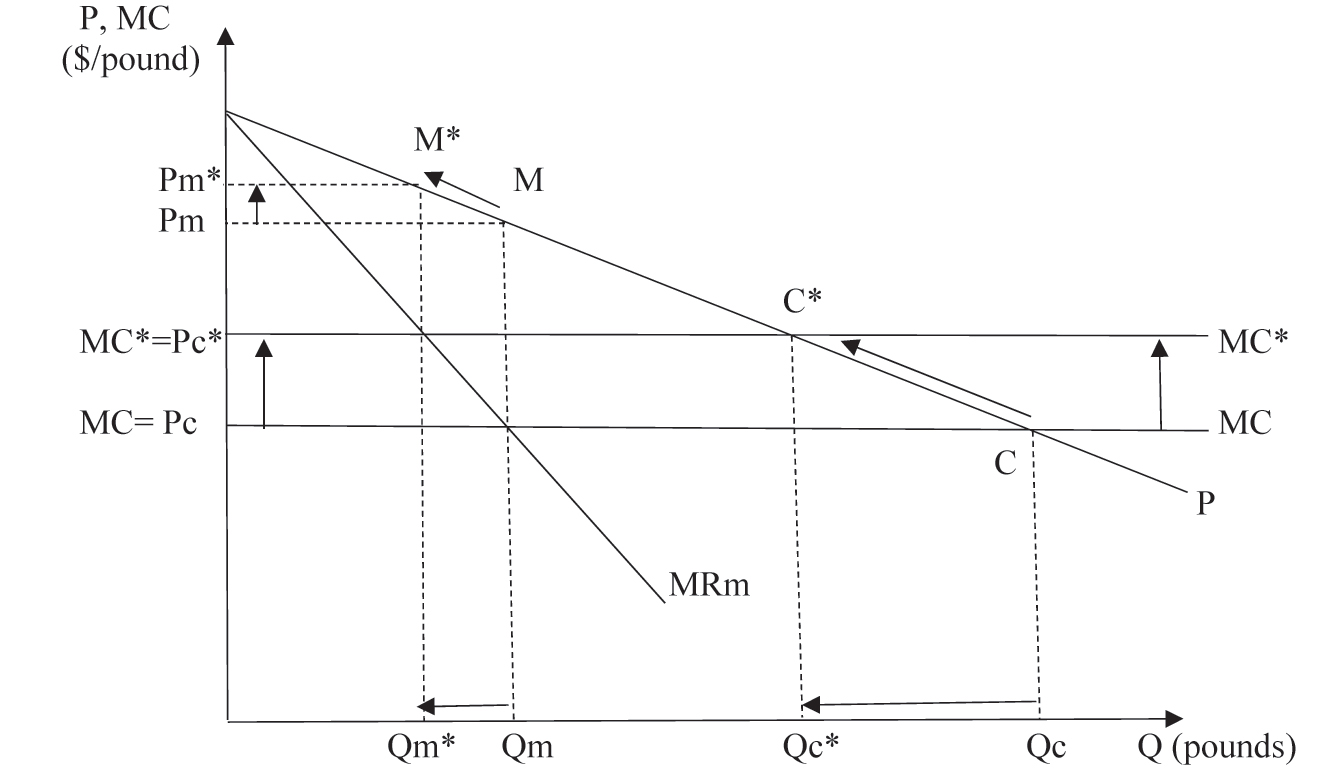
A perfectly competitive industry and monopoly: the output price increase due to a marginal cost increase.
The hog price increase, which is due to an increase in feed costs, is equivalent to an upward shift of the original MC curve (the original scenario with no hog cost increase) to the new MC curve labeled as “MC*” in Figure 3 (the new scenario: with increased hog costs). Assuming the pork industry behaves as a perfectly competitive industry, it moves to the new market equilibrium labeled as “C*” (Qc* and Pc*). Assuming the pork industry behaves as a monopoly, it moves to the new market equilibrium labeled as “M*” (Qm* and Pm*). In the case of both market structures, the pork industry decreases pork quantity and increases wholesale pork price to pass the hog price increase on to the buyers of pork at the wholesale level.
The difference between the two market structures is cost pass-through (CPT), which is the extent to which the industry passes the input price (cost) increase on the buyers of its output in the form of higher output prices. The CPT is a $ per unit increase (decrease) in the output price, which follows a $1 per unit increase (decrease) in the input price (or marginal cost). The CPT for a profit-maximizing perfectly competitive industry is equal to 1 (a complete CPT):
Generally, in the case of imperfectly competitive market structures, CPT magnitude is affected by the type of market structure (monopoly or oligopoly), a demand curvature assumption (linear, convex, or concave), and a Marginal Cost assumption (constant or upward sloping Marginal Cost curve) (Cotterill 1998; Cotterill, Egan, and Buckhold 2001; Harris and Sullivan 1979; Kosicki and Cahill 2006; Oxera Agenda 2007; RBB Economics 2014). In addition to CPT cases explained above, the following CPT magnitudes are discussed in academic literature. CPT for monopoly operating in market with concave demand (and constant marginal cost) is smaller than 0.5 (an incomplete CPT) (Oxera Agenda 2007; RBB Economics 2014). CPT for monopoly and oligopoly operating in market with convex demand is greater than 1 (more than complete CPT) (Cotterill 1998; Cotterill, Egan, and Buckhold 2001; Kosicki and Cahill 2006). An upward sloping Marginal Cost would decrease CPT magnitude, as compared to a constant Marginal Cost (RBB Economics 2014). In the case of a perfectly competitive market structure, CPT magnitude is typically affected by demand and supply elasticities (Harris and Sullivan 1979; RBB Economics 2014).
The same theoretical framework is applied to analyze the relationship between retail pork price and wholesale pork price and cost pass-through and the nature of pork pricing at the retail level of the pork supply chain. In this case, in Figure 3, P is retail pork price and MC is Marginal Cost of food retailers selling pork products. The Marginal Cost of food retailers largely depends on the wholesale pork price they pay. Food retailers are assumed to behave either as a perfectly competitive industry or a monopoly.
Table 4 summarizes CPT thresholds and corresponding market structure and pricing behavior assumptions relevant to the econometric analysis presented in the next sections. The CPT thresholds summarized in Table 4 are the hypotheses tested using the estimated econometric models in this research.
Cost pass-through (CPT) and assumptions on market structure and pricing behavior.
| Cost pass-through | Market structure and pricing behavior assumption |
|---|---|
| CPT > 1 (more than complete CPT) | Monopoly/oligopoly pricing in a market with non-linear (convex) demand |
| CPT = 1 (complete CPT) | Perfectly competitive pricing |
| 0.5 < CPT < 1 (incomplete CPT) | Oligopoly pricing in a market with linear demand and constant marginal cost |
| CPT = 0.5 (incomplete CPT) | Monopoly pricing in a market with linear demand and constant marginal cost |
6 Econometric Models
6.1 A Simple Theoretical Framework of Price Transmission Process
A simple theoretical framework of price transmission process is a foundation for econometric models of wholesale and retail pork price behavior. Equation [1] represents a linear price transmission process. The output price P output (downstream price) is specified as a linear function of the input price P input (upstream price).
Two price transmission processes are analyzed in this research: farm-to-wholesale price transmission process represented by equation [1.1] and wholesale-to-retail price transmission process represented by equation [1.2].
In equation [1], a is a non-negative constant, which is also referred to as a fixed absolute markup (FAM), and b is a vertical price transmission coefficient, which is also referred to as a cost pass-through (CPT). CPT in equation [1.1] is farm-to-wholesale price transmission coefficient (b 1). CPT in equation [1.2] is wholesale-to-retail price transmission coefficient (b 2).
Equation [1] suggests that the output price has two components: a component that does not depend on the input price (a fixed absolute markup) and a component that depends on the input price (cost pass-through). The magnitude of both components may be used to infer the type of output pricing method used by sellers of the output (Carman and Sexton 2005; George and King 1971). The output price stabilization method would be consistent with a > 0 and b < 1; given the incomplete CPT, the output price is weakly dependent on the cost (input price) changes.[9] The percentage markup pricing method would be consistent with a > 0 and b > 1; given more than a complete CPT, the output price is strongly dependent on the cost (input price) changes, because the percentage markup is added to the cost (input price).[10] b < 1 would reflect oligopoly and monopoly pricing in the market with linear or concave demand, and b > 1 would reflect oligopoly and monopoly pricing in the market with convex demand, as discussed earlier. The absolute markup pricing method reflecting a perfectly competitive pricing would be consistent with a > 0 and b = 1; given the complete CPT, the output price completely reflects the cost (input price) changes.
6.2 Econometric Models
The econometric analysis objective is to evaluate the nature of wholesale and retail pork pricing in the pre-cartel period (1998–2008) and the cartel period (2009–2019) and to identify changes in pork pricing between the two periods. The focus is on evaluating the magnitude and statistical significance of the fixed absolute markups (FAMs) and cost pass-throughs (CPTs) in the two analyzed periods, as well as changes in FAMs and CPTs between these two periods.
Equation [2] is the econometric model of wholesale pork price behavior. Equation [3] is the econometric model of retail pork price behavior. The econometric models are specified as linear regression models.[11] Each econometric model is estimated using 264 observations. The econometric models are estimated using the Ordinary Least Squares (OLS) estimation procedure.
In Equation [2], WPP t and FPP t are wholesale value of pork (the output price proxy for pork processors) and farm value of pork (the input price proxy for pork processors), respectively, in month t. Both values are measured in cents per pound. C t is a binary variable (intercept shifter); it is equal to one, if a wholesale value observation belongs to the cartel period (2009–2019), and it is equal to zero, if a wholesale value observation belongs to the pre-cartel period (1998–2008). The reference group is represented by wholesale value observations belonging to the pre-cartel period. FPP t C t is the interaction effect of the farm value and cartel binary variable (slope shifter). M t is a set of monthly binary variables. ε t1 is the error term. α 1 is FAM and β 1 is CPT in the pre-cartel period. α 1 + µ 1 is FAM and β 1 + γ 1 is CPT in the cartel period. µ 1 and γ 1 are the changes in FAM and CPT, respectively, in the cartel period, relative to the pre-cartel period.
In Equation [3], RPP t and WPP t are retail value of pork (the output price proxy for pork retailers) and wholesale value of pork (the input price proxy for pork retailers), respectively, in month t. Both values are measured in cents per pound. C t is a binary variable (intercept shifter); it is equal to one, if a retail value observation belongs to the cartel period (2009–2019), and it is equal to zero, if a retail value observation belongs to the pre-cartel period (1998–2008). The reference group is represented by retail value observations belonging to the pre-cartel period. WPP t C t , is the interaction effect of the wholesale value and cartel binary variable (slope shifter). M t is a set of monthly binary variables. ε t2 is the error term. α 2 is FAM and β 2 is CPT in the pre-cartel period. α 2 + µ 2 is FAM and β 2 + γ 2 is CPT in the cartel period. µ 2 and γ 2 are the changes in FAM and CPT, respectively, in the cartel period, relative to the pre-cartel period.
7 Estimation Results
The OLS estimation results for two econometric models are summarized in Table 5 (wholesale pork price behavior) and Table 6 (retail pork price behavior).[12] The variation in independent variables explains almost 90 % of the variation in the dependent variables (wholesale pork value and retail pork value). The estimated coefficients have expected signs and magnitude, and many of them are statistically significant from zero.
U.S. pork industry: Wholesale pork price behavior (1998–2019): the OLS estimation results.
| Variable | Coefficient | Estimated coefficient | T-ratio |
|---|---|---|---|
| FPP t | β 1 | 0.91b | 24.51 |
| C t | µ 1 | 23.79b | 3.35 |
| FPP t C t | γ 1 | −0.06 | −0.83 |
| February | −2.63c | −1.58 | |
| March | −1.57 | −0.64 | |
| April | −1.25 | −0.47 | |
| May | −3.00 | −1.13 | |
| June | −2.15 | −0.80 | |
| July | −1.07 | −0.38 | |
| August | 0.01 | 0.004 | |
| September | 2.69 | 1.15 | |
| October | 2.73 | 1.14 | |
| November | 4.47b | 1.76 | |
| December | 3.44b | 1.84 | |
| Constant | α 1 | 44.51b | 15.68 |
| R2 | 0.89 | ||
| D-W statistica | 0.28 | ||
| F-test (seasonality) p-value | 0.1604 | ||
| Pre-cartel period (1998–2008) | |||
| Fixed absolute markup | α 1 | 44.51b | 15.68 |
| Cost pass-through | β 1 | 0.91b | 24.51 |
| Change between the pre-cartel and cartel periods | |||
| Fixed absolute markup | µ 1 | 23.79b | 3.35 |
| Cost pass-through | γ 1 | −0.06 | −0.83 |
| Cartel period (2009–2019) | |||
| Fixed absolute markup | α 1 + µ 1 | 68.31b | 9.93 |
| Cost pass-through | β 1 + γ 1 | 0.85b | 12.57 |
-
a T-ratios are calculated using autocorrelation-adjusted standard errors based on Newey-West approach. bThe estimated coefficient (EC) is statistically significant from zero at the 10 % significant level using a two-tailed T-test. Ho: EC = 0, and Ha: EC ≠ 0; the T statistic rejection regions are (−∞; −1.64] and [1.64; +∞). cThe estimated coefficient (EC) is statistically significant from zero at the 10 % significance level using a one-tailed T test. Ho: EC = 0, and Ha: EC < 0; the T statistic rejection region is (−∞; −1.28]. The number of observations is 264.
U.S. pork industry: Retail pork price behavior (1998–2019): the OLS estimation results.
| Variable | Coefficient | Estimated coefficient | T-ratio |
|---|---|---|---|
| WPP t | β 2 | 1.10b | 11.90 |
| C t | µ 2 | 60.67b | 2.50 |
| WPP t C t | γ 2 | −0.06 | −0.38 |
| February | 0.47 | 0.10 | |
| March | −0.34 | −0.05 | |
| April | −3.22 | −0.50 | |
| May | −6.66 | −1.11 | |
| June | −8.47c | −1.49 | |
| July | −6.81 | −1.20 | |
| August | −0.11 | −0.02 | |
| September | 6.58 | 1.03 | |
| October | 6.06 | 0.98 | |
| November | 6.53 | 1.13 | |
| December | 4.59 | 0.94 | |
| Constant | α 2 | 143.95b | 13.51 |
| R2 | 0.86 | ||
| D-W statistica | 0.26 | ||
| F-test (seasonality) p-value | 0.3222 | ||
| Pre-cartel period (1998–2008) | |||
| Fixed absolute markup | α 2 | 143.95b | 13.51 |
| Cost pass-through | β 2 | 1.10b | 11.90 |
| Change between the pre-cartel and cartel periods | |||
| Fixed absolute markup | µ 2 | 60.67b | 2.50 |
| Cost pass-through | γ 2 | −0.06 | −0.38 |
| Cartel period (2009–2019) | |||
| Fixed absolute markup | α 2 + µ 2 | 204.62b | 9.20 |
| Cost pass-through | β 2 + γ 2 | 1.04b | 7.54 |
-
a T-ratios are calculated using autocorrelation-adjusted standard errors based on Newey-West approach. bThe estimated coefficient (EC) is statistically significant from zero at the 10 % significant level using a two-tailed T-test. Ho: EC = 0, and Ha: EC ≠ 0; the T statistic rejection regions are (−∞; −1.64] and [1.64; +∞). cThe estimated coefficient (EC) is statistically significant from zero at the 10 % significance level using a one-tailed T test. Ho: EC = 0, and Ha: EC < 0; the T statistic rejection region is (−∞; −1.28]. The number of observations is 264.
Table 7 summarizes the estimation results characterizing the magnitude and statistical significance of fixed absolute markups and cost pass-throughs in light of the hypotheses discussed earlier and summarized in Table 4, as well as conclusions on output (pork) pricing methods used by pork processors (wholesalers) and food (pork) retailers in the pre-cartel and cartel periods.
U.S. pork industry: wholesale and retail pork pricing (1998–2019).
| Wholesale pork pricing | Retail pork pricing | |
|---|---|---|
| Pre-cartel period (1998–2008) | ||
|
|
||
| Fixed absolute markup | 44.51 | 143.95 |
| Cost pass through (CPT) |
0.91
Ho: CPT = 1 is rejected in favor of Ha: CPT < 1 (T-ratio = −2.45)a Ho: CPT = 0.50 is rejected in favor of Ha: CPT > 0.50 (T-ratio = 11.03) |
1.10
Ho: CPT = 1 fails to be rejected (T-ratio = 1.10) |
| Economic model | Oligopoly pricing [linear demand, constant marginal cost] | Perfectly competitive pricing |
| Pricing method | Wholesale price stabilization | Fixed absolute markup |
|
|
||
| Cartel period (2009–2019) | ||
|
|
||
| Fixed absolute markup | 68.31 | 204.62 |
| Cost pass through (CPT) |
0.85
Ho: CPT = 1 is rejected in favor of Ha: CPT < 1 (T-ratio = −2.23) Ho: CPT = 0.50 is rejected in favor of Ha: CPT > 0.50 (T-ratio = 5.17) |
1.04
Ho: CPT = 1 fails to be rejected (T-ratio = 0.30) |
| Economic model | Oligopoly pricing [linear demand, constant marginal cost] | Perfectly competitive pricing |
| Pricing method | Wholesale price stabilization | Fixed absolute markup |
-
a T-ratios are calculated using autocorrelation-adjusted standard errors based on Newey-West approach. The hypotheses on the cost pass-through magnitude are explained in Table 4. T-statistic cut-off value used to conduct T-tests presented in this table is |1.64| (one-tailed T-test and 5 % significance level). The fixed absolute markups and cost pass-throughs are from Tables 5 and 6.
7.1 Cost Pass-Through and Pork Pricing at the Wholesale Level
7.1.1 Pre-Cartel Period (1998–2008)
The fixed absolute markup (FAM) is $0.45 per pound, and it is statistically greater than zero. The cost pass-through (CPT) is 0.91, meaning that an increase (decrease) in farm value of pork by $1.00 per pound causes wholesale value of pork to increase (decrease) by $0.91 per pound. The CPT magnitude is close to being complete (close to one), which may be consistent with a perfectly competitive pricing. However, the null hypothesis of a perfectly competitive pricing CPT = 1 is rejected in favor of the alternative hypothesis CPT < 1, which is consistent with an imperfectly competitive pricing (oligopoly or monopoly in a market with linear demand and constant marginal cost). The null hypothesis of monopoly pricing CPT = 0.50 is rejected in favor of the alternative hypothesis CPT > 0.50. Therefore, wholesale pork pricing by pork processors in the pre-cartel period is consistent with oligopoly pricing in a market with linear demand and constant marginal cost. The incomplete CPT reflects a wholesale price stabilization method used by pork processors (wholesalers).
7.1.2 Cartel Period (2009–2019)
In the cartel period, as compared to the pre-cartel period, FAM increases and CPT decreases. The estimated FAM increase is statistically significant from zero, and the estimated CPT decrease is not statistically significant from zero. In the cartel period, FAM is $0.68 per pound, and it is statistically greater than zero. The CPT is 0.85, meaning that an increase (decrease) in farm value of pork by $1.00 per pound causes wholesale value of pork to increase (decrease) by $0.85 per pound.
The cartel period CPT (0.85) is incomplete. The null hypothesis of a perfectly competitive pricing CPT = 1 is rejected in favor of the alternative hypothesis of an imperfectly competitive pricing CPT < 1 (oligopoly or monopoly in a market with linear demand and constant marginal cost). The null hypothesis of monopoly pricing CPT = 0.50 is rejected in favor of the alternative hypothesis CPT > 0.50. Therefore, wholesale pork pricing by pork processors in the cartel period is consistent with oligopoly pricing in a market with linear demand and constant marginal cost. The incomplete CPT reflects a wholesale price stabilization method used by pork processors (wholesalers).
7.2 Cost Pass-Through and Pork Pricing at the Retail Level
7.2.1 Pre-Cartel Period (1998–2008)
The FAM is $1.44 per pound, and it is statistically greater than zero. The CPT is 1.10, meaning that an increase (decrease) in wholesale value of pork by $1.00 per pound causes retail value of pork to increase (decrease) by $1.10 per pound. The pre-cartel period CPT (1.10) is close to being complete. The null hypothesis of a perfectly competitive pricing CPT = 1 fails to be rejected. The retail pork pricing by food retailers in the pre-cartel period is consistent with a perfectly competitive pricing. The complete CPT reflects a fixed absolute markup pricing method used by food retailers.
7.2.2 Cartel Period (2009–2019)
In the cartel period, as compared to the pre-cartel period, FAM increases and CPT decreases. The estimated FAM increase is statistically significant from zero, and the estimated CPT decrease is not statistically significant from zero. In the cartel period, FAM is $2.05 per pound, and it is statistically greater than zero. The CPT is 1.04, meaning that an increase (decrease) in wholesale value of pork by $1.00 per pound causes retail value of pork to increase (decrease) by $1.04 per pound. The cartel period CPT (1.04) is complete. The null hypothesis of a perfectly competitive pricing CPT = 1 fails to be rejected. The retail pork pricing by food retailers in the cartel period is consistent with perfectly competitive pricing. The complete CPT reflects a fixed absolute markup pricing method used by food retailers.
8 Conclusion
This research conducts an empirical analysis of wholesale and retail pricing in the U.S. pork industry during the period of alleged output price-fixing cartel of the largest pork processors (2009–2019) and a prior, more competitive period (1998–2008). The empirical evidence may reflect the following patterns of wholesale and retail pork pricing in the two analyzed periods.
The wholesale pork pricing by pork processors is consistent with oligopoly pricing in both the pre-cartel and cartel periods. While the estimated decrease in cost pass-through in the cartel period, relative to the pre-cartel period, may reflect an increase in the seller (oligopoly) market power of pork processors due to the implementation of production cuts, this cost pass-through decrease is not statistically significant from zero.
As indicated by incomplete cost pass-through, pork processors used a wholesale price stabilization method in both periods. The dependence of the wholesale pork value on changes in the farm pork (hog) value decreased, and its dependance on the fixed absolute markup increased in the cartel period. The wholesale pork price stabilization method may have contributed to the increases in the wholesale value of pork and farm-to-wholesale margin in the cartel period, as compared to the pre-cartel period.
Expressed as a percentage of the wholesale value of pork, the monthly average farm-to-wholesale margin increased from 33.59 % in the pre-cartel period to 36.64 % in the cartel period (or by 9.1 %). The observed increase in the farm-to-wholesale margin in the cartel period may be due to increased pork processing costs and/or increased profit of pork processors due to a short-term exercise of their seller (oligopoly) market power caused by the implementation of production cuts.
The retail pork pricing by food retailers is consistent with perfectly competitive pricing in both the pre-cartel and cartel periods. Food retailers used a fixed absolute markup pricing method in both periods.
Appendix
1. Cost pass-through in a perfectly competitive industry
The profit-maximization problem for a perfectly competitive industry is to maximize Total Profit (TP) with respect to the output quantity (Q).
where TR, TC, and P are Total Revenue, Total Costs, and the output price, respectively.
The output price is an exogenous variable (constant).
The profit-maximizing First-Order Condition is:
where P is the output price and at the same time Marginal Revenue, and MC is Marginal Cost.
The cost pass-through for a perfectly competitive industry is:
Interpretation: A $1 per unit increase (decrease) in the marginal cost (input price) causes the output price to increase (decrease) by $1 per unit.
2. Cost pass-through for monopoly operating in the market with linear demand and constant marginal cost
The profit-maximization problem for monopoly is to maximize Total Profit (TP) with respect to the output quantity (Q).
where TR, TC, and P are Total Revenue, Total Costs and the output price, respectively.
The output price is a function of output quantity due to the inverse (price-dependent) demand function: P = a − bQ.
The profit-maximizing First-Order Condition is:
where [a − 2bQ] is Marginal Revenue, and MC is Marginal Cost.
Next, substitute the output quantity maximizing profit in the inverse demand equation to determine the output price maximizing profit.
The cost pass-through for monopoly in the market with linear demand and constant marginal cost is:
Interpretation: A $1 per unit increase (decrease) in the marginal cost (input price) causes the output price to increase (decrease) by $0.50 per unit.
References
Becker, G. S. 2008. Livestock Feed Costs: Concerns and Options. Washington, D.C: Congressional Research Service, Report for Congress RS22908.Search in Google Scholar
Besanko, D., and R. Braeutigam. 2002. Microeconomics: An Integrated Approach. New York: John Wiley & Sons.Search in Google Scholar
Bolotova, Y. 2009. “Cartel Overcharges: An Empirical Analysis.” Journal of Economic Behavior and Organization 70: 321–41. https://doi.org/10.1016/j.jebo.2009.02.002.Search in Google Scholar
Bolotova, Y. 2022a. “Teaching Forward Contracts in Undergraduate Courses in Agribusiness and Agricultural Economics Programs.” Applied Economics Teaching Resources 4 (4): 22–33.Search in Google Scholar
Bolotova, Y. 2022b. “Price-Fixing in the U.S. Broiler Chicken and Pork Industries.” Applied Economics Teaching Resources 4 (4): 55–91.Search in Google Scholar
Carlton, D. W., and J. M. Perloff. 2004. Modern Industrial Organization. Boston, MA: Pearson.Search in Google Scholar
Carman, H. F., and R. J. Sexton. 2005. “Supermarket Fluid Milk Pricing Practices in the Western United States.” Agribusiness 21: 509–30. https://doi.org/10.1002/agr.20062.Search in Google Scholar
Congressional Research Service. 2009. Livestock Marketing and Competition Issues. Report RL33325. Washington, D.C.Search in Google Scholar
Connor, J. M., and Y. Bolotova. 2006. “Cartel Overcharges: Survey and Meta-Analysis.” International Journal of Industrial Organization 24: 1109–37. https://doi.org/10.1016/j.ijindorg.2006.04.003.Search in Google Scholar
Cotterill, R. W. 1998. Estimation of Cost Pass Through to Michigan Consumers in the ADM Price Fixing Case. Research Report No. 39. Storrs: University of Connecticut, Food Marketing Policy Center.Search in Google Scholar
Cotterill, R., L. Egan, and W. Buckhold. 2001. “Beyond Illinois Brick: The Law and Economics of Cost Pass-Through in the ADM Price Fixing Case.” Review of Industrial Organization 18: 45–52. https://doi.org/10.1023/a:1026570012375.10.1023/A:1026570012375Search in Google Scholar
Davis, C. G., C. Dimitri, R. Nehring, L. A. Collins, M. Haley, K. Ha, and J. Gillespie. 2022. U.S. Hog Production: Rising Output and Changing Trends in Productivity Growth. Washington, D.C: U.S. Department of Agriculture, Economic Research Service, Economic Research Report Number 308.Search in Google Scholar
Federal Trade Commission. 2024. Price Fixing. Washington, DC. https://www.ftc.gov/tips-advice/competition-guidance/guide-antitrust-laws/dealings-competitors/price-fixing (accessed March 24, 2024).Search in Google Scholar
George, P. S., and G. A. King. 1971. Consumer Demand for Food Commodities in the United States, with Projections for 1980. Giannini Foundation Monograph No. 26. Davis: University of California, Davis, Department of Agricultural and Resource Economics.Search in Google Scholar
Giamalva, J. 2014. Pork and Swine: Industry & Trade Summary. Washington, D.C: U.S. International Trade Commission, Office of Industries Publication ITS-11.Search in Google Scholar
Greene, J. L. 2019. Livestock Mandatory Reporting Act: Overview for Reauthorization in the 116th Congress. Washington, D.C: Congressional Research Service, Report R45777.Search in Google Scholar
Hahn, W. 1991. Meat Price Spreads are Not Proof of Price Gouging. Washington, D.C: Food Review: Livestock Production and Marketing.Search in Google Scholar
Hahn, W. F. 2002. Price Spreads & Marketing System Performance. Washington, D.C: U.S. Department of Agriculture, Economic Research Service: Agricultural Outlook.Search in Google Scholar
Hahn, W. 2004. Beef and Pork Values and Price Spreads Explained. Washington, D.C: U.S. Department of Agriculture, Economic Research Service, LDP-M-118-01.Search in Google Scholar
Harris, R. G., and L. A. Sullivan. 1979. “Passing on the Monopoly Overcharge: A Comprehensive Policy Analysis.” University of Pennsylvania Law Review 128: 269–360. https://doi.org/10.2307/3311655.Search in Google Scholar
Hofstrand. 2009. Impact of Rising Feed Prices on Pork Profitability. Ames, IA: Agricultural Marketing Resource Center, AgMRC Renewable Energy Newsletter, Iowa State University.Search in Google Scholar
Hovenkamp, H. 2005. Federal Antitrust Policy the Law of Competition and Its Practice, 3rd ed. St. Paul, MN: Thomson West.Search in Google Scholar
Hurt, C. 2008. Pork Industry Faces Twin Horrors. University of Illinois Extension, Weekly Outlook. A joint publication of the Department of Agricultural Economics, Purdue University, West Lafayette, IN, and Department of Agricultural and Consumer Economics, University of Illinois, Urbana-Champaign, IL, USA. https://farmdoc.illinois.edu/assets/marketing/weekly/2008/030308.pdf (accessed March 24, 2024).Search in Google Scholar
Kosicki, G., and M. B. Cahill. 2006. “Economics of Cost Pass Through and Damages in Indirect Purchaser Antitrust Cases.” The Antitrust Bulletin 51: 599–630.Search in Google Scholar
Lawrence, J. D., M. Hayenga, J. Kliebenstein, and V. J. Rhodes. 2019. Producing and Marketing Hogs Under Contract. Ames, IA: Extension Foundation, Iowa State University. https://swine.extension.org/producing-and-marketing-hogs-under-contract/ (accessed March 24, 2024).Search in Google Scholar
Lawrence, J. D., J. Mintert, J. D. Anderson, and D. P. Anderson. 2008. “Feed Grains and Livestock: Impacts on Meat Supplies and Prices.” In Choices, 2nd quarter. Milwaukee, WI: Agricultural and Applied Economics Association.Search in Google Scholar
MacDonald, J. M., X. Dong, and K. O. Fuglie. 2023. Concentration and Competition in U.S. Agribusiness. Washington: U.S. Department of Agriculture, Economic Research Service, Economic Information Bulletin Number 256.10.32747/2023.8054022.ersSearch in Google Scholar
McBride, W. D., and N. Key. 2013. U.S. Hog Production from 1992 to 2009: Technology, Restructuring, and Productivity Growth. Washington: U.S. Department of Agriculture, Economic Research Service, Economic Research Report Number 158.Search in Google Scholar
Meyer, S. 2020. Pork Packing: Just What is Capacity? National Hog Farmer. https://www.nationalhogfarmer.com/business/pork-packing-just-what-capacity (accessed March 24, 2024).Search in Google Scholar
Meyer, S. R., and B. Goodwin. 2021. Structure and Importance of the U.S. Pork Industry. Raleigh, NC: Partners for Production Agriculture and North Carolina State University.Search in Google Scholar
National Hog Farmer. 2018. Pork Companies Face Price Fixing Lawsuit. https://www.nationalhogfarmer.com/business/pork-companies-face-price-fixing-lawsuit (accessed March 24, 2024).Search in Google Scholar
Nieberding, J. F. 2006. “Estimating Overcharges in Antitrust Cases Using a Reduced-Form Approach: Methods and Issues.” Journal of Applied Economics 9 (2): 361–80. https://doi.org/10.1080/15140326.2006.12040652.Search in Google Scholar
Oxera Agenda. 2007. Passing the Buck: The Passing-On Defense in Cartel Damages Cases. Oxera, UK. https://www.oxera.com/wp-content/uploads/2018/03/Cartel-damages-claims-3.pdf (accessed March 24, 2024).Search in Google Scholar
Pork Checkoff. 2009–2011. The Pork Industry at a Glance: Quick Facts. Des Moines, IA, USA. https://porkgateway.org/wp-content/uploads/2015/07/quick-facts-book1.pdf (accessed March 24, 2024).Search in Google Scholar
RBB Economics. 2014. Cost Pass-Through: Theory, Measurement, and Potential Policy Implications. A Report Prepared for the Office of Fair Trading (U.K.). UK. https://assets.publishing.service.gov.uk/government/uploads/system/uploads/attachment_data/file/320912/Cost_Pass-Through_Report.pdf (accessed March 24, 2024).Search in Google Scholar
Schnepf, R. 2008. High Agricultural Commodity Prices: What are the Issues? Congressional Research Service Report RL34474. Washington, D.C.Search in Google Scholar
Stigler, G. J. 1964. “A Theory of Oligopoly.” The Journal of Political Economy 72: 44–61. https://doi.org/10.1086/258853.Search in Google Scholar
Swinton, S. M., and L. L. Martin. 1997. “A Contract on Hogs: A Decision Case.” Review of Agricultural Economics 19: 207–18. https://doi.org/10.2307/1349689.Search in Google Scholar
USA TODAY. 2018. Hormel, Tyson, Smithfield and Other Major Pork Producers Accused of Price-Fixing. USA. https://www.usatoday.com/story/money/2018/06/28/hormel-tyson-smithfield-other-pork-producers-price-fixed-lawsuit/742848002/ (accessed March 24, 2024).Search in Google Scholar
U.S. Department of Agriculture Economic Research Service (USDA ERS). 2022a. Food Availability (Per Capita) Data System. Washington, D.C. https://www.ers.usda.gov/data-products/food-availability-per-capita-data-system/food-availability-per-capita-data-system/#Food%20Availability (accessed March 24, 2024).Search in Google Scholar
U.S. Department of Agriculture Economic Research Service (USDA ERS). 2022b. Meat Price Spreads (Historical Monthly Price Spread Data for Beef, Pork, Broilers). Washington, D.C. https://www.ers.usda.gov/data-products/meat-price-spreads/ (accessed March 24, 2024).Search in Google Scholar
Court documents and relevant webpages
Pork Antitrust Litigation webpage. 2024. https://porkantitrustlitigation.com/ (accessed on March 24, 2024).Search in Google Scholar
Pork Indirect Purchaser Antitrust Litigation webpage. 2024. https://www.overchargedforpork.com/ (accessed on March 24, 2024).Search in Google Scholar
In Re Pork Antitrust Litigation. 2020. Case 0:18-cv-01776-JRT-HB. Direct Purchaser Plaintiffs’ Third Amended and Consolidated Class Action Complaint filed on 01/15/20. https://porkantitrustlitigation.com/assets/documents/2020-01-15%20-%20DPP%20Third%20Amended%20complaint.pdf (accessed on March 24, 2024).Search in Google Scholar
In Re Pork Antitrust Litigation. 2022. Civil No. 18-cv-1776 (JRT/HB). Consumer Indirect Purchaser Plaintiffs’ Fourth Amended Consolidated Class Action Complaint filed on 01/12/22. https://www.overchargedforpork.com/assets/Docs/Redacted%20Fourth%20Amended%20CIPP%20Complaint.pdf (accessed on March 24, 2024).Search in Google Scholar
© 2024 the author(s), published by De Gruyter, Berlin/Boston
This work is licensed under the Creative Commons Attribution 4.0 International License.
Articles in the same Issue
- Frontmatter
- Research Articles
- Animal Welfare Ballot Initiatives and the Vote-Buy Gap
- A Conjectural Variations Approach to Detecting Collusion: The Broiler Chicken Antitrust Litigation Case
- Collusion and Price Behavior in the U.S. Pork Industry
- Price Connectedness in the Futures Markets of Livestock Commodities
- Unintended Competition from Volume Controls: A Note on the Horne v. Department of Agriculture Decision
- A Theoretical Assessment of Informal Agricultural Cooperation Under Distrust: Implications from a Network Perspective