TPU-based porous heterostructures by combined techniques
-
Alessandra Longo
 and
Ernesto Di Maio
and
Ernesto Di Maio

Abstract
The production of thermoplastic polyurethane-based porous heterostructures combining physical foaming with fused deposition modeling is detailed in this contribution. The choice of combining these two techniques lies in the possibility of creating objects endowed with a dual-scale structure at millimeter scale by fused deposition modeling and at microscopic scale by gas foaming. Thermal stability and rheological properties of the neat polymer were studied prior to foaming to design a suitable processing protocol and three different combined techniques are proposed: pressure quench, temperature rise and direct 3D foam printing. Foam morphologies were evaluated by SEM and foamed samples were characterized by thermal and mechanical analyses to highlight the differences among the combined processing techniques. Samples foamed via pressure quench exhibit the highest degree of crystallinity and a uniform cell morphology, also resulting in the largest stiffness. The results presented in this contribution open up the possibility of producing objects with complex geometry and porosity architecture at the dual scale.
1 Introduction
Porous heterostructures are structures composed of micro and macro pores, whose morphology can be tuned to a specific application by manufacturing and synthesis. Research in this field is mainly focused on multiple materials structures and the most diffused and studied porous heterostructures are layered structures containing an interphase between different materials. These systems find applications in the energy industry as semiconductors (Shi et al. 2015), supercapacitors (Hong et al. 2017), electrocatalysts (Karthick et al. 2021), electromagnetic shielding material (Gao et al. 2021), microwave absorption (Huang et al. 2019; Qin et al. 2021) or in the medical field as drug delivery systems (Gârea et al. 2017). Focusing on a mono-material heterostructure, the easy-tunable morphology of porous heterostructures gives them favorable mechanical, thermal and acoustic properties, with a considerable potential in the field of light structures (Drobny 2014).
Thermoplastic polyurethanes (TPUs) are a class of linear block copolymers of soft and hard segments with no covalent crosslinked structure (Bartolomé et al. 2013; Jia et al. 2013; Qi and Boyce 2005). TPUs are a rich family of polymers where additives, catalysts, stabilizers and flame retardants can modify the properties to reach specific needs. Due to their versatility, excellent tensile strength and wide elastic regions, TPUs signal a constantly growing consumption on a world scale since they are able to satisfy a wide variety of application needs and are suitable for the production of footwear (Zhang et al. 2019), gaskets, tubes (Jamil et al. 2017) or films (Wang et al. 2011).
With the spreading of additive manufacturing, TPUs has also been successfully used in 3D printing; in particular, the qualities of TPU have become interesting for the Fused Deposition Modeling (FDM) technology (Haryńska et al. 2018; Xiao and Gao 2017).
Gas foaming of TPU has been the focus of several research works and different blowing agents are used such as butane (Hossieny et al. 2014), azodicarbonamide (Nema et al. 2008), NaHCO3 (Nema et al. 2008) and carbon dioxide (Kharbas et al. 2017). Using CO2 as a blowing agent has many advantages, including environmental friendliness, plasticization, and easy and complete separation from the polymer (Ruiz et al. 2011). In addition to the environmental aspects, foaming with CO2 has economic advantages, including the reduced consumption of raw material and reduced waste. In addition, foams produced with CO2 have sufficiently low density, excellent quality and a uniform cell structure (Wang et al. 2019; Zhao et al. 2021). Due to its stochastic pore-formation mechanism, gas foaming is not suitable when it is required to finely locate spatially the porosity/voids. To enlarge the range of foams applications (e.g., to increase their mechanical performance) coupling physical foaming to a processing technique able to control pore/void location is in order (Damanpack et al. 2021; Jung et al. 2013; Yoo et al. 2017).
Additive manufacturing of polymers, has great potential to reduce manufacturing costs and improve design flexibility, as it allows for fast and multiple prototyping without using expensive instruments like in injection molding (Conner et al. 2014; Horst et al. 2018; Popescu et al. 2018; Wang et al. 2017). The 3D printing technology has been widely used in various fields, such as biomedicine (Xiao and Gao 2017), apparel design (Zhang et al. 2019) and aerospace (Vashishtha et al. 2011), owing to its customization, rapid prototyping of complex structures and low cost.
Among the 3D printing methods, FDM is a solvent free method where the molten filament is extruded from a nozzle and then stacked layer by layer according to predetermined patterns. It is suitable for processing a large variety of thermoplastics and to achieve complex structures, on small and large scales (Chen et al. 2018; de Leon et al. 2016). The limit of FDM is the resolution, today ∼100 µm, not comparable to gas foaming, when sub-micron pores are nowadays produced (nanocellular foams).
Generally, porosity in structures produced via FDM is undesirable, as it affects the mechanical properties of the model. However, in specific cases such as the prototyping of foamed structures, porosity is intentionally induced to produce porous heterostructures by combining additive manufacturing with foaming. Various routes are reported in the literature to achieve these results (Nofar et al. 2022) and, among them, the use of syntactic foams to produce 3D printing filaments (Bharath et al. 2020; Bonthu et al. 2020) and foaming of 3D printed structures (Nofar et al. 2022; Park et al. 2018) appear as promising. In particular, microcellular TPU honeycomb with an ultra-low density has been produced by Hu et al. (2021) by coupling additive manufacturing and solid state CO2 foaming.
In this work, a combination of two techniques, namely 3D printing by FDM (thereafter designated as 3D) and gas foaming, is proposed to finely design the porosity architecture at dual scale, achieving TPU-based heterostructures. Three combined methods are proposed: i) 3D + pressure quench (PQ), thereafter collectively designated as 3P; ii) 3D + temperature rise (TR), thereafter collectively designated as 3T; iii) and direct 3D Foam Printing, thereafter designated as F3.
2 Materials and methods
2.1 Materials
A TPU filament with a diameter of 1.75 mm, produced by FILOALFA (Torino, Italy), with shore hardness of 55D and a density of 1.25 g/cm³, was used. CO2 (99.95% pure) was supplied by SOL (Naples, Italy).
2.2 Samples preparation
3D printed samples were obtained with the Original Prusa i3 MK3S (Prusa Research a.s., Prague, Czech Republic) 3D printer at a printing speed of 20 mm/s, a layer height of 0.3 mm, a temperature of 230 °C, as suggested by the producer, and a nozzle of 0.4 mm. The printing plate was heated to a temperature of 50 °C to ensure the adhesion of the material to the plate. As an exemplary structure and as a tribute to their contribution to the field of foam structures, we worked on the Gibson & Ashby cubic (G&A) structure (Gibson and Ashby 1999). Specifically, we have 3D printed 8-unit cells G&A structures, whose geometry is depicted in Figure 1.

G&A structures, A) CAD model (t = 1.6 mm and a = 25 mm), B) optical picture of the printed model, C) details of the unit cell of the model, D) SEM images of the vertical strut sections (transversal and longitudinal), E) SEM images of the horizontal strut sections (transversal and longitudinal).
High-pressure structure conditioning (CO2 sorption) and foaming were conducted with an autoclave having a volume of 0.3 L (model BC-1, High Pressure Equipment Co (HiP), Erie, PA, USA). It consists of a thermoregulated cylinder with closed heating bands. The processing parameters were controlled by means of a PID controller (model X1, Ascon-New England Temperature Solutions, Attleboro, MA, USA) and a syringe pump 500D (Teledyne Isco, Lincoln, NE, USA). The pressure relief system consists of a discharge valve (model 15–71 NFB ball valve, HiP), an electromechanical actuator (model 15–72 NFB TSR8, HiP) and a solenoid valve. More details of the equipment are reported in (Marrazzo et al. 2007).
2.3 Characterization
Thermal and rheological analyses were conducted to fine tune the processing conditions (e.g., processing temperature) and pre-treatment requirements (e.g., the need of moisture removal before processing).
A Perkin Elmer Diamond TGA was used for the thermogravimetric analysis. Samples were prepared with a weight of approximately 5 mg. A set of samples were dried prior to measurement under vacuum at 60 °C overnight to evaluate the influence of moisture on degradation. The test was then carried out both in air and in nitrogen with a purge flow of 30 mL/min, with a ramp of 20 K/min from 30 °C to 800 °C.
A Perkin-Elmer Pyris Diamond DSC, equipped with an Intracooler II as a cooling system, was adopted for differential scanning calorimetry tests on both the as received polymer and on the different foams produced in this study. The instrument was calibrated in temperature and energy with a high purity indium standard, using dry nitrogen as the purge gas at a rate of 30 mL/min. The samples were heated from −50 °C to 240 °C at a rate of 100 K/min.
Rheological measurements were performed with an ARES rotational rheometer (TA Instruments, New Castle, DE, USA) equipped with a parallel plate geometry of 25 mm and a convection oven for thermal control. Sample discs for rheological measurements with thickness equal to 1 mm were prepared by 3D printing. Dynamic measurements were carried out at strain values within the linear regime.
The density of the samples was measured by two different procedures, using an analytical balance (Mettler Toledo, Columbus, OH, USA) as follows:
ρ strut–at the millimeter scale, taking a piece of the structure (strut), and measuring its density by the buoyancy method, according to ASTM D792 standard,
ρ app–at the macroscopic scale, considering the G&A structure as a uniform solid structure, as the ratio between the entire model weight (m) and the macroscopic volume V = a 3 (where a is the edge of the G&A structure, see Figure 1), ρ app = m/V.
Compression properties of the foams were evaluated by testing the material according to the ASTM D1621-00 standard. The cubic specimens were prepared using the three foaming techniques that will be illustrated later. The tests were performed in displacement control, using a universal electromechanical machine (model 43258y234, Instron, AL, USA), with a head speed of 5 mm/min with a load cell of 0.1 kN, in three replicates.
The cellular structure of the foams was studied using a scanning electron microscope (model TM3000 TableTop, Sec, Gyeonggi-do, Korea). The samples were first sectioned with a blade and then sputtered with gold.
2.4 Processing methods
Three processing techniques, namely PQ, TR and 3D were combined for producing foamed G&A structures, and three different combinations were adopted thereof, namely 3P, 3T and F3, as detailed below. Process parameters for each were optimized after some pre-trials specifically devoted to prevent polymer degradation and collapse of the printed structure during foaming, and are summarized in Table 1. A schematic illustration of the three combined processing methods are reported in Figure 2.
Process parameters for the combined foaming processing methods.
| Single technique code | 3D printing |
Foaming | 3D printing |
Foaming | 3D printing |
Foaming | |||
|---|---|---|---|---|---|---|---|---|---|
| 3D |
PQ | 3D |
TR | 3D |
3D | ||||
| Combined method code | 3P | 3T | F3 | ||||||
| Conditions for the specific technique | T (°C) | P (MPa) | t (min) | T (°C) | P (MPa) | t (min) | T (°C) | P (MPa) | t (min) |
| Solubilization before printing | – | – | – | – | – | – | 25 | 5 | 60 |
| Printing | 230 | – | 26 | 230 | – | 26 | 215 | 30 | |
| Heating | 180 | – | 10 | – | – | – | – | – | – |
| Solubilization after printing | 180 | 12 | 10 | 25 | 4 | 60 | – | – | – |
| Oil bath | – | – | – | 120 | – | 0.17 | – | – | – |

Graphic illustration of the combined foaming processing methods. Color codes:  = polymer,
  = CO2,
  = polymer/CO2 solution.
2.4.1 Pressure quench (3P)
The 3D printed G&A structure was inserted into the autoclave, pre-heated at a temperature of about 175 °C. Vacuum is applied for 10 min and a temperature of 180 °C is reached. The autoclave was then pressurized with CO2 at a pressure of 12 MPa and a saturation time of 10 min and eventually pressure released at 10 MPa/s.
2.4.2 Temperature rise (3T)
The 3D printed G&A structure was inserted into the autoclave and the sorption step was conducted at room temperature and a pressure of 4 MPa for about 1 h. Samples were then foamed by immersion for 10 s in thermal oil (ThermoFischer Scientific synth 260), pre-heated at a temperature of 120 °C. Foamed samples were then air cooled.
2.4.3 3D foam printing (F3)
Samples were foamed during the printing phase, in a single process. The filament was saturated with CO2 before printing with a pressure of 5 MPa at room temperature for 1 h. During the impregnation step, a homogenous or inhomogeneous concentration of blowing agents can be obtained by adjusting the solubilization conditions. When the filament is removed from the autoclave, CO2 desorbs from the filament. This process must be modeled and controlled giving additional degree of freedom to obtain different gas concentration profiles and corresponding different structures.
In our case, ca. 10 min elapsed between removing the filament from the autoclave and inserting the filament into the printer. The foamed G&A structure was printed at a speed of 20 mm/s. With respect to 3P and 3T, a printing temperature of 230 °C induced a severe collapse of the foamed structure. Hence, lower temperatures were explored to optimize the process. A printing temperature of 215 °C was selected as the optimal nozzle temperature to induce simultaneous melting, deposition and foaming without issues related to clogging or collapse. Furthermore, a fan speed of 20% was used. By varying the impregnation time, the impregnation pressure and the printing temperature, it was possible to obtain foams with different densities and internal morphologies.
3 Results
3.1 Rheological properties
Dynamic rheological tests were carried out to investigate the flow properties of the material at different temperatures. At temperatures higher than 210 °C, the TPU polymer behaves as a viscous material. Figure 3 reports the complex viscosity as a function of angular frequency at temperatures between 210 and 230 °C. At such temperatures, the complex viscosity is nearly constant in the explored frequency range, indicating Newtonian behavior. We remark that, in the Newtonian limit, the complex viscosity coincides with the steady viscosity (Ferry 1980). As expected, the viscosity undergoes a strong decrease with increasing temperature, dropping from approximately 300 Pa⋅s at 210 °C to nearly 20 Pa⋅s at 230 °C. This is a typical feature of thermoplastic polymers.

Complex viscosity as a function of angular frequency at different temperatures.
At temperatures below 210 °C, the rheological response of the material transitions from liquid-like to solid-like, as demonstrated in Figure 4 which reports frequency sweep data on the sample at 200 °C. The elastic modulus is larger than the viscous one over the entire frequency range. Furthermore, at low frequencies, the elastic modulus tends to approach an equilibrium plateau, typical of a viscoelastic solid.

Frequency sweep test on TPU sample at 200 °C.
To elucidate the transition from liquid to solid behavior, we run a dynamic temperature ramp test from 190 °C to 230 °C and back, at a frequency of 5 rad/s and a heating rate of 10 °C/min. Figure 5 depicts the viscoelastic moduli as functions of temperature during the heating/cooling cycle. At low temperatures the response of the material is predominantly solid-like, with G′ larger than G″. At a temperature of approximately 205 °C, a crossover between the viscoelastic moduli is observed. At temperatures higher than 205 °C, the response of the material becomes predominantly viscous, with G″ > G′.

Dynamic temperature ramp test performed on the TPU polymer at 10 °C/min.
At a temperature of approximately 215 °C, a drop of the moduli is observed during heating. This could be possibly ascribed to thermal degradation. The latter hypothesis is further corroborated by the fact that, during cooling, the transition from liquid to solid is not observed. Instead, the viscous modulus is larger than the elastic one over the entire temperature range.
From this analysis it was deduced that the optimal printing temperature is between 210 °C and 230 °C. Higher temperatures would induce thermal degradation also evidenced by the formation of bubbles, which would negatively affect the printing process.
3.2 Thermogravimetry
Before processing, TGA was carried out to determine the presence of water in the polymer and, therefore, if the filament requires a drying pre-treatment to remove any moisture and prevent degradation during the printing step.
Figure 6 shows the weight loss curves of the filament as received and after drying in an oven at 60 °C overnight. The analysis has been conducted under air atmosphere to reproduce the processing environment.

TGA of TPU samples in air atmosphere.
Both samples display the three-stage degradation characteristic of TPU in oxidizing environment. The first two steps located approximately at 300 °C and 350 °C are related to the decomposition of the main TPU chain and the degradation of polyols and isocyanates, while the third step at around 500 °C can be explained by the degradation of char resulting from the combustion occurring at temperatures below 500 °C (Wang et al. 2016, 2018). Worth to be highlighted is the absence of weight loss at 100 °C, commonly related to evaporation of water absorbed in the polymer, suggesting that no moisture is present in the filament as received.
Moreover, the onset of the first stage of degradation is shifted to lower temperature after the drying treatment. Therefore, it was not necessary to carry out a drying treatment in the oven prior to printing.
3.3 Morphologies
The structures obtained from the three foaming processes are shown in Figure 7.
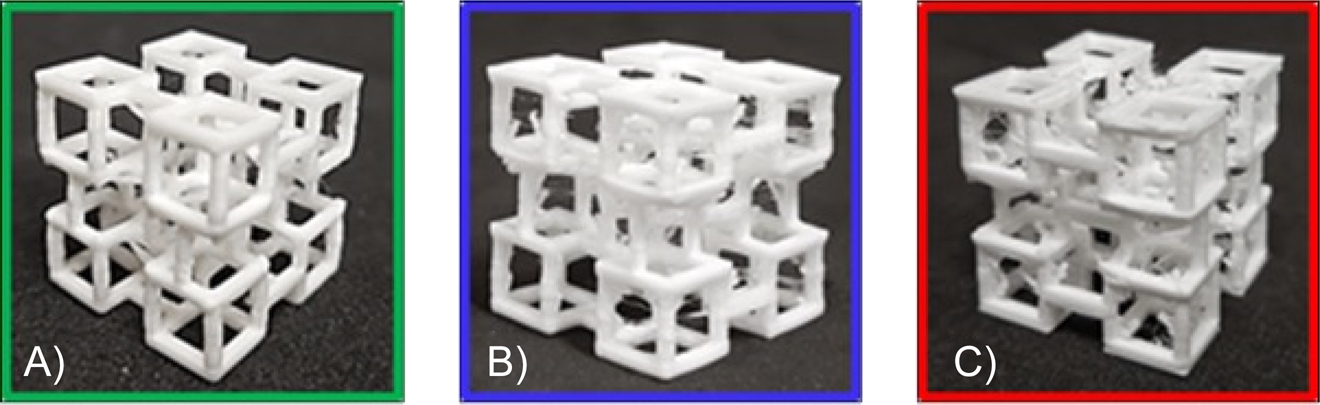
Results obtained from the three foaming processes, A) 3P, B) 3T, C) F3.
The section morphologies were analyzed by SEM at different magnifications (see Figures 8 –10).

SEM of the structure obtained by 3P.

SEM of the structure obtained by 3T.

SEM of the structure obtained by F3.
All the samples display a foamed morphology, which is more evident if compared with the printed model showed in Figure 1.
The morphology of the foams produced by 3P is the most homogenous in size and distribution of bubbles. Foams produced by 3T display smaller cells compared to those obtained from 3P. In F3 (Figure 10), the distribution of the bubbles is very uneven in quantity and size, and they have a slightly elongated shape due to the stretching of the expanded filament during the printing process. A substantial difference between this method and the others is that the layers show a better adhesion between each other; this is due to the phenomenon of expansion out of the nozzle which favors the adhesion of the layers.
3.4 Density
Table 2 reports the densities of the material forming the struts of the G&A model (ρ strut) and the macroscopic apparent density of the G&A model (ρ app), as defined in the Characterization section.
Densities of the samples under investigation.
| Model | ρ strut (g/cm3) | ρ app (g/cm3) |
|---|---|---|
| Printed, neat TPU (no foaming) | 1.25 | 0.16 |
| 3P | 0.84 | 0.14 |
| 3T | 0.87 | 0.15 |
| F3 | 0.87 | 0.14 |
It is noted that, apart from the neat TPU G&A structure (unfoamed), densities are similar among the printed&foamed samples, proving the good control of processing and making the comparison of mechanical properties advantageous.
3.5 Differential scanning calorimetry
Thermal properties of the TPU filament as received and processed samples were studied to investigate the influence of processing on the crystallization behavior of the polymer.
Heat flow curves are shown in Figure 11. Upon heating at 100 K/min, the filament displays the three endotherms typical of untreated TPU. A low temperature endotherm (I), located at around 85 °C is related to the hard-soft segment short range interaction; the second endotherm (II), located in the range 140–200 °C, refers to the destruction of the long range order and the melting of smaller and less packed crystals, while the high-temperature peak (III), above 200 °C, is due to the melting of bigger and tightly packed crystalline regions within hard segments (Koberstein and Russell 1986; Nofar et al. 2019; Seymour and Cooper 1973).

Heat flow curves of TPU neat and foamed samples.
Through processing, in all samples, the endotherms I and II progressively shift to an upward temperature until reaching the borderline case of sample 3P where I and II merge with endotherm III.
This behavior of multiple melting endotherms of TPU is well documented (Balko et al. 2017; Koberstein et al. 1992; Van Bogart et al. 1981). Thermal annealing of the polymer induces morphological changes in segmental elastomers which, in turn, influences the endotherms of TPU. In particular, it has been demonstrated how the endotherm I shifts to higher temperatures with annealing, until merging with endotherm II. In turn, endotherm II shifts into the region of endotherm III after severe annealing (Seymour and Cooper 1971, 1973).
Moreover, the use of CO2 as a blowing agent influences the crystallization of the polymer by acting as a plasticizer. It therefore favors the mobility of the chains, promoting the formation of larger and better packed crystals. This effect, coupled with the thermal treatment on endotherm shifting, justifies the results reported in Figure 11. Sample 3P shows the synergic effect of pressure and temperature in favoring the mobility of the chains and, therefore, the packing of the crystals. The solubilization of CO2 at 180 °C favors the growth and packing of crystals, inducing the formation of uniform morphologies and of larger and better packed crystals. Correspondingly, a shift in the T m to 210 °C and an increase in the ΔH m with the highest value of 20 J/g are observed.
3.6 Compression tests
Figure 12 shows the results of the compression test of neat TPU G&A structures. In Figure 13 the different printed&foamed samples are compared.

Exemplary result of the compression testing on the neat TPU G&A structure with images of the samples showing the structural instabilities corresponding to specific mechanical response stages.
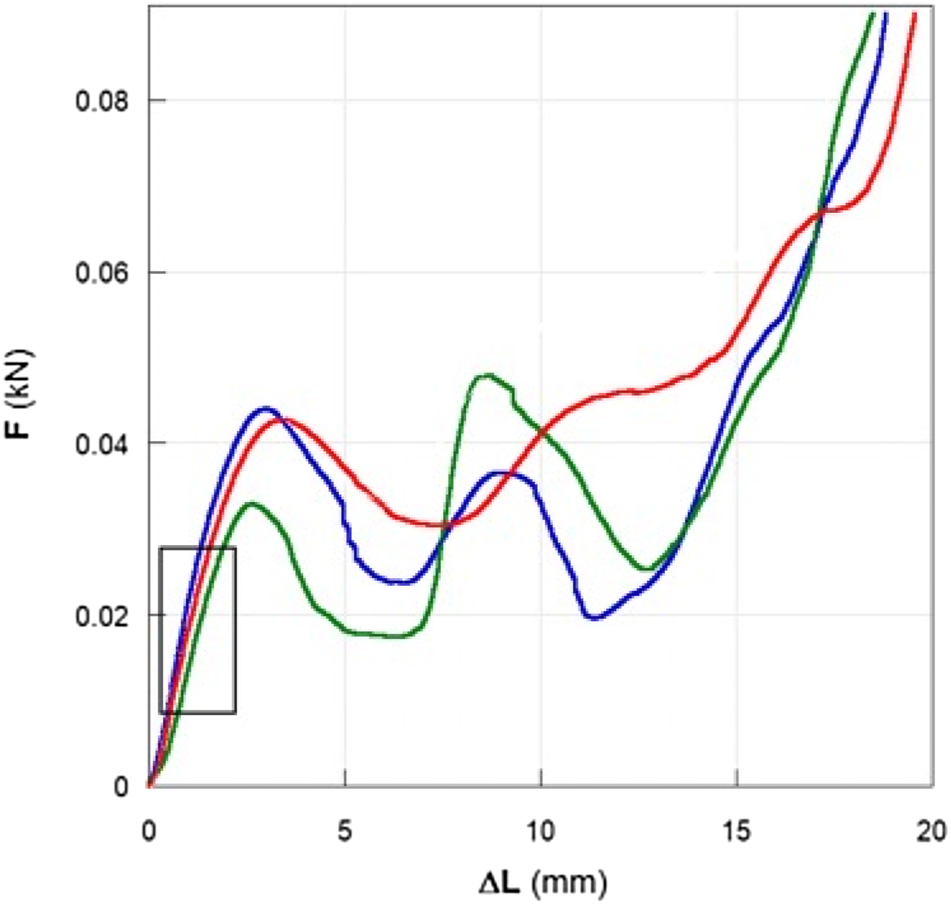
Exemplary result of the compression testing on the printed&foamed G&A structures (green – 3P; blue – 3T; red – F3).
An initial linear section is observed, before instability occurs. Then, when the critical load value is reached, a sudden reduction of the force is observed. With load increasing, typical instability patterns of lattice structures are observed. After the compression test, each model regains its original shape almost completely, suggesting that the samples were tested in the elastic region. The detailed response of the structure in the large displacement region will be the focus of a following investigation. We will herein discuss the initial linear response. The results in the linear region were subsequently analyzed with two procedures: a microscopic and a macroscopic one.
The microscopic analysis was based on the analysis of the stiffness of the single beam that is subjected to bending.
The relative local density of the material forming the strut is calculated as ϕ L = ρ strut/ρ P , with ρ P being the density of the neat TPU. As the initial G&A model response is mainly related to the bending of the horizontal struts (beams), and as we count five vertically aligned of the same, the stiffness of the model was divided by five and compared to the theoretical stiffness of a foamed material in view of the classical G&A model:
where S eM is the experimental stiffness of the whole structure (measured in the linear section of the force (F) versus displacement (ΔL) curves of Figure 13), and S eB is the experimental local stiffness of the beam.
From the beam theory, the displacement of a supported beam with a force in the middle is calculated from:
with I = t
4
/12 being the second moment of inertia, L the length of the beam and t its thickness. The theoretical stiffness of the beam is

Local stiffness of the foamed G&A structures as a function of the strut density. Green = 3P; blue = 3T; red = F3. Open symbols–theoretical stiffness,

Ratio of experimental and theoretical strut stiffness as a function of the strut density. Green = 3P; blue = 3T; red = F3.
From the analysis of Figure 14 it can be stated that no relevant differences are observed among the different processing methods, and from Figure 15 that the value of 1 for
The macroscopic analysis is based on the assumption of the G&A structure as a homogenous material, with a Young’s modulus of the macroscopic model,
The experimental Young’s modulus was compared with the theoretical Young’s modulus and the respective ratio to calculate

Apparent macroscopic Young’s moduli of the G&A structures as a function of the apparent density. Green = 3P; blue = 3T; red = F3. Open symbols–theoretical moduli,

Ratio of experimental and theoretical apparent Young’s moduli as a function of the apparent density. Green = 3P; blue = 3T; red = F3.
Also in this case, given the same dimensions of the G&A structures, minor differences among the processing methods emerge (see Figure 16). Therefore, the ideal G&A model can be successfully adopted to predict the structure behavior given the apparent solid density and the Young’s modulus of the material forming the heterostructure, irrespective of the details of the porous architecture at the different scales.
4 Conclusions
In this work, different processing techniques have been adopted to produce TPU heterostructures in terms of porosity architecture at different scales. A macroscopic porosity was achieved by 3D printing the iconic Gibson and Ashby structure while the microscopic porosity was achieved by different foaming techniques, namely, temperature rise, pressure quench and direct 3D printing and foaming. A thermal and rheological characterization allowed properly designing the different processing stages, avoiding polymer degradation. Microscopy and mechanical characterization were performed on the final structures, highlighting the morphological features of the structures produced via the different techniques as well as the main compressive properties. Treatment of the mechanical response data in view of the classical Gibson and Ashby approach proved its predictive ability and the minor effect of the detail of the porosity architecture on the elastic moduli of the analyzed structures. The study evidenced how by combining processing techniques it is possible to attain several porous structures with porosities at different scales tuned to the specific functional requirement. In fact, with 3D printers it is possible to produce the macroscopic object of virtually any shape, with a macroscopic porosity. Additionally, with the foaming processes it is possible to add a micro-scale porosity with features like pore size, pore number and orientation tailored by selection of the foaming method among the ones proposed in this work.
-
Author contributions: All the authors have accepted responsibility for the entire content of this submitted manuscript and approved submission.
-
Research funding: None declared.
-
Conflict of interest statement: The authors declare no conflicts of interest regarding this article.
References
Bartolomé, L., Aurrekoetxea, J., Urchegui, M.A., and Tato, W. (2013). The influences of deformation state and experimental conditions on inelastic behaviour of an extruded thermoplastic polyurethane elastomer. Mater. Des. 49: 974–980, https://doi.org/10.1016/j.matdes.2013.02.055.Search in Google Scholar
Balko, J., Fernández-d’Arlas, B., Poselt, E., Dabbous, R., Muller, A.J., and Thurn-Albrecht, T. (2017). Clarifying the origin of multiple melting of segmented thermoplastic polyurethanes by fast scanning calorimetry. Macromolecules 50: 7672–7680, https://doi.org/10.1021/acs.macromol.7b00871.Search in Google Scholar
Bharath, H.S., Sawardekar, A., Waddar, S., Jeyaraj, P., and Doddamani, M. (2020). Mechanical behavior of 3D printed syntactic foam composites. Compos. Struct. 254: 112832, https://doi.org/10.1016/j.compstruct.2020.112832.Search in Google Scholar
Bonthu, D., Bharath, H.S., Gururaja, S., Prabhakar, P., and Doddamani, M. (2020). 3D printing of syntactic foam cored sandwich composite. Compos. Part C Open Access 3: 100068, https://doi.org/10.1016/j.jcomc.2020.100068.Search in Google Scholar
Chen, Q., Cao, P., and Advincula, R.C. (2018). Mechanically robust, ultraelastic hierarchical foam with tunable properties via 3D printing. Adv. Funct. Mater. 28: 1800631, https://doi.org/10.1002/adfm.201800631.Search in Google Scholar
Conner, B.P., Manogharan, G.P., Martof, A.N., Rodomsky, L.M., Rodomsky, C.M., Jordan, D.C., and Limperos, J.W. (2014). Making sense of 3-D printing: creating a map of additive manufacturing products and services. Addit. Manuf. 1: 64–76, https://doi.org/10.1016/j.addma.2014.08.005.Search in Google Scholar
Damanpack, A.R., Sousa, A., and Bodaghi, M. (2021). Porous PLAs with controllable density by FDM 3D printing and chemical foaming agent. Micromachines 12: 866, https://doi.org/10.3390/mi12080866.Search in Google Scholar PubMed PubMed Central
de Leon, A.C., Chen, Q., Palaganas, N.B., Palaganas, J.O., Manapat, J., and Advincula, R.C. (2016). High performance polymer nanocomposites for additive manufacturing applications. React. Funct. Polym. 103: 141–155, https://doi.org/10.1016/j.reactfunctpolym.2016.04.010.Search in Google Scholar
Drobny, J.G. (2014). Handbook of thermoplastic elastomers. Elsevier, Oxford, UK.10.1016/B978-0-323-22136-8.00013-2Search in Google Scholar
Ferry, J.D. (1980). Viscoelastic properties of polymers. John Wiley & Sons, Hoboken, USA.Search in Google Scholar
Gao, H., Wang, C., Yang, Z., and Zhang, Y. (2021). 3D porous nickel metal foam/polyaniline heterostructure with excellent electromagnetic interference shielding capability and superior absorption based on pre-constructed macroscopic conductive framework. Compos. Sci. Technol. 213: 108896, https://doi.org/10.1016/j.compscitech.2021.108896.Search in Google Scholar
Gârea, S.A., Voicu, A.I., and Iovu, H. (2017). Clay–polymer nanocomposites for controlled drug release. In: Clay-polymer nanocomposites. Elsevier, Oxford, UK, pp. 475–509.10.1016/B978-0-323-46153-5.00014-8Search in Google Scholar
Gibson, L.J. and Ashby, M.F. (1999). Cellular solids – structure and properties. Cambridge University Press, Cambridge, UK.Search in Google Scholar
Haryńska, A., Gubanska, I., Kucinska-Lipka, J., and Janik, H. (2018). Fabrication and characterization of flexible medical-grade TPU filament for fused deposition modeling 3DP technology. Polymers (Basel) 10: 1304, https://doi.org/10.3390/polym10121304.Search in Google Scholar PubMed PubMed Central
wsHong, J., Lee, Y.-W., Ahn, D., Pak, S., Lee, J., Jang, A.-R., Lee, S., Hou, B., Cho, Y., and Morris, S.M. (2017). Highly stable 3D porous heterostructures with hierarchically-coordinated octahedral transition metals for enhanced performance supercapacitors. Nano Energy 39: 337–345, https://doi.org/10.1016/j.nanoen.2017.07.010.Search in Google Scholar
Hossieny, N.J., Barzegari, M.R., Nofar, M., Mahmood, S.H., and Park, C.B. (2014). Crystallization of hard segment domains with the presence of butane for microcellular thermoplastic polyurethane foams. Polymer (Guildf) 55: 651–662, https://doi.org/10.1016/j.polymer.2013.12.028.Search in Google Scholar
Horst, D.J., Duvoisin, C.A., and de Almeida Vieira, R. (2018). Additive manufacturing at Industry 4.0: a review. Int. J. Eng. Tech. Res. 8: 3–8.Search in Google Scholar
Hu, B., Li, M., Jiang, J., and Zhai, W. (2021). Development of microcellular thermoplastic polyurethane honeycombs with tailored elasticity and energy absorption via CO2 foaming. Int. J. Mech. Sci. 197: 106324, https://doi.org/10.1016/j.ijmecsci.2021.106324.Search in Google Scholar
Huang, T., Wu, Z., Lin, J., Yu, Q., Tan, D., and Li, L. (2019). A facile freeze-drying strategy to prepare hierarchically porous Co/C foams with excellent microwave absorption performance. ACS Appl. Electron. Mater. 1: 2541–2550, https://doi.org/10.1021/acsaelm.9b00565.Search in Google Scholar
Jamil, A., Guan, Z.W., and Cantwell, W.J. (2017). The static and dynamic response of CFRP tube reinforced polyurethane. Compos. Struct. 161: 85–92, https://doi.org/10.1016/j.compstruct.2016.11.043.Search in Google Scholar
Jia, S., Qu, J., Wu, C., Liu, W., Chen, R., Zhai, S., Huang, Z., and Chen, F. (2013). Novel dynamic elongational flow procedure for reinforcing strong, tough, thermally stable polypropylene/thermoplastic polyurethane blends. Langmuir 29: 13509–13517, https://doi.org/10.1021/la4023079.Search in Google Scholar PubMed
Jung, D.-W., Jeong, J.-H., Park, C.B., and Shin, B.-S. (2013). UV laser aided micro-cell opening of EPP foam for improvement of sound absorption. Int. J. Precis. Eng. Manuf. 14: 1127–1131, https://doi.org/10.1007/s12541-013-0153-4.Search in Google Scholar
Karthick, K., Sankar, S.S., Kumaravel, S., Karmakar, A., Madhu, R., Bera, K., and Kundu, S. (2021). Advancing the extended roles of 3D transition metal based heterostructures with copious active sites for electrocatalytic water splitting. Dalt. Trans. 50: 13176–13200, https://doi.org/10.1039/d1dt01645h.Search in Google Scholar PubMed
Kharbas, H.A., McNulty, J.D., Ellingham, T., Thompson, C., Manitiu, M., Scholz, G., and Turng, L.-S. (2017). Comparative study of chemical and physical foaming methods for injection-molded thermoplastic polyurethane. J. Cell. Plast. 53: 373–388, https://doi.org/10.1177/0021955x16652107.Search in Google Scholar
Koberstein, J.T. and Russell, T.P. (1986). Simultaneous SAXS-DSC study of multiple endothermic behavior in polyether-based polyurethane block copolymers. Macromolecules 19: 714–720, https://doi.org/10.1021/ma00157a039.Search in Google Scholar
Koberstein, J.T., Galambos, A.F., and Leung, L.M. (1992). Compression-molded polyurethane block copolymers. 1. Microdomain morphology and thermomechanical properties. Macromolecules 25: 6195–6204, https://doi.org/10.1021/ma00049a017.Search in Google Scholar
Marrazzo, C., Di Maio, E., and Iannace, S. (2007). Foaming of synthetic and natural biodegradable polymers. J. Cell. Plast. 43: 123–133, https://doi.org/10.1177/0021955X06073214.Search in Google Scholar
Nema, A.K., Deshmukh, A.V., Palanivelu, K., Sharma, S.K., and Malik, T. (2008). Effect of exo-and endothermic blowing and wetting agents on morphology, density and hardness of thermoplastic polyurethanes foams. J. Cell. Plast. 44: 277–292, https://doi.org/10.1177/0021955x07088326.Search in Google Scholar
Nofar, M., Küçük, E.B., and Batı, B. (2019). Effect of hard segment content on the microcellular foaming behavior of TPU using supercritical CO2. J. Supercrit. Fluids 153: 104590, https://doi.org/10.1016/j.supflu.2019.104590.Search in Google Scholar
Nofar, M., Utz, J., Geis, N., Altstädt, V., and Ruckdäschel, H. (2022). Foam 3D printing of thermoplastics: a symbiosis of additive manufacturing and foaming technology. Adv. Sci. 9: 2105701, https://doi.org/10.1002/advs.202105701.Search in Google Scholar PubMed PubMed Central
Park, B.K., Hwang, D.J., Kwon, D.E., Yoon, T.J., and Lee, Y.-W. (2018). Fabrication and characterization of multiscale PLA structures using integrated rapid prototyping and gas foaming technologies. Nanomaterials 8: 575, https://doi.org/10.3390/nano8080575.Search in Google Scholar PubMed PubMed Central
Popescu, D., Zapciu, A., Amza, C., Baciu, F., and Marinescu, R. (2018). FDM process parameters influence over the mechanical properties of polymer specimens: a review. Polym. Test. 69: 157–166, https://doi.org/10.1016/j.polymertesting.2018.05.020.Search in Google Scholar
Qi, H.J. and Boyce, M.C. (2005). Stress–strain behavior of thermoplastic polyurethanes. Mech. Mater. 37: 817–839, https://doi.org/10.1016/j.mechmat.2004.08.001.Search in Google Scholar
Qin, R., Ou, A., Li, Y., Deng, H., Liu, Y., and Liu, X. (2021). Noticeably enhanced microwave absorption performance via constructing molecular-level interpenetrating carbon network heterostructure. Carbon 183: 858–871, https://doi.org/10.1016/j.carbon.2021.07.044.Search in Google Scholar
Ruiz, J.A.R., Marc-Tallon, J., Pedros, M., and Dumon, M. (2011). Two-step micro cellular foaming of amorphous polymers in supercritical CO2. J. Supercrit. Fluids 57: 87–94, https://doi.org/10.1016/j.supflu.2011.01.011.Search in Google Scholar
Seymour, R.W. and Cooper, S.L. (1971). DSC studies of polyurethane block polymers. J. Polym. Sci. Part B Polym. Lett. 9: 689–694, https://doi.org/10.1002/pol.1971.110090911.Search in Google Scholar
Seymour, R.W. and Cooper, S.L. (1973). Thermal analysis of polyurethane block polymers. Macromolecules 6: 48–53, https://doi.org/10.1021/ma60031a008.Search in Google Scholar
Shi, D., Guo, Z., and Bedford, N. (2015). Superconducting nanomaterials. In: Shi, D., Guo, Z., and Bedford, N. (Eds.), Nanomater. devices. William Andrew Publishing, Oxford, pp. 191–213.10.1016/B978-1-4557-7754-9.00008-1Search in Google Scholar
Van Bogart, J.W.C., Bluemke, D.A., and Cooper, S.L. (1981). Annealing-induced morphological changes in segmented elastomers. Polymer (Guildf) 22: 1428–1438, https://doi.org/10.1016/0032-3861(81)90250-0.Search in Google Scholar
Vashishtha, V.K., Makade, R., and Mehla, N. (2011). Advancement of rapid prototyping in aerospace industry-a review. Int. J. Eng. Sci. Technol. 3: 2486–2493.Search in Google Scholar
Wang, L., Yang, S., Wang, J., Wang, C., and Chen, L. (2011). Fabrication of superhydrophobic TPU film for oil–water separation based on electrospinning route. Mater. Lett. 65: 869–872, https://doi.org/10.1016/j.matlet.2010.12.024.Search in Google Scholar
Wang, J., Yuan, B., Mu, X., Wang, W., Hu, W., and Hu, Y. (2016). Novel incorporation of mesoporous NiCo2O4 into thermoplastic polyurethane for enhancing its fire safety. RSC Adv. 6: 109620–109632, https://doi.org/10.1039/c6ra24264b.Search in Google Scholar
Wang, X., Jiang, M., Zhou, Z., Gou, J., and Hui, D. (2017). 3D printing of polymer matrix composites: a review and prospective. Compos. Part B Eng. 110: 442–458, https://doi.org/10.1016/j.compositesb.2016.11.034.Search in Google Scholar
Wang, J., Ma, C., Mu, X., Cai, W., Liu, L., Zhou, X., Hu, W., and Hu, Y. (2018). Construction of multifunctional MoSe2 hybrid towards the simultaneous improvements in fire safety and mechanical property of polymer. J. Hazard. Mater. 352: 36–46, https://doi.org/10.1016/j.jhazmat.2018.03.003.Search in Google Scholar PubMed
Wang, G., Wan, G., Chai, J., Li, B., Zhao, G., Mu, Y., and Park, C.B. (2019). Structure-tunable thermoplastic polyurethane foams fabricated by supercritical carbon dioxide foaming and their compressive mechanical properties. J. Supercrit. Fluids 149: 127–137, https://doi.org/10.1016/j.supflu.2019.04.004.Search in Google Scholar
Xiao, J. and Gao, Y. (2017). The manufacture of 3D printing of medical grade TPU. Prog. Addit. Manuf. 2: 117–123, https://doi.org/10.1007/s40964-017-0023-1.Search in Google Scholar
Yoo, C.J., Shin, B.S., Kang, B.S., Gwak, C.Y., Park, C., Ma, Y.W., and Hong, S.M. (2017). A study on a new 3D porous polymer printing based on EPP beads containing CO2 gas. Procedia Eng 184: 10–15, https://doi.org/10.1016/j.proeng.2017.04.064.Search in Google Scholar
Zhang, Z.X., Dai, X.R., Zou, L., Wen, S.B., Sinha, T.K., and Li, H. (2019). A developed, eco-friendly, and flexible thermoplastic elastomeric foam from SEBS for footwear application. Express Polym. Lett. 13: 948–958, https://doi.org/10.3144/expresspolymlett.2019.83.Search in Google Scholar
Zhao, J., Wang, G., Zhang, A., Zhao, G., and Park, C.B. (2021). Nanocellular TPU composite foams achieved by stretch-assisted microcellular foaming with low-pressure gaseous CO2 as blowing agent. J. CO2 Util. 53: 101708, https://doi.org/10.1016/j.jcou.2021.101708.Search in Google Scholar
© 2022 the author(s), published by De Gruyter, Berlin/Boston
This work is licensed under the Creative Commons Attribution 4.0 International License.
Articles in the same Issue
- Frontmatter
- Editorial
- Special issue for John Vlachopoulos
- Review Article
- Calendering of thermoplastics: models and computations
- Special Issue Contributions
- Film casting of polycarbonate/multi-walled carbon nanotubes composites using ultrasound-assisted twin-screw extruder: experiment and simulation
- Effect of mixing conditions and polymer particle size on the properties of polypropylene/graphite nanoplatelets micromoldings
- Extrusion foaming of linear and branched polypropylenes – input of the thermomechanical analysis of pressure drop in the die
- Improving the thickness distribution of parts with hybrid thermoforming
- Synergistic material extrusion 3D-printing using core–shell filaments containing polycarbonate-based material with different glass transition temperatures and viscosities
- TPU-based porous heterostructures by combined techniques
- Surfactant-free oil-in-oil emulsion-templating of polyimide aerogel foams
- Factors determining the flow erosion/part deformation of film insert molded thermoplastic products
- The extrusion of EPDM using an external gear pump: experiments and simulations
- News
- PPS News