Pre-diagnosis technology for short-circuit withstand capability of distribution transformer based on big data
-
He Dongsheng

 and
Fan Jingmin
and
Fan Jingmin

Abstract
The short-circuit withstand capability test of distribution transformer has the characteristics of long test period, high cost, strong destructiveness, low qualification rate, and can not be verified by simulation or calculation. It has become the bottleneck restricting the engineering and industrialization development of transformer industry. Based on experimental big data, this paper uses the expert diagnosis method of fuzzy mathematics to establish a superior evaluation model. The typical design process of distribution transformers is scored by experts, and the short-circuit passing rate is calculated according to the real short-circuit test data. Linear regression analysis is used to establish the regression equation, and a pre-diagnosis technique for short-circuit withstand capability of distribution transformers is proposed. At the same time, the validity of the model is verified by the actual case, and the accurate pre-diagnosis of the resistance to short-circuit capability is realized. It breaks through the common key technologies of the transformer industry and provides an early warning for the quality control of power grid pro-ducts and the elimination of hidden danger products. It has important theoretical guiding significance and engineering application value.
1 Introduction
As an important transmission and distribution equipment in the power grid system, the transformer is responsible for voltage conversion and power transmission. Its short-circuit withstand capability is directly related to the safe and reliable operation of the power system. Transformer short-circuit faults can cause grid collapse, fire, explosion, electric shock casualties and other vicious accidents, even the large area of power grid cannot restore power supply in the short term. With the rapid expansion of the distribution network, the system capacity has increased sharply, and the capacity of distribution transformers has been seriously over-supplied, resulting in fierce market competition. The quality of distribution transformer is uneven, which brings great challenges to the power grid inspection work. Due to the high test cost and long test cycle of the short-circuit withstand test of distribution transformer, at present, there are only few authoritative test institutions with this short-circuit test capability in China. Therefore, after long-distance transportation, the product virtually increases the test cost and detection period, delaying the overall construction progress and project time of the power grid. What’s more important is that this test can’t verify its reliability through computational simulation, but the real test is very destructive. It is almost impossible to continue to use the product after the test without rectification or repair. It is a great waste of resources [1], [2], [3], [4]. This paper uses the expert diagnosis method of fuzzy mathematics to establish a superior evaluation model [5], [6], [7], [8], [9], and proposes a new pre-diagnosis technology based on statistical analysis of big data [10], [11], [12], [13], [14], [15], [16], [17], [18], [19], which aims at providing rapid, accurate, cost-effective, effective pre-diagnostics and evaluation of distribution transformers’ short-circuit withstand capability. This paper uses the expert diagnosis method of fuzzy mathematics to establish a superior evaluation model [5], [6], [7], [8], [9], and proposes a new pre-diagnosis technology based on statistical analysis of big data [10], [11], [12], [13], [14], [15], [16], [17], [18], [19], which introduce the test parameter probability density and the process parameter weight density, establish the total probability function and the superior evaluation model. Divide the priority level, and judge whether the distribution transformer has short-circuit capability through the superior grade. Thought this model, we can rapid, accurate, cost-effective, effective pre-diagnostics and evaluation of distribution transformers’ short-circuit withstand capability. According to the case analysis, this greatly improves the detection efficiency and achieves accurate warning and early prevention.
2 Big data pre-diagnosis method of distribution transformers
This paper collects the hanging photos and type test data of more than 300 distribution transformers of the China National Quality Supervision and Testing Center for Smart Grid Transmission and Distribution Equipment in the past three years. It analyzes the different process adoptions of distribution transformers of various specifications and models through big data statistics method, and combines the pre-diagnosis process to quickly evaluate whether the distribution transformer has short-circuit withstand capability.
2.1 Typical process classification for distribution transformers
This paper counts the most common S11∼S15 oil-immersed distribution transformers at present, and selects different processes under the four typical capacities of 100, 200, 400 and 630 kVA. There are six typical processes including block material, the winding compression ring structure, lead wire clamp, winding impregnation or winding varnishing, lead insulation, and core clamp ribs, as shown in Figure 1.
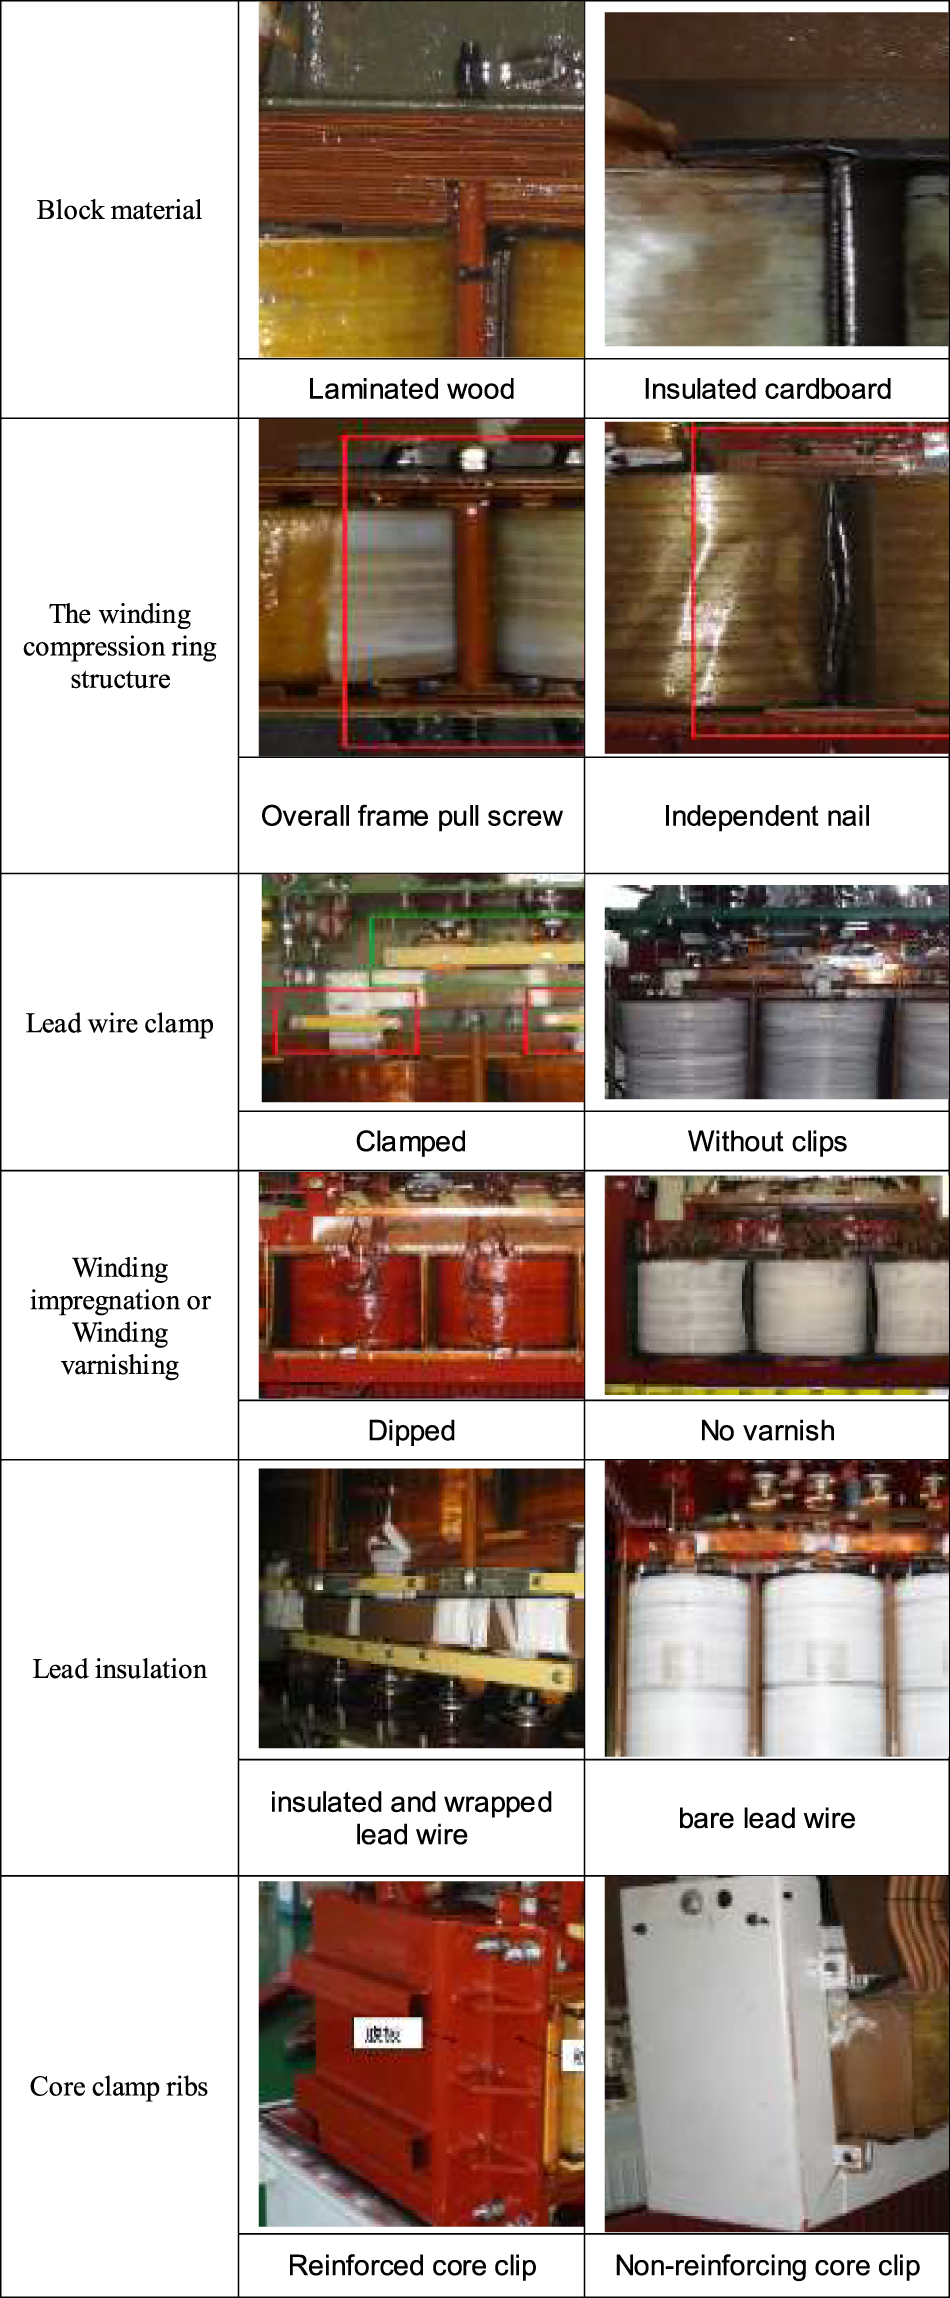
Typical process map.
2.2 Typical process analysis of distribution transformers
(1). Block material: The block material acts as an insulation and mechanical support in the distribution transformer, and is distributed on the upper and lower sides of the winding to form an integral support structure with the clamp member. When the block is subjected to short-circuit impact force, it has a certain elastic buffering effect. The better material is laminated wood, and the poor one is insulated paperboard. (2). Lead insulation: Most of the lead insulation is insulated with cardboard or insulator to separate the low voltage winding lead wire from the neutral point lead wire, in order to prevent them discharging to each other when the transformer runs short circuit. (3). The winding compression ring structure: The winding compression ring structure mainly has an integral pull screw structure and a separate nail structure. The former tightly grips and clamps the entire winding by connecting a long screw in the middle of the clamp, and the latter independently holds a part of the winding by the upper and lower clamps with screws. (4). Lead wire clamp: The lead wire clamp member is used for fixing the lead wire end of the winding, and is generally fixed on the core clip by the lead wire clamp of the epoxy material, so as to avoid the fault caused by the excessive swing of the lead wire during the short circuit. (5). Winding impregnation or Winding varnishing: Winding impregnation or Winding varnishing process mainly adopts two methods. One is to dip the windings and the materials other than the windings as a whole, and the other is to paint only the windings. Winding impregnation or Winding varnishing process not only strengthens the winding insulation, but also enhances the mechanical properties of the winding, making it less prone to misalignment and enhancing short-circuit withstand capability. (6). Core clamp ribs: The iron core clamp rib is generally welded to the joint between the web and the limb of the core clamp to enhance mechanical stability.
3 Pre-diagnostic evaluation model
3.1 Priority evaluation model
According to the hanging photos or design drawings, the different processes used for different capacity transformers are determined, we introduce the test parameter probability density
Priority evaluation model for adapting to short-circuit capability.
| Typical process/ |
Interval | Value | Weighted proportions/ |
|---|---|---|---|
| Block material |
Superior | 1 |
|
| Qualified | 0.5 | ||
| Inferior | 0 | ||
| The winding compression ring structure |
Superior | 1 |
|
| Qualified | 0.5 | ||
| Inferior | 0 | ||
| Lead wire clamp |
Superior | 1 |
|
| Qualified | 0.5 | ||
| Inferior | 0 | ||
| Winding impregnation or winding varnishing |
Superior | 1 |
|
| Qualified | 0.5 | ||
| Inferior | 0 | ||
| Lead insulation |
Superior | 1 |
|
| Qualified | 0.5 | ||
| Inferior | 0 | ||
| Core clamp ribs |
Superior | 1 |
|
| Qualified | 0.5 | ||
| Inferior | 0 |
Priority ranking table.
| Superior grade | Basis of division | Degree description |
|---|---|---|
| Ⅰ |
|
Excellent |
| Ⅱ |
|
Average |
| Ⅲ |
|
Qualified |
| Ⅳ |
|
Defective |
| V |
|
Poor |
The establishment of the superior evaluation model adopts the expert diagnosis method based on fuzzy mathematics: by collecting and counting the hanging photos and type test data before and after the short-circuit test of 308 distribution transformers of the center in the past three years, attribution analysis was performed on typical processes of distribution transformers and short-circuit test pass rates. In the case of the unknown short-circuit test results, the experts in the field of distribution transformer design and inspection scored the short-circuit-proof design of the corresponding transformer from the perspective of six typical processes according to the hanging photos. After collecting and summarizing the scores, the distribution transformers are classified into superior, qualified and inferior products according to the level of each process. According to the value of Table 1, the six typical processes of a single distribution transformer form a lateral quantity
The short-circuit test pass rate
which is
From this, the weight coefficients (
3.2 Model derivation
Taking a distribution transformer with a capacity of 200 kVA as an example, regression analysis is performed with Matlab to establish a basic model
The corresponding relationship between the grade of superiority and the rate of change of phase resistance before and after short-circuit test.
| Superior grade | Basis of division | The phase reactance change rate before and after the short-circuit test | Degree description |
|---|---|---|---|
| Ⅰ |
|
|
Excellent |
| Ⅱ |
|
|
Average |
| Ⅲ |
|
|
Qualified |
| Ⅳ |
|
|
Defective |
| V |
|
|
Poor |
The relationship between
The results of the basic model regression test are shown in Table 4.
Regression results of the basic model of 200 kVA distribution transformer.
| Regression coefficients | Estimate of regression coefficient | Confidence interval of regression coefficients |
|---|---|---|
|
|
0.1235 | [−0.0423 0.2894] |
|
|
0.5612 | [0.4246 0.6977] |
|
|
−0.0840 | [−0.2938 0.1259] |
|
|
0.1950 | [0.0743 0.3157] |
|
|
−0.0292 | [−0.1489 0.0905] |
|
|
0.1483 | [−0.0015 0.2981] |
In the saliency verification of multiple regression, the linear relationship test (

T-test of stepwise regression.
In general, the following conditions imply that the model has multiple collinearity:
There is a significant correlation between the respective variables in the model;
When the F-test of the model is significant, the t-test of almost all regression coefficients is not significant;
The sign of the regression coefficient is opposite to what is expected.
It is known from the significance verification that the 200 kVA distribution transformer’s basic model may have multiple collinearity, and for further confirmation, the correlation between the respective variables can be verified. The correlation between the respective variables can be calculated from the correlation coefficient as shown in Eq. (5).
In the formula,
To avoid multiple collinearity in the regression model, we use stepwise regression to combine the forward selection with the backward elimination to filter the independent variables. After adding a new independent variable, it will re-examine all the variables in the model to determine whether it is necessary to eliminate an independent variable (If a new independent variable is added, the contribution of the previous independent variable to the model becomes insignificant, and the previous variable will be removed). In this way, the variables are continuously increased and the insignificant variables are considered to be eliminated, until the increase of the variables has not been able to significantly reduce the sum of squared residuals
Similarly, regression equations for distribution transformers with capacities of 100, 400, and 630 kVA can be obtained. The model is summarized as Tables 5–8.
Distribution transformer model with capacity of 100 kVA.
| Typical process/ |
Interval | Value | Weighted proportions/ |
|---|---|---|---|
| Winding impregnation or winding varnishing |
Superior | 1 | |
| Qualified | 0.5 | ||
| Inferior | 0 | ||
| Lead insulation |
Superior | 1 | |
| Qualified | 0.5 | ||
| Inferior | 0 |
Distribution transformer model with capacity of 200 kVA.
| Typical process/ |
Interval | Value | Weighted proportions/ |
|---|---|---|---|
| The winding compression ring structure |
Superior | 1 | |
| Qualified | 0.5 | ||
| Inferior | 0 | ||
| Winding impregnation or winding varnishing |
Superior | 1 | |
| Qualified | 0.5 | ||
| Inferior | 0 | ||
| Core clamp ribs |
Interval | 1 | |
| Superior | 0.5 | ||
| Qualified | 0 | ||
Distribution transformer model with capacity of 400 kVA.
| Typical process/ |
Interval | Value | Weighted proportions/ |
|---|---|---|---|
| The winding compression ring structure |
Superior | 1 | |
| Qualified | 0.5 | ||
| Inferior | 0 | ||
| Core clamp ribs |
Superior | 1 | |
| Qualified | 0.5 | ||
| Inferior | 0 | ||
Distribution transformer model with capacity of 100 kVA.
|
Typical process/ |
Interval |
Value | Weighted proportions/ |
|---|---|---|---|
| Block material |
Superior | 1 | |
| Qualified | 0.5 | ||
| Inferior | 0 | ||
| The winding compression ring structure |
Superior | 1 | |
| Qualified | 0.5 | ||
| Inferior | 0 | ||
| Lead wire clamp |
Superior | 1 | |
| Qualified | 0.5 | ||
| Inferior | 0 | ||
| Winding impregnation or winding varnishing |
Superior | 1 | |
| Qualified | 0.5 | ||
| Inferior | 0 | ||
The regression equation is
The regression equation is
The regression equation is
The regression equation is
3.3 Data distribution analysis
When the number of samples is limited, a simple analysis using a box plot can visually observe the data distribution and determine if abnormal data exists. Box plots, alias boxes, boxes and so on, are statistical methods invented by John Wilder Tukey, which visually represent the overall distribution of data and eliminate abnormalities that are far from the overall data. The specific way is that all the data are arranged in order from small to large, and one number (two averages) in the middle of the data is the median. The numbers at the 75 and 25% positions in the permutation data are respectively defined as the upper quartile (Q3) and the lower quartile (Q1). The interquartile range is obtained from the upper and lower quartiles, is IQR = Q3 − Q1, and the upper and lower limits are respectively obtained according to Q3 + 1.5IQR and Q1 − 1.5IQR, and the values outside the upper and lower limits are defined as outliers. The specific Fig. is shown in Figure 3.

Box plot.
Since the short-circuit test is a destructive test, 308 distribution transformers for short-circuit test contain four capacities of 100, 200, 400, and 630 kVA, and the number of samples of the same capacity is relatively small. For the four capacity distribution transformers, the distribution of the short-circuit test pass rate

Box plot of four capacity distribution transformer test pass rate.
On the box plot of the short-circuit pass rate of the distribution transformers of 100, 200, 400, and 630 kVA, the upper limit, the lower limit, the first quartile, and the third quartile are respectively taken. By performing piecewise linear interpolation on other uncovered capacities, the short-pass rate distribution map of the following Fig. can be obtained. The green part in Figure 5 is the most likely short-circuit test pass rate

Short-circuit pass rate interval division map.
4 Case analysis
4.1 Case 1 (typical capacity)
In April 2018, the center received an S13-M-630/10 oil-immersed distribution transformer commissioned by a power grid company. After the routine test was completed, the hanging core inspection before the short-circuit test was performed on the distribution transformer, and the state of the typical process of internal use of the distribution transformer was photographed from a plurality of angles. The photo of the hanging core inspection is shown in Figure 6.

Hanging core of 630 kVA distribution transformer.
It can be seen from Figure 6 that the distribution transformer does not use the winding compression ring structure of the pressing nail or the pulling screw to compress the winding to prevent the winding from being axially moved by the electric power. The low voltage lead-out soft row is also not fixed, and is separated from the core clip only by the insulating cardboard. The surface of the winding is painted, but not the overall dipping. No reinforcing ribs are used on the core clamp. That is to say, except the winding painting process is used, the other five typical processes are not used. Therefore, the winding impregnation or winding. Varnishing
Substituting the value of
4.2 Case 2 (atypical capacity)
In May 2018, the center received an S13-M-315/10 oil-immersed distribution transformer commissioned by a power grid company. After the routine test was completed, the hanging core inspection before the short-circuit test was performed on the distribution transformer, and the state of the typical process of internal use of the distribution transformer was photographed from a plurality of angles. The photo of the hanging core inspection is shown in Figure 7.

Hanging core of 315 kVA distribution transformer.
It can be seen from Figure 7 that the distribution transformer adopts a laminated wood integral block and is pressed by a pull screw pressing ring structure. The low-voltage lead wire is fixed on the core clip with a laminated wood clip. The winding is immersed and the webs and ribs of the core clamp are reinforced with ribs. That is to say, six typical processes are used on the distribution transformer, and the structure is compact. The neutral line with no current passing under the symmetrical load is also tied and fixed. The distribution transformer obviously adopts strengthening measures in the short-circuit withstand capability improvement. Therefore, the values of the six typical processes are all 1. There is no ready-made regression equation that can directly apply the short-circuit through rate of a distribution transformer with a capacity of 315 kVA. Thus, the regression equations of 200 and 400 kVA and the short-circuit pass rate interval division map are combined to judge. Substituting the regression equation of 200 kVA, the short-circuit passing rate

Short-circuit pass rate interval division map.
5 Conclusion
Based on experimental big data, this paper uses the expert diagnosis method of fuzzy mathematics to establish a superior evaluation model. The typical design process of distribution transformers is scored by experts, and the short-circuit passing rate is calculated according to the real short-circuit test data. Linear regression analysis is used to establish the regression equation, and a pre-diagnosis technique for short-circuit withstand capability of distribution transformers is proposed. The specific pre-diagnosis process is divided into four steps: (1) According to the distribution transformer hanging photos or design drawings, determine the typical process value (Typical processes: block material, the winding compression ring structure, lead wire clamp, winding impregnation or winding). (2) U-sing the regression equation to directly calculate the short-circuit test pass rate of the distribution transformer whose capacity is applicable for the regression equation, determine the priority level. (3) For the distribution transformers of the capacity not covered by the regression equation, the model of the adjacent capacity can be combined with the short-circuit test pass rate interval division map to analyze its’ technological level ranking in the same capacity distribution transformers. From the short-circuit test pass rate interval division map, estimate the shortest pass rate of the most probable value distribution interval, and determine the priority level. (4) Distribution transformers of general and below grades can identified as key spot check and inspection objects.
The proposed method provides a pre-warning and early prevention for the grid company’s large-scale distribution transformer material sampling quality control and hidden danger product elimination. Timely monitoring the weak points and risks of the transformer’s short-circuit capability, greatly reducing the cost and period of the field test, and minimizing the destructiveness of the short-circuit test. At the same time, this method also enhances the independent design level of China’s transformers, breaks through the common key technologies and the bottlenecks of engineering and industrialization, improves the ability of innovative development and international competitiveness, seizes the commanding heights of competition.
-
Author contributions: All the authors have accepted responsibility for the entire content of this submitted manuscript and approved submission.
-
Research funding: None declared.
-
Conflict of interest statement: The authors declare no conflicts of interest regarding this article.
References
1. Mouhamad, M, Elleau, C, Mazaleyrat, F, Guillaume, C, Jarry, B. Short-circuit withstand tests of metglas 2605SA1-based amorphous distribution transformers. IEEE Trans Magn 2011;47:4489–92. https://doi.org/10.1109/tmag.2011.2155632.Search in Google Scholar
2. Bo, Z, Yan, L. Research on radial stability of large transformers windings under multiple short-circuit conditions. IEEE Trans Appl Supercond 2016;26:1–4. https://doi.org/10.1109/tasc.2016.2594843.Search in Google Scholar
3. Geißler, D, Leibfried, T. Short-circuit strength of power transformer windings-verification of tests by a finite element analysis-based model. IEEE Trans Power Deliv 2017;32:1705–12. https://doi.org/10.1109/tpwrd.2016.2572399.Search in Google Scholar
4. Zhang, H, Yang, B, Xu, W, Wang, S, Wang, G, Huangfu, Y, et al.. Dynamic deformation analysis of power transformer windings in short-circuit fault by FEM. IEEE Trans Appl Supercond 2014;24:1–4. https://doi.org/10.1109/tasc.2013.2285335.Search in Google Scholar
5. Xu, W, Wang, D, Zhou, Z, Chen, H. Fault diagnosis of power transformers: application of fuzzy set theory, expert systems and artificial neural networks. IEE Proc Sci Meas Technol 1997;144:39–44. https://doi.org/10.1049/ip-smt:19970856.10.1049/ip-smt:19970856Search in Google Scholar
6. Cao, Z, Lin, J, Wan, C, Song, Y, Taylor, G, Li, M. Hadoop-based framework for big data analysis of synchronised harmonics in active distribution network. IET Gener, Transm Distrib 2017;11:3930–7. https://doi.org/10.1049/iet-gtd.2016.1723.Search in Google Scholar
7. Sheng, G, Hou, H, Jiang, X, Chen, Y. A novel association rule mining method of big data for power transformers state parameters based on probabilistic graph model. IEEE Trans Smart Grid 2018;9:695–702. https://doi.org/10.1109/tsg.2016.2562123.Search in Google Scholar
8. Shah, DG, Crow, ML. Stability assessment extensions for single-phase distribution solid-state transformers. IEEE Trans Power Deliv 2015;30:1636–8. https://doi.org/10.1109/tpwrd.2015.2394305.Search in Google Scholar
9. Wang, X, Li, Q, Li, C, Yang, R, Su, Q. Reliability assessment of the fault diagnosis methodologies for transformers and a new diagnostic scheme based on fault info integration. IEEE Trans Dielectr Electr Insul 2013;20:2292–8. https://doi.org/10.1109/tdei.2013.6678882.Search in Google Scholar
10. Chu, L, Qiu, R, He, X, Ling, Z, Liu, Y. Massive streaming PMU data modelling and analytics in smart grid state evaluation based on multiple high-dimensional covariance test. IEEE Trans Big Data 2018;4:55–64. https://doi.org/10.1109/tbdata.2017.2715165.Search in Google Scholar
11. Lyu, B, Li, Y, Fu, J, Trapp, AC, Xie, H, Liao, Y. Scalable user-substation assignment with big data from power grids. IEEE Trans Big Data 2019;5:209–22. https://doi.org/10.1109/tbdata.2017.2766153.Search in Google Scholar
12. Qi, B, Wang, Y, Zhang, P, Li, C, Wang, H. A novel deep recurrent belief network model for trend prediction of transformer DGA data. IEEE Access 2019;7:80069–78. https://doi.org/10.1109/access.2019.2923063.Search in Google Scholar
13. Ke, X, Pang, L, Dong, X, Li, Z. A novel power transformer condition monitoring system based on wide-band measurement of core earth signals and correlation analysis with multi-source data. IEEE Access 2019;7:161754–63. https://doi.org/10.1109/access.2019.2951577.Search in Google Scholar
14. Jiang, J, Chen, R, Chen, M, Wang, W, Zhang, C. Dynamic fault prediction of power transformers based on hidden Markov model of dissolved gases analysis. IEEE Trans Power Deliv 2019;34:1393–400. https://doi.org/10.1109/tpwrd.2019.2900543.Search in Google Scholar
15. Li, L, Yong, C, Long-Jun, X, Li-Qiu, J, Ning, M, Ming, L. An integrated method of set pair analysis and association rule for fault diagnosis of power transformers. IEEE Trans Dielectr Electr Insul 2015;22:2368–78. https://doi.org/10.1109/tdei.2015.004855.Search in Google Scholar
16. Gehao, S, Huijuan, H, Xiuchen, J. A novel association rule mining method of big data for power transformers state parameters based on probabilistic graph model[J]. IEEE Trans Smart Grid 2018;9:695–702.10.1109/TSG.2016.2562123Search in Google Scholar
17. Wang, T, He, Y, Shi, T, Tong, J, Li, B. Transformer health management based on self-powered RFID sensor and multiple kernel RVM. IEEE Trans Instrum Meas 2019;68:818–28. https://doi.org/10.1109/tim.2018.2851840.Search in Google Scholar
18. Fu, W, McCalley, JD, Vittal, V. Risk assessment for transformer loading. IEEE Trans Power Syst 2001;16:346–53. https://doi.org/10.1109/59.932267.Search in Google Scholar
19. Xiong, P, Dang, Y, Wu, X, Li, X. Combined model based on optimized multi-variable grey model and multiple linear regression. J Syst Eng Electron 2011;22:615–20. https://doi.org/10.3969/j.issn.1004-4132.2011.04.010.Search in Google Scholar
© 2021 Walter de Gruyter GmbH, Berlin/Boston
Articles in the same Issue
- Frontmatter
- Research Articles
- Pre-diagnosis technology for short-circuit withstand capability of distribution transformer based on big data
- Residual flux impact in controlled switching of HVDC converter transformer
- A novel transient search optimization for optimal allocation of multiple distributed generator in the radial electrical distribution network
- Characterization of nano-additive filled epoxy resin composites (ERC) for high voltage gas insulated switchgear (GIS) applications
- An intelligent approach towards very short-term load forecasting
- Allocation of active power losses to generators in electric power networks
- Optimization of controller gains to enhance power quality of standalone wind energy conversion system
- A flexible power management strategy for PV-battery based interconnected DC microgrid
- Slow flow solutions and stability analysis of single machine to infinite bus power systems