Estimation of Risk Ratios in Cohort Studies with a Common Outcome: A Simple and Efficient Two-stage Approach
-
Eric Tchetgen Tchetgen


Abstract
The risk ratio effect measure is often the main parameter of interest in epidemiologic studies with a binary outcome. In this paper, the author presents a simple and efficient two-stage approach to estimate the risk ratios directly, which does not directly rely on consistency for an estimate of the baseline risk. This latter property is a key advantage of the approach over existing methods, because, unlike these other methods, the proposed approach obviates the need to restrict the predicted risk probabilities to fall below one, in order to recover efficient inferences about risk ratios. An additional appeal of the approach is that it is easy to implement. Finally, when the primary interest is in the effect of a specific binary exposure, a simple doubly robust closed-form estimator is derived, for the multiplicative effect of the exposure. Specifically, we show how one can adjust for confounding by incorporating a working regression model for the propensity score so that the correct inferences about the multiplicative effect of the exposure are recovered if either this model is correct or a working model for the association between confounders and outcome risk is correct, but both do not necessarily hold.
8 Appendix: proofs
8.1 Proof of Result 1
Let  denote the (probability) limiting value of
 To show that the result holds, it suffices to show that
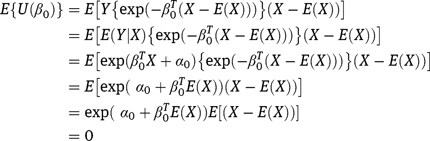
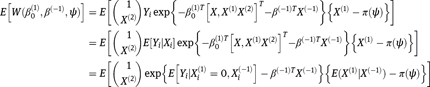
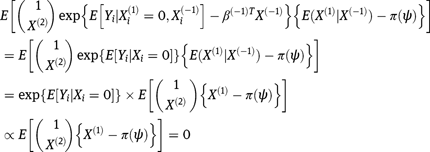
  is an unbiased estimating function; that is, we need to show
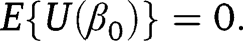 that Now,
To establish the large sample behavior of  we perform a standard Taylor expansion
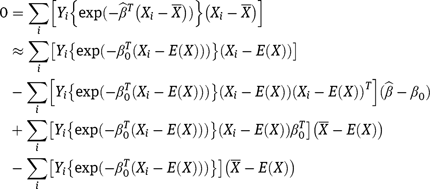
By the law of large numbers and an application of Slutzky’s theorem, we conclude that 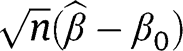 has large sample distribution equal to the distribution of
since We may further conclude that the large sample variance of
  is given by
because
where  Furthermore, because covariance matrices are positive-definite, we may conclude that
 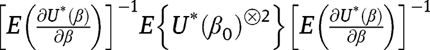 is conservative for the variance-covariance matrice in the positive-definite sense, that for any non-zero constant vector t
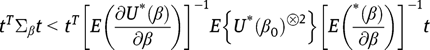
and therefore is a conservative estimator of
 Whereas
 is consistent for
  where
where
8.2 Proof of Result 2
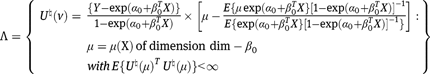
Consider the semiparametric model given solely by restriction (3); then it is well known that all regular and asymptotically linear estimators of  are fully characterized by the set of influence functions:
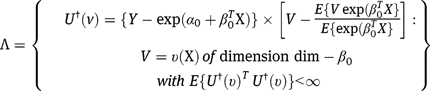
See Bickel et al. [12] and Robins and Rotnitzky [16]. It is straightforward to verify that this set is equivalently written:
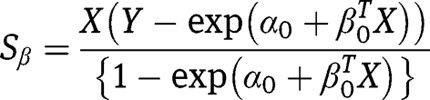
Now, the score for in this model is given by
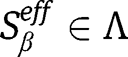
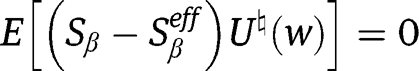
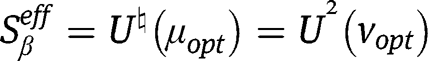
therefore, the efficient score of i.e., the orthogonal projection of
  onto
onto  is
is  ,with
,with  in other words,

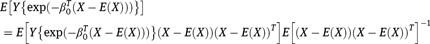
since
 , and for all
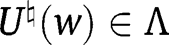
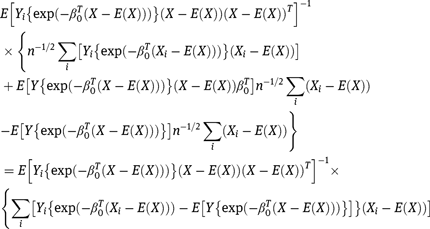
The proof is completed by noting that
where
Then, a theorem due to Bickel et al. [12] states that for any initial  consistent estimator of
  an efficient estimator can be constructed by a one-step update of
  in the direction of the estimated efficient score by using the following formula
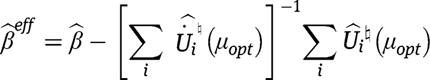
where  is an empirical version of
  obtained by replacing all expectations by empirical expectations, with
  estimated by
  and
and  estimated by the simple plug-in estimator
  is a similarly constructed estimator of the expected derivative of the efficient score
 , with respect to
  evaluated at
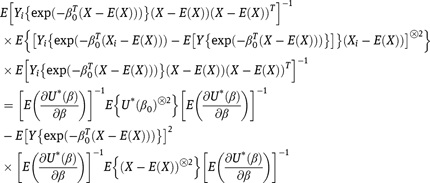
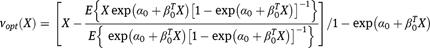
  It is straightforward to verify that
 reduces to the formula provided in the main text. Furthermore, the theorem of Bickel et al. [12] further states that under standard regularity conditions
 , is asymptotically normal with mean zero and variance
which is also the semiparametric efficiency bound of  Finally,
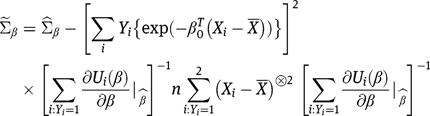
  is an empirical version of
  which converges to the latter in probability.
In order to prove Result 3, we first establish a more general result, for which we allow  to be continuous, and for the model to incorporate a possible interaction between the exposure and the covariates, say
  a component of
  Specifically, we suppose that
![[7]](/document/doi/10.1515/ijb-2013-0007/asset/graphic/ijb-2013-0007_eq40.png)
and let denote a working model for the mean of the exposure given covariates; where
  is the identity link for continuous
  and g is the logit link for binary
  Define the estimating function

Then, we have the following lemma.
Lemma 1: Under model (7),
![[8]](/document/doi/10.1515/ijb-2013-0007/asset/graphic/ijb-2013-0007_eq42.png)
if either but not necessarily both of the following conditions hold,
 or
or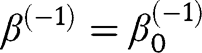 and model (5) holds.
8.3 Proof of Lemma 1
which is certainly zero if (1) holds since then 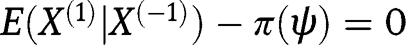 .If (2) holds, we have
since the last quantity is part of the first order condition used to estimate  either by ordinary least-squares when
  is continuous or by logistic regression in the binary case.
8.4 Proof of Result 3
The result immediately follows from Lemma 1 since when  is binary, it is straightforward toverify that equation (8) is equivalent to
Therefore, if either (1) holds, and thus  converges to
  or (2) holds and thus
 converges to
 we have that
 converges to
Acknowledgment
This work was funded by National Institute of Health grants R21ES019712 and R01ES020337
References
1. BreslowN. Covariance analysis of censored survival data. Biometrics1974; 30:89–99.10.2307/2529620Suche in Google Scholar
2. WacholderS.Binomial regression in GLIM: estimating risk ratios and risk differences. Am J Epidemiol1986; 123:174–84.10.1093/oxfordjournals.aje.a114212Suche in Google Scholar PubMed
3. LeeJ.Odds ratio or relative risk for cross-sectional data?Int J Epidemiol1994; 23:201–3.10.1093/ije/23.1.201Suche in Google Scholar PubMed
4. GreenlandS.Model-based estimation of relative risks and other epidemiologic measures in studies of common outcomes and in case-control studies. American J Epidemiol2004; 160:301–5.10.1093/aje/kwh221Suche in Google Scholar PubMed
5. SkovT, DeddensJ, PetersenM, EndahlL.Prevalence proportion ratios: estimation and hipothesis testing. Int J Epidemiol1998; 27:91–5.10.1093/ije/27.1.91Suche in Google Scholar PubMed
6. ChuH, ColeS.Estimation of risk ratios in cohort studies with common outcomes: a Bayesian approach. Epidemiology2010; 21:855.10.1097/EDE.0b013e3181f2012bSuche in Google Scholar PubMed
7. SpiegelmanD, HertzmarkE.Easy SAS calculations for risk or prevalence ratios and differences.Am J Epidemiol2005; 162:199–200.10.1093/aje/kwi188Suche in Google Scholar PubMed
8. ZouG.A modified Poisson regression approach to prospective studies with binary data. Am J Epidemiol2004; 159:702–6.10.1093/aje/kwh090Suche in Google Scholar PubMed
9. DeddensJ, PetersenM, LeiX. Estimation of prevalence ratios when PROC GENMOD does not converge. In: Proceedings of the 28th Annual SAS Users Group International Conference, 270-28. Available at: http://www2.sas.com/proceedings/sugi28/270-28.pdf, 2003.Suche in Google Scholar
10. PetersenM, DeddensJ. Re: easy SAS calculations for risk or prevalence ratios and differences. Am. J. Epidemiol. (15 June 2006) 163 (12): 1158–1159. doi: 10.1093/aje/kwj162. Available at: http://aje.oxfordjournals.org/content/163/12/1158.short.10.1093/aje/kwj162Suche in Google Scholar PubMed
11. TianL, LiuK.Estimating the relative risk in cohort studies and clinical trials of common outcomes (letter).Am J Epidemiol2006; 163:1157–63.Suche in Google Scholar
12. BickelP, KlaassenC, RitovJ, WellnerJ.Efficient and adaptive estimation for semiparametric models.New York: Springer, 1993.Suche in Google Scholar
13. WassermanL.All of nonparametric statistics.New York: Springer, 2003.Suche in Google Scholar
14. HastieTJ, TibshiraniR,FriedmanJ.The elements of statistical learning: data mining, inference, and prediction, 2nd ed.New York: Springer, 2008.Suche in Google Scholar
15. HiranoK, ImbensG, RidderG.Efficient estimation of average treatment effects using the estimated propensity score. Econometrica2003; 71:1161–89.10.1111/1468-0262.00442Suche in Google Scholar
16. RobinsJ, RotnitzkyA.Comment on the Bickel and Kwon article, “inference for semiparametric models: some questions and an answer”. Statist Sinica2001; 11:920–36.Suche in Google Scholar
17. LachinJ.Biostatistical methods: the assessment of relative risks. New York: John Wiley and Sons, 2000:75–7.10.1002/9780470317051Suche in Google Scholar
18. The Diabetes Control and Complications Trial Research Group. The effect of intensive treatment of diabetes on the development and progression of long-term complications in insulin-dependent diabetes mellitus. N Engl J Med1993; 329:977–86.10.1056/NEJM199309303291401Suche in Google Scholar PubMed
©2013 by Walter de Gruyter Berlin / Boston
Artikel in diesem Heft
- Masthead
- Masthead
- Research Articles
- Sensitivity Analysis for Causal Inference under Unmeasured Confounding and Measurement Error Problems
- Assessing the Causal Effect of Policies: An Example Using Stochastic Interventions
- Novel Point Estimation from a Semiparametric Ratio Estimator (SPRE): Long-Term Health Outcomes from Short-Term Linear Data, with Application to Weight Loss in Obesity
- Exact Nonparametric Confidence Bands for the Survivor Function
- Semiparametric Regression Analysis of Clustered Interval-Censored Failure Time Data with Informative Cluster Size
- A Weighting Analogue to Pair Matching in Propensity Score Analysis
- Alternative Monotonicity Assumptions for Improving Bounds on Natural Direct Effects
- Estimation of Risk Ratios in Cohort Studies with a Common Outcome: A Simple and Efficient Two-stage Approach
- Distance-Based Mapping of Disease Risk
- The Balanced Survivor Average Causal Effect
- Commentary
- Principal Stratification: A Broader Vision