Patterns of social media platforms co-use and social media addiction among secondary school students: findings from Thailand’s fifth national school students survey with latent class analysis
-
Jirawan Jayuphan


Abstract
Objectives
Adolescents generally use social media in groups of applications or platforms with a latent pattern. As neurobiological studies suggest that social media platforms stimulate the brain in diverse ways, we hypothesize that certain social media use patterns may be more prone to addiction than others. The objectives of this study are: 1) to describe patterns of social media platform co-use among school-going adolescents in Thailand, and; 2) to describe the extent to which social media co-use patterns are associated with social media addiction.
Methods
We conducted a nationally representative cross-sectional study among 23,659 secondary school students from 113 schools across Thailand between November 2020 and March 2021. We asked participants to self-report the social media applications and platforms that they had used in the past 12 months. We used latent class analysis (LCA) to identify social media usage patterns, and assessed the patterns’ association with social media addiction scores using multivariable linear regression.
Results
Among our participants, 86.1 % had used social media within the past 30 days. Facebook was the most commonly used platform, followed by YouTube and Line. We identified two distinct social media use patterns: 1) Common use of Line, Facebook, and YouTube (“Basic Combo”); 2) Basic Combo with other platforms such as Twitter, TikTok, and Instagram (“Basic Combo Plus”). The “Basic Combo Plus” pattern participants exhibited higher levels of withdrawal, persistence, and escapism in social media use compared to the “Basic Combo” pattern participants (all p-value < 0.05).
Conclusions
The number of social media platforms correlates with social media addiction level. However, limited generalizability, the lack of detail regarding social media use, and potential information bias should be considered as caveats in the interpretation of the study findings.
Introduction
Social media has become an integral part of daily life, particularly among adolescents. Adolescents generally do not use only one social media platform in isolation, but rather a group of applications or media with a latent pattern. Social media use is increasingly recognized as a multifaceted phenomenon, often occurring in patterns rather than isolated instances on single platforms [1]. In Thailand, secondary school students are highly engaged with social media, with the majority actively using various platforms such as Facebook, Instagram, TikTok, Twitter, and Line [2]. The widespread use of these platforms suggests that adolescents interact with social media in complex ways, forming habitual usage patterns that may contribute to their overall engagement and potential dependence.
Social media is addictive. Excessive use of social media has been linked to sleep disturbances [3], reduced academic performance [4], and increased symptoms of anxiety and depression among adolescents. But social media addiction occurs as a gradient in a population rather than a binary condition [5], and should be measured through a scoring system that reflects varying levels of engagement and dependency. Neurobiological studies showed that each social media platform has its unique features that can elicit varying neurobiological responses among users [6]. For example, TikTok’s algorithmic content delivery and Instagram’s engagement notifications can create a dopamine-driven feedback loops that reinforce compulsive behaviors [7]. Functional magnetic resonance imaging (fMRI) images showed that social media interactions were associated with brain activation patterns, particularly in regions related to reward processing and impulse control [8], [9], [10]. These findings support the hypothesis that certain types of social media may be more addictive than others, depending on their design, functionality, and user engagement mechanisms.
We hypothesize that certain types of social media may be more addictive than others. Research findings regarding this association may have implications for stakeholders in adolescent behavioral health. This study aims to describe the patterns of social media platform co-use and their association with social media addiction scores among secondary school students in Thailand. However, there is a notable scarcity of data regarding the specific patterns of co-use across multiple platforms and their correlation with addiction scores. The objectives of this study are: 1) to describe patterns in social media platform co-use among school-going adolescents in Thailand, and; 2) to describe the extent to which social media co-use patterns are associated with social media addiction.
Methods
Study design and setting
This study was a nationally-representative cross-sectional study titled the 5th National School Survey on Alcohol Consumption, Substance Use and Other Health Risk Behaviors (henceforward “the survey”). The aim of the survey was to provide information about the magnitude and trend of health risk behaviors among secondary school students in Thailand’s formal education system. The Survey was conducted from November 2020 to March 2021 at 113 schools in 21 (out of 77) provinces of Thailand and one district of Bangkok, the capital of Thailand.
Study participants and samples selection
The investigators used a spreadsheet-based random number generator to select the 21 study provinces from the 12 education regions (plus one district in the capital of Bangkok), then stratified the schools in each province by type and randomly selected the participant schools. The Survey participants were drawn from students in Year 7 (Matthayom1), Year 9 (Matthayom 3), and Year 11 (Matthayom 5) in the general education system and the vocational education system (Vocational Certificate Year 2) studying at the selected schools. The investigators then selected five schools per study province (1 public general education school in an urban area, one public general education school in a rural area, one private school in an urban area, one business vocational school, and one technical vocational school). There were few to no rural private schools. In schools that had more than five classrooms per year level, we would randomly select three classrooms from each year level. In smaller schools with fewer than five classrooms per year level, we collected data from students in all classrooms in each target year level.
Study variables
Exposure (social media use patterns): We asked students to self-report their history of social media usage, including the number of days and hours spent on social media in the past 30 days. Among those who had used social media in the past 30 days, we asked them to self-report the platforms that they used from a list that we developed based on the known types of social media used in Thailand, as well as open-source information. When we pilot-tested the questionnaire, we also asked the student participants for their suggestions and modified the list accordingly.
Outcome (social media addiction): We assessed social media addiction using the nine-item Social Media Disorder Scale [11]. The development of the questions followed established study protocols to ensure validity and reliability. Each item on the scale measures symptoms of problematic social media use, such as preoccupation, withdrawal, and difficulty controlling usage. The measurement questions were designed to capture the extent of social media addiction based on diagnostic criteria.
Characteristics of the study participants: We asked students to report their age, gender, class and school, religion, accommodation, living arrangements, GPA range, academic results, and allowance. These variables were measured to assess their potential influence on the study outcomes.
Data collection and data management
The investigators then contacted the school administrators to ask for permission to conduct the Survey. We asked for a list of the classrooms within the school and sampled the classrooms according to the above-mentioned sampling procedure. Our trained study enumerators then visited the sampled classrooms at a time arranged with the school administrators. The enumerators requested the teacher or other school staff with disciplinary authority to leave the classroom, introduced themselves to the students, provided information about the Survey, provided the students with the information sheet and the questionnaire, and asked the students for their verbal consent to participate in the study. The students then completed the questionnaires and placed the filled questionnaires in opaque envelopes. The enumerators then collected the envelopes and sent them to the data entry team, who performed data entry using the EpiData Entry software [12]. Participants who answered less than 70 percent of the questions in which skip patterns did not apply were considered to have submitted incomplete responses and were excluded from the analyses.
Data analyses
We analyzed the data using R software 4.4.1 [13]. Descriptive statistics were report with adjustment for sampling weight using Survey packages in R [14]. We classifies the student according to their social media used with Latent class analysis (LCA) [15]. The association between each variable and type of social media used were test with Chi square test. Linear regression were used to find the association between social media addiction score and type of social media used adjusted for age, sexual and gender minority status, academic performance (worse than previous year vs. the same or better), and prevalent depression based on a priori understanding regarding determinants of addiction behaviors as reported in the literature [16], [17], [18]. We did not collect data regarding the family income, parents’ education, or parents’ occupation, and the question on weekly stipend amount was deemed by the investigators to be unreliable, thus we did not include socioeconomic characteristic in our multivariable analyses.
Ethical considerations
We received Ethical Approval from the Human Research Ethics Committee of the Faculty of Medicine, Prince of Songkla University (approval number: REC.63-446-18-2). We also received a waiver of written informed consent from the Committee. The study participants were informed prior to giving verbal informed consent that all answers were optional and that the participants had the right to stop completing the questionnaire at any time without any consequence.
Results
A total of 24,143 students from 113 schools agreed to participate and placed their questionnaire in the collection envelope, and 23,659 participants (98.0 %) returned questionnaires that were deemed to be adequately complete and their responses were included in our analyses. We estimated that only 8.7 percent of Thai secondary school students had never used social media in their lifetime, and 86.1 percent had used social media within 30 days prior to answering our surveys (Table 1). The most commonly used social media platform was Facebook (95.2 %), followed closely by YouTube (94.0 %) and Line (88.6 %). Other platforms used by more than half of all current users included TikTok, Instagram and Twitter.
Characteristics of the study participants (n=23,659 students).
| Variable | Percent ± Standard Error, or Mean ± Standard Error |
| Age in years | 16.5 ± 0.3 |
| Gender | |
| Cis-gender, heterosexual, male | 32.2 % ± 2.0 % |
| Cis-gender, heterosexual, female | 34.9 % ± 1.5 % |
| Cis-gender, male, sexual minority | 2.7 % ± 0.4 % |
| Cis-gender, female, sexual minority | 9.0 % ± 0.4 % |
| Gender minority, assigned male at birth | 3.6 % ± 0.3 % |
| Gender minority, assigned female at birth | 7.8 % ± 0.6 % |
| Incomplete information | 9.6 % ± 1.2 % |
| Class and schoolb | |
| Matthayom 1 (Year 7) | 35.3 % ± 3.8 % |
| Matthayom 3 (Year 9) | 35.5 % ± 3.8 % |
| Matthayom 5 (Year 11) | 26.1 % ± 7.2 % |
| Vocational certificate 2 (Year 11) | 3.0 % ± 1.1 % |
| Religion | |
| Buddhism | 86.8 % ± 3.1 % |
| Islam | 9.4 % ± 3.2 % |
| Christianity | 2.6 % ± 0.8 % |
| Other | 0.8 % ± 0.1 % |
| Unknown | 0.5 % ± 0.1 % |
| Accommodation | |
| Family house/flat | 86.2 % ± 1.7 % |
| Dormitory | 2.9 % ± 1.0 % |
| Dormitory/rental house/non-family accommodation | 9.3 % ± 1.4 % |
| Others | 1.0 % ± 0.2 % |
| Unknown | 0.6 % ± 0.1 % |
| Stay with | |
| Stay alone | 1.5 % ± 0.2 % |
| Father and mother | 67.6 % ± 1.1 % |
| Father | 5.0 % ± 0.3 % |
| Mother | 12.8 % ± 0.7 % |
| Relatives | 22.0 % ± 1.2 % |
| Friend/Boyfriend/Girlfriend/others | 9.7 % ± 1.2 % |
| Grade point Average (GPA) rangeb | |
| 0.00 to 0.99 | 0.1 % ± 0.0 % |
| 1.00 to 1.99 | 3.5 % ± 0.3 % |
| 2.00 to 2.99 | 28.7 % ± 1.9 % |
| 3.00 to 4.00 | 67.7 % ± 1.9 % |
| Academic results in the current school year compared to the previous year | |
| Same as before | 14.7 % ± 0.9 % |
| Better than before | 50.1 % ± 1.9 % |
| Worse than before | 30.4 % ± 1.9 % |
| Refused to answer | 4.7 % ± 0.5 % |
| Allowance/week (Thai baht) | 478.6 (16.5) |
| Work to earn income, yes | 30.7 % ± 1.2 % |
| Prevalent moderate to severe depressive symptoms at the time of survey (patient health questionnaire/PHQ-2 instrument score 3 or higher) | |
| Social media use history | |
| Never used in lifetime | 8.7 % ± 0.8 % |
| Former users (used in lifetime but not in past 30 days) | 5.2 % ± 1.0 % |
| Current users (used in past 30 days) | 86.1 % ± 1.5 % |
| Social media used in past 30 days (in order from most common to least common) | (n=19,352 current users) |
| 95.2 % ± 0.4 % | |
| YouTube | 94.0 % ± 0.6 % |
| Line | 88.6 % ± 1.0 % |
| TikTok | 77.7 % ± 1.1 % |
| 72.6 % ± 1.9 % | |
| 56.7 % ± 1.2 % | |
| 40.5 % ± 2.1 % | |
| Pantip | 19.8 % ± 0.9 % |
| Bigo live | 9.4 % ± 0.6 % |
| VK/VKontakte | 5.1 % ± 0.5 % |
| MLive | 4.1 % ± 0.4 % |
| Others (Google Plus, Telegram, Tumblr, YouTube) | 36.6 % ± 1.2 % |
| History of social media disorder (among current users) (“yes”) | (n=19,352 current users) |
| Regularly cannot think of anything else but the moment that the participant will be able to use social media again | 18.2 % ± 0.6 % |
| Regularly felt dissatisfied because you wanted to spend more time on social media? | 19.7 % ± 0.8 % |
| Often felt bad when you could not use social media? | 28.9 % ± 1.0 % |
| Tried to spend less time on social media, but failed? | 32.3 % ± 1.3 % |
| Regularly neglected other activities (e.g. hobbies, sport) because you wanted to use social media? | 17.2 % ± 0.8 % |
| Regularly had arguments with others because of your social media use? | 17.2 % ± 0.9 % |
| Regularly lied to your parents or friends about the amount of time you spend on social media? | 11.4 % ± 0.6 % |
| Often used social media to escape from negative feelings? | 43.5 % ± 1.7 % |
| Had serious conflict with your parents, brother(s) or sister(s) because of your social media use? | 8.9 % ± 0.5 % |
-
aPercentages and standard errors (SE) are estimated based on sampling weights. bGrade level refers to the year of study in a 12-years school system, starting from Year one thru Year 12. The GPA, ranges from 0.00 to 4.00 points.
Although the latent class regression model with two classes did not have the best model fit (Table 2), the two-classes model could most clearly distinguish social media use patterns into: 1) less varied pattern with common use of Line, Facebook, YouTube and less common use of other media; 2) more varied pattern with common use of Line, Facebook, YouTube, Twitter, TikTok, and Instagram (Table 3). Considering that the two patterns had the first three platforms in common, we decided to name the first pattern “Basic Combo” and the second pattern “Basic Combo Plus”, and used these terms throughout the analyses.
Fit indices for the latent class regression model for social media behaviors.
| 2 classes | 3 classes | 4 classes | 5 classes | |
|---|---|---|---|---|
| AIC | 114,862.0 | 112,845.2 | 112,544.0 | 112,461.7 |
| BIC | 114,964.3 | 113,002.6 | 112,756.5 | 112,729.3 |
| Likelihood ratio/deviance statistic | 2,520.0 | 489.3 | 174.1 | 77.8 |
| Chi-square goodness of fit | 2,855.8 | 578.2 | 173.0 | 75.0 |
| Max.LL | −57,418.0 | −56,402.6 | −56,245.0 | −56,196.9 |
| Entropy | 2.99 | 2.92 | 2.91 | 2.90 |
-
AIC, akaike information criterion; BIC, bayesian information criterion; Max.LL, maximum log-likelihood.
Prevalence of social media use in past 30 days among participants in the two latent classes (weighted percent ± SE).
| Social Media | Class 1 (n=8,855) percent ± SE | Class 2 (n=10,497) percent ± SE |
| Line | 74.6 % ± 1.6 % | 99.1 % ± 0.1 % |
| 91.9 % ± 0.6 % | 97.8 % ± 0.4 % | |
| 15.0 % ± 1.7 % | 88.1 % ± 0.5 % | |
| YouTube | 87.1 % ± 1.2 % | 99.3 % ± 0.1 % |
| TikTok | 66.4 % ± 2.0 % | 86.2 % ± 1.1 % |
| 5.9 % ± 0.7 % | 66.6 % ± 1.6 % | |
| 39.2 % ± 2.0 % | 97.7 % ± 0.3 % | |
| Bigo live | 4.5 % ± 0.5 % | 13.1 % ± 0.9 % |
| MLive | 0.9 % ± 0.1 % | 6.5 % ± 0.6 % |
| VK/VKontakte | 1.4 % ± 0.3 % | 7.9 % ± 0.7 % |
| Pantip | 2.1 % ± 0.3 % | 33.0 % ± 0.9 % |
| Others (Google Plus, Telegram, Tumblr, YouTube) | 22.7 % ± 1.0 % | 47.0 % ± 1.2 % |
-
Class 1 = “Basic Combo” (Line, Facebook, YouTube). Class 2 = “Basic Combo Plus (Line, Facebook, YouTube, Twitter, TikTok, and Instagram)”
Students with the “Basic Combo” and “Basic Combo Plus” patterns had largely similar level of social media disorder. Differences were statistically significant for all items. Exceptions included withdrawal symptoms, persistence of disorder, and escapism via social media, all of which were more common among students with “Basic Combo Plus” pattern (Table 4 and Figure 1). The weighted mean social media disorder scores, however, were very similar to one another, particularly after adjusting for potential confounders (Table 5). The “Basic Combo Plus” pattern of social media use is associated with a higher risk of social media addiction, even after controlling for other influencing factors (age, sexual and gender minority status, academic performance and prevalent depression).
Self-reported prevalence of addictive behaviors according to the social media disorder scale.
| Behaviors according to social media disorder scale | “Basic Combo” class I (n=8,855) percent ± SE |
“Basic Combo Plus” class II (n=10,497) percent ± SE |
p-Value |
| Preoccupation: Regularly cannot think of anything else but the moment that the participant will be able to use social media again | 15.6 % ± 0.8 % | 20.1 % ± 0.6 % | <0.001 |
| Tolerance: Regularly felt dissatisfied because the participant wanted to spend more time on social media | 17.1 % ± 1.0 % | 21.6 % ± 0.7 % | <0.001 |
| Withdrawal: Often felt bad when the participant could not use social media | 21.9 % ± 1.1 % | 34.2 % ± 0.9 % | <0.001 |
| Persistence: Tried to spend less time on social media, but failed | 26.4 % ± 1.4 % | 38.4 % ± 1.3 % | <0.001 |
| Displacement: Regularly neglected other activities (e.g. hobbies, sport) because participant wanted to use social media | 14.7 % ± 0.9 % | 19.1 % ± 0.7 % | <0.001 |
| Problem: Regularly had arguments with others because of social media use | 13.7 % ± 1.1 % | 19.9 % ± 0.9 % | <0.001 |
| Deception: Regularly lied to parents or friends about the amount of time participant spend on social media | 10.0 % ± 0.7 % | 12.4 % ± 0.6 % | <0.001 |
| Escape: Often used social media to escape from negative feelings | 32.3 % ± 1.6 % | 51.8 % ± 1.7 % | <0.001 |
| Conflict: Had serious conflict with parents, brother(s) or sister(s) because of social media use | 7.6 % ± 0.5 % | 9.8 % ± 0.5 % | <0.001 |
-
Bold p-value denotes statistical significance at 95 % level of confidence.
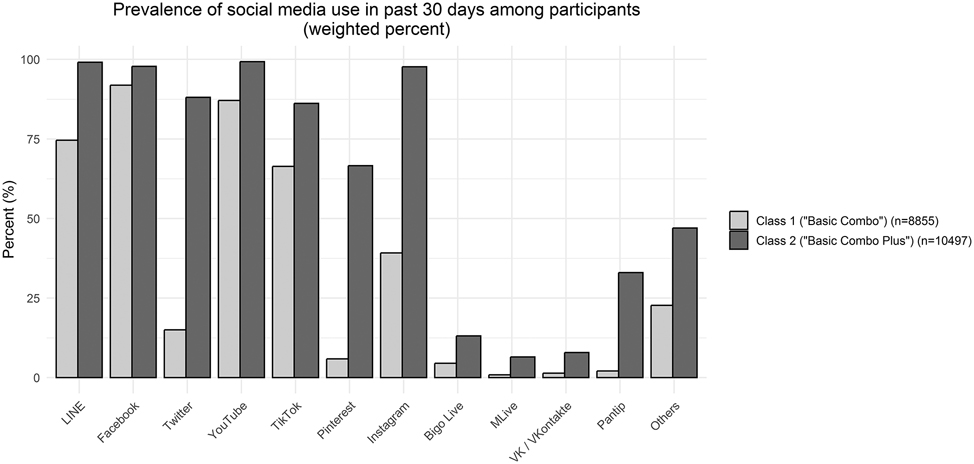
Prevalence of social media use in past 30 days among participants in the two latent classes (weighted percent).
Association between patterns of social media use and social media addiction score.
| Exposure (patterns of social media use)a | Outcome (social media addiction score, mean + SE) | Unadjusted beta (95 % CI) | Adjusted beta (95 % CI)b |
|---|---|---|---|
| “Basic Combo” class I (n=8855) | 1.6 ± 0.1 | Ref | Ref |
| “Basic Combo plus” class II (n=10497) | 2.3 ± 0.1 | 0.7 (0.6, 0.8) | 0.5 (0.4, 0.6) |
-
aBasic Combo refers to Line + Facebook + YouTube; Basic Combo Plus refers to Line + Facebook + YouTube + Twitter + TikTok + Instagram. bAdjusted for age, sexual and gender minority status, academic performance (worse than previous year vs. the same or better), and prevalent depression.
With regard to demographic characteristics, the only notable differences between students with “Basic Combo” and “Basic Combo Plus” patterns of social media use were with regard to sex and level of study (Supplementary Table 1). Students in the “Basic Combo” group were predominantly male, whereas students in the “Basic Combo Plus” group were predominantly female. The proportions of students in Matthayom 1, Matthayom 3, and Vocational Certificate Year two were relatively evenly distributed in the two groups, although the Basic Combo Plus group had higher proportion of students in Matthayom five.
Discussion
In this secondary data analysis, we described patterns of social media platform co-use among secondary school students in Thailand and compared their social media addiction scores. Two distinct groups emerged. The first group (“Basic Combo”) included slightly less than half of all participants who used three social media platforms (LINE, Facebook, YouTube), and the second group (“Basic Combo Plus”) included the other half who used the three platforms plus a combination of other platforms (e.g., TikTok, Instagram, Twitter). The “Basic Combo Plus” group were more likely to report withdrawal symptoms and escapism in the Social Media Disorder Scale, and had higher mean social media addiction score. These findings highlight the nuanced patterns of social media engagement and associated behaviors among Thai adolescents.
The main difference between the two patterns of social media use were in the use of Twitter, Instagram, Pinterest, and Pantip. Contrary to this study’s findings, a previous study found that single-platform users tends to be more intensive than multi-platforms users [19], 20]. The findings of this study thus contributed additional insights, and also may suggest a cohort effect regarding the intensity of social media use by number of platforms. With regard to our outcome measurement, previous studies on social media use disorder measured the disorder as a categorical variable [21], 22]. We decided to use the social media addiction score instead as we deemed that social media addiction likely presented itself on a gradient, which would be more appropriate when measured as a score. The difference should not undermine the ability of our findings to contribute to the literature.
We found that students who used a high number of platforms within the same month (i.e., the “Basic Combo Plus” group) had higher mean social media addiction score. The findings of our study support the hypothesis that the number of social media platforms used is positively correlated with the level of social media addiction. Evidence from prior research aligns with this conclusion [23], 24]. Specific content types on social media contribute to addiction symptoms [25], 26]. Thus, students in the “Basic Combo Plus” group might have been exposed to content not seen by students in the “Basic Combo” group. For example, highly engaging short-form videos (e.g., TikTok, Instagram Reels) may trigger compulsive scrolling behavior, while algorithm-driven personalized content (e.g., platform-generated recommendations) may reinforce prolonged usage [27], [28], [29]. Future studies could investigate whether exposure to particular types of content (e.g., viral trends, emotionally charged posts, or interactive features like infinite scrolling) is associated with higher social media addiction scores and whether certain platforms facilitate this exposure more than others. To test this hypothesis, further research could analyze user engagement data, self-reported addiction symptoms, and platform-specific content consumption patterns to determine causal relationships.
The primary strength of our study was the large sample size, which enabled a more accurate assessment of social media use among Thai secondary school students. The detailed analyses of use patterns and domain-specific symptoms of social media disorder also provide insights for relevant stakeholders. However, this study has several limitations that may affect the interpretation and generalizability of its findings. Firstly, the Survey was conducted in 2021, prior to the global rise of TikTok and other rapidly evolving platforms. In addition, the data collection period coincided with the COVID-19 pandemic, and the occasional school closures and online classes might have increased phone-based online activities among Thai adolescents [30]. The findings of the study may have limited generalizability to the pre-pandemic or post-pandemic contexts. Secondly, although we collected information on platform co-use, we did not collect information on which platform was predominant. The lack of information limited the scope of the insights provided by the findings. Thirdly, the reliance on self-reported data may introduce information bias to the study findings. The list of social media platforms that we provided was also not exhaustive. Students who used alternative platforms might not have a means to report their use in the Survey. Lastly, since the research focused exclusively on school-attending secondary school students in Thailand, its findings may not be generalizable to adolescents in other settings or circumstances.
Conclusions
We assessed the extent to which patterns of social media platform co-use was associated with social media addiction among secondary school students in Thailand. We found two distinct patterns of social media platforms co-use. Students in the group that used more platforms simultaneously had higher social media addiction scores. However, limitations regarding the generalizability of the study findings and potential information biases and incomplete information should be considered in the interpretation of the study findings.
Acknowledgments
The authors wish to thank all participants and school administrators for their valuable time. The authors also wish to thank all regional data collection teams and the data entry and data management staff for their dedicated efforts.
-
Research ethics: This study has received ethical approval from the Human Research Ethics Committee of the Faculty of Medicine, Prince of Songkla University (approval number: REC.63-446-18-2).
-
Informed consent: The investigators received a waiver of written informed consent and parental permission from the institutional review board. Verbal informed consent was obtained from the participants prior to data collection.
-
Author contributions: All authors have accepted responsibility for the entire content of this manuscript and approved its submission.
-
Use of Large Language Models, AI and Machine Learning Tools: None declared.
-
Conflict of interest: None declared.
-
Research funding: Funding for the Survey was provided by the Thai Health Promotion Foundation and the Center for Alcohol Studies (Award Number: 61-02029-0074, Recipient: Wit Wichaidit). The Thai Health Promotion Foundation had no role in study design, data collection and analysis, decision to publish, or preparation of the manuscript.
-
Data availability: The authors confirm that the data supporting the findings of this study are available within the article and its supplementary materials.
References
1. Alshalawi, AS. The influence of social media networks on learning performance and students’ perceptions of their use in education: a literature review. Contemp Educ Technol [Internet]. 2022;14. https://doi.org/10.30935/cedtech/12164.Search in Google Scholar
2. Promsri, C, Chaigusin, S, Tupmongkol, T. Social media usage behaviors: evidence of college students from a selected university in Thailand. Cross Current Int J Economics, Manag Media Stud [Internet]. 2019;1:108–13. https://doi.org/10.36344/ccijemms.2019.v01i05.002.Search in Google Scholar
3. Pirdehghan, A, Khezmeh, E, Panahi, S. Social media use and sleep disturbance among adolescents: a cross-sectional study. Iran J Psychiatr [Internet] 2021;16:137–45. https://doi.org/10.18502/ijps.v16i2.5814.Search in Google Scholar PubMed PubMed Central
4. World Health Organization. Teens, screens and mental health [Internet]; 2025. [cited 2025 Apr 8]. Available from: https://www.who.int/europe/news/item/25-09-2024-teens--screens-and-mental-health.Search in Google Scholar
5. Chalermchutidej, W, Manaboriboon, B, Sanpawitayakul, G, Theppiban, S, In-Iw, S. Sleep, social media use and mental health in female adolescents aged 12 to 18 years old during the COVID-19 pandemic. BMC Pediatr 2023;23:398. https://doi.org/10.1186/s12887-023-04218-4.Search in Google Scholar PubMed PubMed Central
6. Loh, K, Kanai, R. Individual differences in social media use are reflected in brain structure. In: 2013 AAAI Spring Symposium Series [Internet]; 2013. [cited 2024 Aug 13]. Available from: https://cdn.aaai.org/ocs/5729/5729-24522-1-PB.pdf.Search in Google Scholar
7. Alshamiri, A. TikTok impact on attention and memory. Holy Family University. [cited 2025 Apr 8]. Available from: https://www.holyfamily.edu/about/news-and-media/hfu-blog-network/tiktok-impact-attention-and-memory.Search in Google Scholar
8. Ferrarese, F. How digital media affects our dopamine levels [Internet]; 2025. [cited 2025 Oct 3]. Available from: https://www.federicoferrarese.co.uk/2025/01/01/digital-media-and-dopamine/.Search in Google Scholar
9. Dores, AR, Peixoto, M, Fernandes, C, Marques, A, Barbosa, F. The effects of social feedback through the “like” feature on brain activity: a systematic review. Health Care Internet. 2025;13:89. https://doi.org/10.3390/healthcare13010089.Search in Google Scholar PubMed PubMed Central
10. Costello, CR, McNiel, DE, Binder, RL. Adolescents and social media: privacy, brain development, and the law. J Am Acad Psychiatr Law. 2016;44.Search in Google Scholar
11. Eijnden, RJJMVD, Lemmens, JS, Valkenburg, PM. The social media disorder Scale: validity and psychometric properties. Comput Hum Behav [Internet]. 2016 [cited 2025 Apr 10];61:478–87. Available from: https://www.mendeley.com/catalogue/726c66ec-835b-3cbb-ad34-3eebab7e8c87/?utm_source=chatgpt.com.Search in Google Scholar
12. EpiData Association. EpiData entry [Internet]; 2008. Available from: https://www.epidata.dk.Search in Google Scholar
13. R Core Team. R: a language and environment for statistical computing [Internet]. Available from https://www.R-project.org/.Search in Google Scholar
14. Lumley, T. Survey: analysis of complex survey samples [Internet]; 2021. Available from https://CRAN.R-project.org/package=survey.Search in Google Scholar
15. Weller, BE, Bowen, NK, Faubert, SJ. Latent class analysis: a guide to best practice. J Black Psychol [Internet]. 2020;46:287–311. Available from: https://doi.org/10.1177/0095798420930932.Search in Google Scholar
16. Shanshal, SA, Al-Qazaz, HK, Saadallah, DA, Mohammed, SY, Saber, QANY, Ali, MM, et al.. Social media addiction and depression and their predictors among university students. Int J Adolesc Med Health 2024;36:123–32. https://doi.org/10.1515/ijamh-2022-0111.Search in Google Scholar PubMed
17. Ciacchini, R, Orrù, G, Cucurnia, E, Sabbatini, S, Scafuto, F, Lazzarelli, A, et al.. Social media in adolescents: a retrospective correlational study on addiction. Children (Basel) [Internet]. 2023;10:278. https://doi.org/10.3390/children10020278.Search in Google Scholar PubMed PubMed Central
18. Peris, M, de la Barrera, U, Schoeps, K, Montoya-Castilla, I. Psychological risk factors that predict social networking and internet addiction in adolescents. Int J Environ Res Public Health [Internet]. 2020;17:4598. https://doi.org/10.3390/ijerph17124598.Search in Google Scholar PubMed PubMed Central
19. Petrocchi, N, Asnaani, A, Martinez, AP, Nadkarni, A, Hofmann, SG. Differences between people who use only Facebook and those who use Facebook plus Twitter. Int J Hum Comput Interact [Internet]. 2015;31:157–65. https://doi.org/10.1080/10447318.2014.986640.Search in Google Scholar PubMed PubMed Central
20. Frey, T, Friemel, TN. Social media repertoires: investigating multifaceted social media use among late adolescents. J Quant Descr: Digit Med [Internet]. 2023;3:1–33. https://doi.org/10.51685/jqd.2023.002.Search in Google Scholar
21. Awad, E, Rogoza, R, Gerges, S, Obeid, S, Hallit, S. Association of social media use disorder and orthorexia nervosa among Lebanese university students: the indirect effect of loneliness and factor structure of the social media use disorder short form and the jong-gierveld loneliness scales. Psychol Rep [Internet]. 2024;127:1065–84. https://doi.org/10.1177/00332941221132985.Search in Google Scholar PubMed
22. Shannon, H, Bush, K, Villeneuve, PJ, Hellemans, KG, Guimond, S. Problematic social media use in adolescents and young adults: systematic review and meta-analysis. JMIR Ment Health [Internet]. 2022;9:e33450. https://doi.org/10.2196/33450.Search in Google Scholar PubMed PubMed Central
23. Côrte-Real, B, Cordeiro, C, Câmara Pestana, P, Duarte, E, Silva, I, Novais, F. Addictive potential of social media: a cross sectional study in Portugal. Acta Med Port 2023;36:162–6. https://doi.org/10.20344/amp.18470.Search in Google Scholar PubMed
24. Montag, C, Yang, H, Elhai, JD. On the psychology of TikTok use: a first glimpse from empirical findings. Front Public Health 2021;9:641673. https://doi.org/10.3389/fpubh.2021.641673.Search in Google Scholar PubMed PubMed Central
25. Amirthalingam, J, Khera, A. Understanding social media addiction: a deep dive. Cureus [Internet]. [cited 2025 May 14];16:e72499. https://doi.org/10.7759/cureus.72499. Available from: https://www.ncbi.nlm.nih.gov/pmc/articles/PMC11594359/.Search in Google Scholar PubMed PubMed Central
26. Amara, A, Omri, N, Limam, M, Bannour, R, Mellouli, M, Ghardallou, M, et al.. Video games and Facebook addiction among Tunisian adolescents: prevalence and associated factors. Int J Adolesc Med Health [Internet]. 2024 ;36:111–21. https://doi.org/10.1515/ijamh-2023-0171.Search in Google Scholar PubMed
27. Social media addiction accelerated by algorithms | TruLaw [internet]. 2024 [cited 2025 Apr 11]. Available from: https://trulaw.com/social-media-mental-health-lawsuit/social-media-addiction-accelerated-by-algorithms/.Search in Google Scholar
28. Mahmud, N, Yaakob, AMN, Abd Majid, NA, Nurulzlan, NA, Khairil, NH. The influence of TikTok marketing on consumer purchase intention among students. Int J Art Des (IJAD) [Internet]. 2024;8:48–56.10.24191/ijad.v8i2/SI.3014Search in Google Scholar
29. Pan, Y. Study on the influence of personalized algorithm of social media tiktok upon college students. Lect Notes in Educ Psychol Pub Med [Internet]. 2023;4:1185–96. https://doi.org/10.54254/2753-7048/4/2022860.Search in Google Scholar
30. Hasamoh, A, Srivirat, S, Wichaidit, W. Digital divide in online education during the COVID-19 pandemic and educational outcomes: findings from a community-based survey in Thailand’s impoverished deep south. ACSR 2025;12:1–13.Search in Google Scholar
Supplementary Material
This article contains supplementary material (https://doi.org/10.1515/ijamh-2025-0163).
© 2025 the author(s), published by De Gruyter, Berlin/Boston
This work is licensed under the Creative Commons Attribution 4.0 International License.