Nutritional status of adolescents undergoing tuberculosis treatment in urban Bangladesh: prevalence and determinants of malnutrition
-
Md Abdul Hasib Joarder
 ,
Pretom Saha
,
Shovon Chakraborty
,
Khadiza Akter
,
Sunny Amir
,
Md Rajat Chowdhury
,
Istiaque Mahmud Dowllah
,
Ummul Khair Alam
,
Aung Kya Jai Maug
,
Pretom Saha
,
Shovon Chakraborty
,
Khadiza Akter
,
Sunny Amir
,
Md Rajat Chowdhury
,
Istiaque Mahmud Dowllah
,
Ummul Khair Alam
,
Aung Kya Jai Maug


Abstract
Objectives
Tuberculosis is a global public health challenge, disproportionately affecting adolescents in low-and middle-income countries. Malnutrition worsens immune function, delays recovery and increases the risk of treatment failure in Tuberculosis patients. The objectives of this study was to assess the nutritional status of adolescents undergoing TB treatment in urban Bangladesh and identify the determinants of malnutrition.
Methods
A cross-sectional study was conducted from November 1, 2023, to May 31, 2024, among 339 adolescents receiving Tuberculosis treatment in five hospitals in Dhaka, Bangladesh. Nutritional status was primarily assessed by Patient-Generated Subjective Global Assessment (PG-SGA). Anthropometric data were collected to calculate BMI-for-age and height-for-age z-scores to verify nutritional status.
Results
The prevalence of severe malnutrition was 14.2 % and another 41.6 % were found moderately malnourished in PG-SGA. The z-scores also showed 14.2 % had severe malnutrition and 21.2 % had moderate malnutrition. The mean BMI was 17.89, with 59.3 % of participants underweight and 63.7 % experiencing some degree of stunting. Eating difficulties, particularly appetite loss, were reported by 45.4 % of adolescents. While 52.8 % received some nutrition-related information, only 1.8 % received comprehensive nutritional care. Logistic regression identified significant predictors of malnutrition, including female gender (AOR=0.51, p=0.01), presence of major comorbidities (AOR=3.67, p=0.01), eating difficulties (AOR=3.41, p<0.01), Type I Tuberculosis (AOR=2.57, p<0.01), and less than four meals (AOR=2.69, p=0.01).
Conclusions
Both PG-SGA and anthropometric indicators revealed significant nutritional deficits. Integrated nutritional support and management of comorbidities should be prioritized alongside Tuberculosis care to improve treatment outcomes.
Introduction
Tuberculosis (TB) is one of the top 10 causes of death worldwide and one of three lethal infectious diseases globally. Despite major global health efforts, TB continues to disproportionately affect low- and middle-income countries (LMICs) [1], 2]. In 2023, an estimated 10.8 million people infected with TB worldwide, including 6.0 million men, 3.6 million women and 1.3 million children [3]. Adolescents (10–19 years), as defined by the World Health Organization (WHO), are often overlooked in TB control programs, despite their increased vulnerability due to biological, social, and systemic factors [2], 3].
Bangladesh ranks among the top 10 countries with the highest TB burden, with an incidence rate of 221 per 100,000 population, thus adolescent face compounded risk [4]. Malnutrition is a known risk factor for poor consequence of TB, weakens immune function, increases susceptibility to infection, delays recovery and increases the risk of treatment failure [5], 6]. Research indicates that malnutrition accounts for around 25 % of all tuberculosis cases, and those with insufficient nutrition experience poorer treatment outcomes with increased mortality rates [7], 8].
Adolescence is a critical period of growth, requiring increased intake of energy, protein, and micronutrients [3]. In resource-limited settings like Bangladesh, food insecurity and poverty frequently lead to undernutrition, especially among adolescents from low-income families [9]. TB in adolescents further complicates this situation, with elevated nutritional demands and reduced intake make situation complex [10], 11]. Nutritional supplementation has demonstrated efficacy in enhancing clinical outcomes in tuberculosis patients, facilitating bacterial clearance, weight gain, and improved health condition [11], 12]. Dhaka is one of the most prevalent TB hub in the world with unplanned urbanization, socio-economic inequalities, and limited access to specialized care. Addressing malnutrition in adolescent tuberculosis patients is crucial for enhancing treatment results, decreasing mortality, and preventing treatment failures [7]. Moreover, around 30 % of adolescents in Bangladesh suffer from malnutrition with poverty, poor access to food, vitamins and minerals, and inadequate healthcare access made situation more challenging [9], 13].
Despite this clear link between TB and poor nutritional outcomes, data on the nutritional status of adolescents with TB in Bangladesh are scarce. Existing studies rarely focused on this age group or use validated clinical assessment tools. The Patient-Generated Subjective Global Assessment (PG-SGA) is a validated tool for evaluating malnutrition in clinical settings, combining patient-reported symptoms with clinician assessments [14]. However, its use in adolescent TB populations in Bangladesh has not been documented. Complementing PG-SGA with WHO recommended BMI-for-age and height-for-age z-scores offers a robust assessment of nutritional status.
This study aims to fill this gap by evaluating the nutritional status of adolescents undergoing TB treatment in Dhaka using PG-SGA and Z scores. The identification of key predictors of malnutrition will also help in integrated, adolescent-responsive TB care strategies.
Methodology
Study design and participants
This hospital-based cross-sectional study was conducted in Dhaka, Bangladesh, from November 1, 2023, to May 31, 2024. The study population included adolescents aged 10–19 years who were diagnosed with TB and receiving treatment at one of five tertiary care hospitals: Bangladesh Shishu Hospital, the National Institute of Diseases of the Chest and Hospital (NIDCH), the 250-bed TB and Chest Disease Hospital, Dhaka Medical College Hospital, and Bangabandhu Sheikh Mujib Medical University (BSMMU). Participants were selected using a convenience sampling technique. Adolescents with conditions that severely limited communication, those with critical illness requiring intensive care, or those with medical restrictions on food intake (e.g., due to metabolic or gastrointestinal disorders unrelated to TB) were excluded from the study [15], 16].
Sample size calculation
The minimum sample size was calculated using the single population proportion formula: n=Z2 × p(1−p)/d2. Assuming a prevalence (p) of malnutrition among adolescent TB patients at 36 % based on previous studies by Rahaman et al. [4], a 5 % margin of error (d), and 95 % confidence level (Z=1.96), the calculated minimum sample size was 354. Considering an estimated 5 % non-response rate, the final sample size required was 372. However, due to the time and resource constraints during the data collection period, 339 complete responses were analyzed.
Data collection
Sociodemographic and Clinical Data: Data were collected from 339 adolescent TB patients using a pre-tested, semi-structured questionnaire administered through face-to-face interviews. Information was gathered on sociodemographic characteristics, clinical history, dietary habits, meal frequency, functional status, and access to nutrition-related counseling during TB treatment. Additional information, including TB type and comorbidities, was extracted from medical records for verification [17].
Anthropometric Assessment: Anthropometric measurements were taken following the WHO recommended procedures. Height was measured to the nearest 0.1 cm using a height meter, with participants standing barefoot and maintaining appropriate posture [5], 18]. Weight was recorded to the nearest 0.1 kg using a calibrated digital scale, with participants wearing minimal clothing for accuracy [10], 19]. Body Mass Index (BMI) was calculated using the standard formula: weight (kg) divided by height (m2). To assess malnutrition, BMI-for-age and height-for-age z-scores (HAZ) were calculated using WHO growth standards for adolescents [5], 15], 20]. Based on WHO classification, BMI-for-age z-scores were categorized as follows: < −3 (severe malnutrition), −3 to −2 (moderate malnutrition), −2 to +1 (normal), +1 to +2 (overweight), and > +2 (obese). Height-for-age z-scores were classified to reflect chronic nutritional deficiency: < −3 (severe stunting), −3 to −2 (moderate stunting), −2 to −1 (mild stunting), and ≥ −1 (normal growth) [5], 10], 21].
Patient-Generated Section (PG-SGA Part I): The PG-SGA tool was used as the primary method for nutritional assessment, as it integrates patient-reported symptoms and clinician-observed physical signs [22]. The patient-reported section included information on recent unintentional weight changes, appetite disturbances, current food intake, and the presence of symptoms affecting food consumption, such as nausea, vomiting, or oral ulcers. Respondents also reported their daily functional capabilities and frequency of meals.
Clinician-Assessed Section (PG-SGA Part II): This included evaluation of physical signs of malnutrition such as muscle wasting, subcutaneous fat loss, presence of edema, and assessment of the patient’s overall clinical condition. Clinicians also considered disease-related metabolic stress, including fever, infection severity, and presence of other major illnesses. The cumulative PG-SGA score was then used to categorize nutritional status as well-nourished, moderately malnourished, or severely malnourished, and to determine the need and urgency for nutritional intervention [22].
Data analysis
Data were checked for completeness, consistency and entered into IBM SPSS Statistics version 23 for analysis [4]. Descriptive statistics were used to summarize the sociodemographic and other characteristics of the participants. The nutritional status of participants was assessed using both PG-SGA and z-scores, allowing for cross-validation of results. Chi-square tests were performed to identify associations between categorical variables and malnutrition status. Factors that showed significant associations in bivariate analyses were included in logistic regression model to identify independent predictors of malnutrition. Adjusted odds ratios (OR) with 95 % confidence intervals (CI) were calculated to assess the strength of associations, and a p-value of less than 0.05 was considered statistically significant.
Ethical considerations
Ethical approval for this study was obtained from the Institutional Review Board (IRB) of the National Institute of Preventive and Social Medicine (NIPSOM) [Memo No: NIPSOM/IRB/2023/06(a), dated 22 October 2023]. Informed consent was obtained from the parents or legal guardians of all adolescent participants. In addition, assent was obtained from the adolescents themselves to ensure voluntary and informed participation.
Results
This study included 339 adolescents aged 10–19 years (mean age: 15.71 ± 2.72), with nearly half (49.9 %) in the 17–19 age group. Females comprised 58.1 % of the sample, and 99.4 % of respondents identified as Muslim. Most participants resided in urban areas (63.4 %), were unmarried (88.2 %), and lived in nuclear families (88.2 %). Regarding education, 62.8 % had attained secondary education, and 74 % were currently enrolled in school. Fathers primarily had no formal (29.5 %) or secondary (28 %) education, while 32.2 % of mothers had completed secondary education. Most fathers were involved in business (35.7 %), and the majority of mothers were homemakers (84.7 %). The average monthly household income was BDT 25,772.86 ± 18,031.16, with 30.7 % earning between BDT 20,001 and 30,000. While 37.5 % of families reported having a smoker, only 2.9 % of respondents personally used tobacco (Table 1).
Socio-demographic status of the respondents (n=339).
| Name of the variables | Category | Frequency | Percent, % |
|---|---|---|---|
| Age (in years) | 10–13 | 84 | 24.8 % |
| 14–16 | 86 | 25.4 % | |
| 17–19 | 169 | 49.9 % | |
| Mean ± SD | 15.71 ± 2.72 | ||
| Sex | Male | 142 | 41.9 % |
| Female | 197 | 58.1 % | |
| Religion | Islam | 337 | 99.4 % |
| Hinduism | 2 | 0.6 % | |
| Place of residence | Village | 124 | 36.6 |
| City | 215 | 63.4 | |
| Marital status | Unmarried | 299 | 88.2 % |
| Married | 40 | 11.8 % | |
| Type of family | Nuclear | 299 | 88.2 % |
| Joint | 40 | 11.8 % | |
| Level of education of the respondent | No formal education | 6 | 1.8 % |
| Primary | 46 | 13.6 % | |
| Secondary | 213 | 62.8 % | |
| Higher secondary | 74 | 21.8 % | |
| Profession of the respondent | Don’t do anything | 48 | 14.2 % |
| Student | 251 | 74.0 % | |
| Job holder | 12 | 3.5 % | |
| Others | 28 | 8.3 % | |
| Father’s level of education | No formal education | 100 | 29.5 % |
| Primary education | 80 | 23.6 % | |
| Secondary education | 95 | 28.0 % | |
| Higher secondary education and higher | 16 | 4.7 % | |
| Mother’s level of education | No formal education | 94 | 27.7 % |
| Primary education | 78 | 23.0 % | |
| Secondary education | 109 | 32.2 % | |
| Higher secondary education and higher | 44 | 13.0 % | |
| Occupation of the father | Don’t do anything | 2 | 0.6 % |
| Laborer | 38 | 11.2 % | |
| Business | 121 | 35.7 % | |
| Farmer | 36 | 10.6 % | |
| Job holder | 36 | 10.6 % | |
| Others | 106 | 31.3 % | |
| Occupation of the mother | Homemaker | 287 | 84.7 % |
| Business | 4 | 1.2 % | |
| Laborer | 4 | 1.2 % | |
| Job holder | 16 | 4.7 % | |
| Others | 28 | 8.3 % | |
| Monthly family income | ≤10,000 | 60 | 17.7 % |
| 10,001–20,000 | 76 | 22.4 % | |
| 20,001–30,000 | 104 | 30.7 % | |
| >30,000 | 99 | 29.2 % | |
| Mean ± SD | 25,772.86 ± 18,031.16 | ||
| Source of drinking water | Tube well/Groundwater | 116 | 34.2 % |
| WASA/Pipeline | 223 | 65.8 % | |
| Type of toilet facilities | Non-sanitary latrine | 20 | 5.9 % |
| Sanitary latrine (pukka toilet) | 313 | 92.3 % | |
| Others | 6 | 1.8 % | |
| Presence of smoker in the family | Yes | 127 | 37.5 % |
| No | 212 | 62.5 % | |
| Tobacco consumption of the respondent | Yes | 10 | 2.9 % |
| No | 229 | 97.1 % | |
Eating difficulties during treatment were reported by 45.4 % of participants, with appetite loss being the most common (23.0 %), followed by nausea (5.9 %) and mouth ulcers (3.5 %). Some adolescents experienced multiple symptoms simultaneously, such as nausea with appetite loss (8.3 %) or a combination of nausea, ulcers, and appetite loss (1.8 %). Although 52.8 % received nutrition-related information during treatment, only 1.8 % reported receiving comprehensive nutritional care, indicating a major service gap. Most participants (94.1 %) maintained normal functional status, while 4.7 % required mobility assistance and 1.2 % were bedridden (Table 2).
Food and nutrition related variables (n=339).
| Name of the variables | Category | Frequency | Percent, % |
|---|---|---|---|
| Number of major meals consumed per day | Two | 29 | 8.6 % |
| Three | 270 | 79.6 % | |
| Four | 40 | 11.8 % | |
| Cereals | 1–2 times a week | 10 | 2.9 % |
| >3 times a week | 329 | 97.1 % | |
| Milk and milk products | Never | 14 | 4.1 % |
| 1–2 times a week | 174 | 51.3 % | |
| >3 times a week | 151 | 44.5 % | |
| Meat (chicken, beef, fish, others) | 1–2 times a week | 126 | 37.2 % |
| >3 times a week | 213 | 62.8 % | |
| Eggs | Never | 6 | 1.8 % |
| 1–2 times a week | 148 | 43.7 % | |
| >3 times a week | 185 | 54.6 % | |
| Sweets | Never | 152 | 44.8 % |
| 1–2 times a week | 169 | 49.9 % | |
| >3 times a week | 18 | 5.3 % | |
| Legumes (daal, beans, peas) | Never | 15 | 4.4 % |
| 1–2 times a week | 196 | 57.8 % | |
| >3 times a week | 128 | 37.8 % | |
| Fast foods | Never | 225 | 66.4 % |
| 1–2 times a week | 94 | 27.7 % | |
| >3 times a week | 20 | 5.9 % | |
| Eating problems faced | Yes | 154 | 45.4 % |
| No | 185 | 54.6 % | |
| Type of eating problems faced | Loss of appetite | 78 | 23.0 % |
| Mouth ulcer | 12 | 3.5 % | |
| Mouth ulcer + loss of appetite | 8 | 2.4 % | |
| Nausea | 20 | 5.9 % | |
| Nausea + loss of appetite | 28 | 8.3 % | |
| Nausea + loss of appetite + mouth ulcer | 6 | 1.8 % | |
| Nausea + mouth ulcer | 4 | 1.2 % | |
| Vomiting + loss of appetite | 6 | 1.8 % | |
| Nutrition information received during treatment | Yes | 179 | 52.8 % |
| No | 160 | 47.2 % | |
| Nutritional care and support received during treatment | Yes | 6 | 1.8 % |
| No | 333 | 98.2 % | |
| Daily functional status | Bed-ridden | 4 | 1.2 % |
| Can move with support | 16 | 4.7 % | |
| Active | 319 | 94.1 % |
The mean BMI was 17.89 ± 3.68. Based on BMI, 59.3 % of adolescents were underweight, 37.8 % had normal weight, and 2.9 % were overweight. According to PG-SGA scores, 14 % were severely malnourished, which was consistent with BMI-for-age z-scores identifying 14.2 % with severe malnutrition and 21.2 % with moderate malnutrition. Height-for-age z-scores (HAZ) revealed 6.5 % were severely stunted, 19.5 % moderately stunted, and 37.8 % mildly stunted (Figure 1).
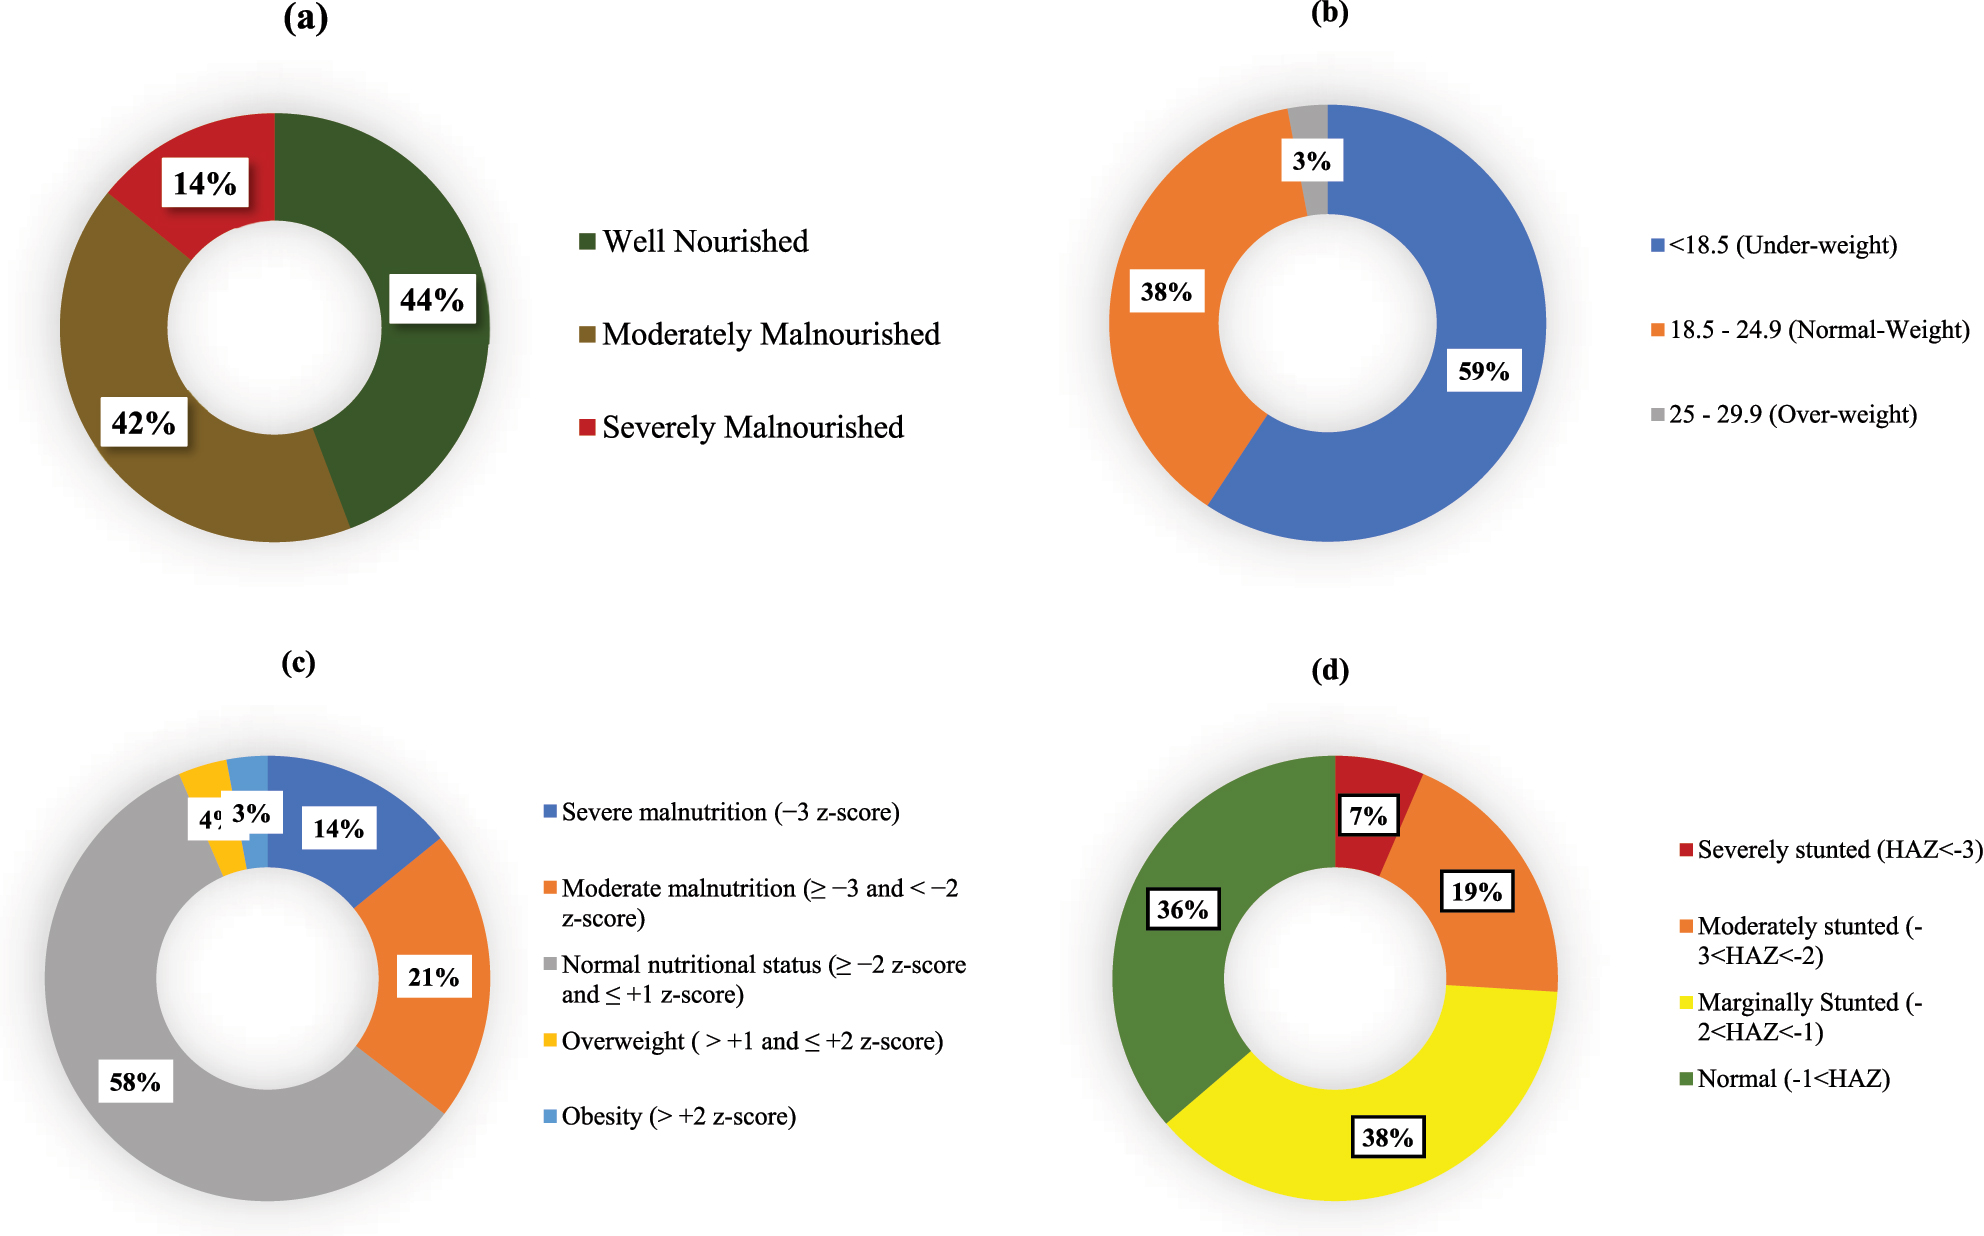
Status of nutritional status indicators: (a) PG-SGA category, (b) BMI (height/m2), (c) BMI-for-age: z-score (nutrition), (d) height-for-age: z-score (stunting).
We have identified a significant association between acquisition of nutritional information and good nutritional status, with a p-value of 0.001. Likewise, daily functional status significantly influenced nutritional outcomes (p-value=0.001). The daily meal consumption was another significant factor, exhibiting a p-value of 0.007. We identified a substantial correlation (p-value=0.000) between eating disorders and malnutrition, such as appetite loss or related concerns (Table 3). Table 4 presents the results of logistic regression analysis, where nutritional counseling demonstrated a protective trend against malnutrition (AOR=0.620, p=0.063), while not statistically significant. Males had a lower likelihood of malnutrition than females (AOR=0.514, p=0.009). Moreover, those who consumed three meals daily exhibited a significantly elevated risk of malnutrition compared to those who consumed four meals (AOR=2.692, p=0.009). Significant comorbidities (AOR=3.675, p=0.014) and eating disorders (AOR=3.409, p<0.001) were robust predictors of malnutrition. Individuals diagnosed with Type I tuberculosis demonstrated a markedly elevated risk of malnutrition (AOR=2.574, p<0.001), underscoring the necessity for focused nutritional interventions.
Factor associated with nutritional status (SGA category), Chi-square statistic.
| Factor | Sub category | SGA category, % | Chi-square | p-Value | |||
|---|---|---|---|---|---|---|---|
| Well-nourished | Moderately malnourished | Severely malnourished | Total | ||||
| Presence of smokers | No smoker | 47.6 | 41 | 11.3 | 212 | 4.735 | 0.094 |
| Smoker present | 38.6 | 42.5 | 18.9 | 127 | |||
| Nutrition information received | Received | 48 | 44.7 | 7.3 | 179 | 14.852 | 0.001a |
| Not received | 40 | 38.1 | 21.9 | 160 | |||
| Daily functional status | Normal | 44.5 | 42.9 | 12.5 | 319 | 27.494 | 0.001a |
| Limited | 50 | 25 | 25 | 16 | |||
| Severe | 0 | 0 | 100 | 4 | |||
| Sex of the respondent | Male | 52.1 | 38.7 | 9.2 | 142 | 8.219 | 0.016a |
| Female | 38.6 | 43.7 | 17.8 | 197 | |||
| Age (in years) | 10–13 | 54.8 | 33.3 | 11.9 | 84 | 7.054 | 0.113 |
| 14–16 | 44.2 | 38.4 | 17.4 | 86 | |||
| 17–19 | 39.1 | 47.3 | 13.6 | 169 | |||
| Number of meals consumed/day | Two | 69 | 20.7 | 10.3 | 29 | 14.112 | 0.007a |
| Three | 39.3 | 45.6 | 15.2 | 270 | |||
| Four | 60 | 30 | 10 | 40 | |||
| Place of residence | Village | 51.6 | 35.5 | 12.9 | 124 | 4.369 | 0.113 |
| City | 40 | 45.1 | 14.9 | 215 | |||
| Type of family | Nuclear | 55.5 | 56.8 | 18.3 | 229 | 3.988 | 0.136 |
| Joint | 57.5 | 27.5 | 15 | 40 | |||
| Source of drinking water | Tube well/groundwater | 50 | 34.5 | 15.5 | 116 | 3.692 | 0.158 |
| WASA/pipeline | 41.3 | 45.3 | 13.5 | 223 | |||
| Tobacco consumption | Yes | 40 | 40 | 20 | 10 | 0.297 | 0.862 |
| No | 44.4 | 41.6 | 14 | 329 | |||
| Faced eating problems | Yes | 32.5 | 49.4 | 18.2 | 154 | 16.158 | 0.000a |
| No | 54.1 | 35.1 | 10.8 | 185 | |||
| Received nutritional care and support | Yes | 33.3 | 66.7 | 0 | 6 | 1.953 | 0.377 |
| No | 44.4 | 41.1 | 14.4 | 333 | |||
| Type of tuberculosis | Type I | 37.1 | 44.8 | 18 | 194 | 11.19 | 0.004a |
| Type II | 53.8 | 37.2 | 9 | 145 | |||
| Tuberculosis treatment type | Category I | 44.5 | 41.2 | 14.2 | 337 | 2.825 | 0.244 |
| Category II | 0 | 100 | 0 | 2 | |||
| Presence of major comorbidity | Yes | 20.7 | 41.4 | 37.9 | 29 | 16.635 | 0.001a |
| No | 46.5 | 41.6 | 11.9 | 310 | |||
-
ap<0.05, statistical significance based on Chi-square analysis.
Key determinants of nutritional status in tuberculosis patients: a multinomial logistic regression analysis.
| Variable | Category | AOR (95 %CI) | p-Value |
|---|---|---|---|
| Nutritional counseling during tuberculosis treatment | No | 1 | 0.063 |
| Yes | 0.620(0.375–1.025) | ||
| Sex | Female | 0.009a | |
| Male | 0.514(0.312–0.847) | ||
| Functional status | Active | 1 | 0.755 |
| Inactive | 1.193(0.393–3.617) | ||
| Number of meals consumed (per day) | 4 times | 1 | |
| 3 times | 2.692 (1.283–5.650) | 0.009a | |
| 2 times | 0.432 (0.140–1.333) | 0.144 | |
| Comorbidity combined | Minor comorbidity | 1 | 0.014a |
| Major comorbidity | 3.675(1.299–10.40) | ||
| Eating problems faced | No | 1 | |
| Yes | 3.409(2.025–5.738) | 0.000a | |
| Type of tuberculosis | Type II | 1 | 0.000a |
| Type I | 2.574(1.556–4.258) |
-
ap<0.05, statistical significance based on logistics regression analysis.
Discussion
This study provides an assessment of the nutritional status of adolescents undergoing TB treatment in urban Bangladesh, revealing a high burden of malnutrition despite relatively favorable educational and urban living conditions. Using both the PG-SGA and z-scores, we observed close to similar findings, found about 14 % adolescents were severely malnourished and another 40 % were moderately malnourished according to PG-SGA. This high malnutrition prevalence highlighting risk on adolescents’ physical growth, immune function, and recovery of TB [23]. This is expected because, the previous studies in Bangladesh also showed a high prevalence of malnutrition among general people in Bangladesh [24]. Our result is particularly concerning, as the participants are mostly urban with relatively high rates of school enrollment and access to healthcare facilities, which indicating the limitation of current services to prevent undernutrition during TB care. Height-for-age z-scores (HAZ) revealed a high prevalence of stunting, with 6.5 % severely stunted, 19.5 % moderately stunted, and 37.8 % mildly stunted. Only 36.3 % had a normal height-for-age, also indicating widespread undernutrition [25]. These findings align with regional studies that report similar rates of stunting among Bangladeshi adolescents [26]. Stunting is often associated with childhood malnutrition, leading to impaired cognitive development, physical limitations, and long-term health risks [27].
A major concern identified was the gap between receiving nutritional information and accessing actual nutrition services. While over half of the adolescents received some form of dietary counseling, only 1.8 % received comprehensive nutrition support. This indicates a critical disconnect between education and service provision, consistent with findings from other adolescent health studies in Bangladesh, which report limited integration of nutrition into TB care pathways [28], 29]. Many health programs focus on general health education but fail to provide specialized services, such as dietary counseling and follow-up care. Islam et al. emphasize the need to integrate nutrition care into adolescent health services, especially in rural and underserved areas [29]. These indicates that, nutritional program should be effectively implemented in the TB care as there is an overall poor status.
Eating difficulties, especially appetite loss, were prevalent and strongly associated with malnutrition (OR=3.409, p<0.001). These symptoms create problem in nutrient intake during the treatment phase, indicating the need for early identification and management of nutrition-impact symptoms. The number of meals consumed per day was another key predictor, as adolescents consuming fewer than four meals daily had nearly three times the odds of being malnourished. These findings align with regional research emphasizing the protective role of meal frequency in adolescent nutrition [8]. Gender-based disparities in nutritional outcomes were also evident. Females were more likely to be moderately or severely malnourished than males, and logistic regression confirmed that being male was protective (AOR=0.514, p=0.01). This finding may reflect socio-cultural inequalities in intra-household food distribution, care-seeking behavior, and gendered health vulnerabilities documented in South Asian contexts [7], 18]. Comorbidities also identified as a strong determinant of malnutrition (AOR=3.675, p=0.01), as did the severity of TB patients with Type I TB were significantly more likely to be malnourished (OR=2.574, p<0.01). These associations support the understanding that both disease burden and physiological stress contribute to malnutrition, indicating the need for differentiated care models.
Dietary patterns revealed that 79.6 % of adolescents consumed three meals a day, which is typical for South Asia, particularly in urban settings [30]. Rural areas, in particular, tend to have lower meal frequencies due to lower incomes and agricultural work schedules [31]. Cereals were the most frequently consumed food group, with 97.1 % of participants eating them more than three times a week, reflecting the prevalence of rice and wheat-based foods in South Asian diets. These calorie-dense foods may vary in nutritional quality depending on preparation methods [32]. Dairy consumption was lower, with 44.5 % of participants consuming milk and dairy products more than three times a week, which is lower than consumption rates in regions where dairy is a more regular part of adolescent diets [33]. These highlights a significant gap in the provision of comprehensive nutrition services for adolescents, an issue that has been widely discussed in studies on adolescent healthcare in Bangladesh and South Asia [28].
Most adolescents (94.1 %) in this study maintained an active daily functional status, with only 4.7 % requiring mobility assistance and 1.2 % being bedridden. These results suggest that the majority of participants were in relatively good overall health, despite facing some nutritional challenges. The BMI distribution is concerning, with 59.3 % of adolescents categorized as underweight, 37.8 % normal weight, and only 2.9 % overweight or obese. In terms of education, 62.8 % of participants had attained secondary education, and 74 % were currently enrolled in school, aligning with national trends that show significant progress in adolescent education in Bangladesh. Secondary school enrollment rates have steadily increased in recent years, with 86 % of girls and 85 % of boys enrolled in urban areas [26]. Despite this progress, 29.5 % of participants reported that their fathers had no formal education, consistent with studies on rural and low-income urban families [27].
Limitations: This study has several limitations and first one is the study design. The cross-sectional nature of the study restricts causal inference. While significant associations between malnutrition and factors such as gender, comorbidities, meal frequency, and eating difficulties were identified, temporal relationships cannot be established. Second, the study was conducted only in urban tertiary hospitals in Dhaka, which may limit the generalizability of the findings to adolescents living in rural or hard-to-reach areas, where nutritional and healthcare access patterns is different. Although the use of the PG-SGA is a validated tool, it is partially reliant on self-reported measures, including weight change, dietary intake, and symptom recall, which are subject to recall bias and social desirability bias, particularly in adolescent populations. The use of convenience sampling introduces potential selection bias. Adolescents who were more health-conscious or who had caregivers available to accompany them to the hospital may have been more likely to participate. Despite these limitations, this study adds valuable evidence to the adolescent nutrition in the context of tuberculosis in LMICs and highlights gaps in service delivery, warrant urgent attention.
Conclusions
This study reveals a high burden of malnutrition among adolescents undergoing tuberculosis treatment, with over half classified as moderately or severely malnourished. The consistent findings from both PG-SGA and anthropometric assessments indicates the reliability of our findings. Service gaps were evident, particularly the low provision of comprehensive nutritional care despite widespread need. These findings highlight the urgent necessity of integrating routine nutritional screening and support into adolescent TB programs. Early identification of nutritional risk combined with dietary counseling, symptom management, and meal support, could substantially improve treatment outcomes. Special attention should also be directed toward TB patients with comorbid conditions. Strengthening multisectoral collaboration between TB, nutrition, and adolescent health services is essential for addressing the dual burden of disease and undernutrition in this high-risk population.
Acknowledgements
We would like to express our sincere gratitude to all participants, hospitals and healthcare staffs where study was conducted, and adolescents’ parents. We also acknowledge the support of the NIPSOM for facilitating data collection. Special thanks to colleagues who provided guidance during different stages of the research.
-
Research ethics: Eth cal approval for this study was i obtained from the Institutional Review Board (IRB) of the National Institute of Preventive and Social Medicine (NIPSOM) [Memo No: NIPSOM/IRB/2023/06(a), dated 22 October 2023].
-
Informed consent: Informed consent was obtained from the parents or legal guardians of all adolescent participants. In addition, assent was obtained from the adolescents themselves to ensure voluntary and informed participation.
-
Author contributions: Not added in this version. Want to add in the next version as we can finally determine it after whole review process.
-
Use of Large Language Models, AI and Machine Learning Tools: Not used for major task. Used language correction software.
-
Conflict of interest: Not applicable.
-
Research funding: Not applicable.
-
Data availability: Will be available upon reasonable request.
References
1. Gao, Z, Liu, Q, Deng, Q, Kong, L, Liu, Y. Growth and anemia among children with tuberculosis infection at different sites in Southwest China. Front Pediatrics 2023;11:1188704. https://doi.org/10.3389/fped.2023.1188704.Suche in Google Scholar PubMed PubMed Central
2. Snow, KJ, Nelson, LJ, Sismanidis, C, Sawyer, SM, Graham, SM. Incidence and prevalence of bacteriologically confirmed pulmonary tuberculosis among adolescents and young adults: a systematic review. Epidemiol Infect 2018;146:946–53. https://doi.org/10.1017/s0950268818000821.Suche in Google Scholar PubMed PubMed Central
3. Kurshed, AAM, Rana, MM, Khan, S, Azad, TA, Begum, J, Bhuyan, MAH. Dietary intake, physical activities and nutritional status of adolescent girls in an urban population of Bangladesh. Ibrahim Med Coll J 2010;4:78–82. https://doi.org/10.3329/imcj.v4i2.6502.Suche in Google Scholar
4. Rahaman, MFU, Shefa, J, Mandal, MK, Alam, MR. Nutritional status of patients with tuberculosis attending at tertiary medical center in Bangladesh. Bangladesh J Med 2019;30:53–7.10.3329/bjmed.v30i2.41530Suche in Google Scholar
5. Jaganath, D, Mupere, E. Childhood tuberculosis and malnutrition. J Infect Dis 2012;206:1809–15. https://doi.org/10.1093/infdis/jis608.Suche in Google Scholar PubMed PubMed Central
6. Gupta, KB, Gupta, R, Atreja, A, Verma, M, Vishvkarma, S. Tuberculosis and nutrition. Lung India 2009;26:9–16. https://doi.org/10.4103/0970-2113.45198.Suche in Google Scholar PubMed PubMed Central
7. Shukla, A, Pandey, S, Singh, S. Nutritional status of pulmonary tuberculosis patients: a hospital-based cross-sectional study. Indian J Commun Fam Med 2019;5:134–40.10.4103/IJCFM.IJCFM_39_19Suche in Google Scholar
8. Musuenge, BB, Poda, GG, Chen, P-C. Nutritional status of patients with tuberculosis and associated factors in the health centre region of Burkina Faso. Nutrients 2020;12:2540. https://doi.org/10.3390/nu12092540.Suche in Google Scholar PubMed PubMed Central
9. Kamruzzaman, M, Rahman, SA, Akter, S, Shushmita, H, Ali, MY, Billah, MA, et al.. The anthropometric assessment of body composition and nutritional status in children aged 2–15 years: a cross-sectional study from three districts in Bangladesh. PLoS One 2021;16:e0257055. https://doi.org/10.1371/journal.pone.0257055.Suche in Google Scholar PubMed PubMed Central
10. Snow, KJ. Understanding the epidemiology of tuberculosis in adolescence. Melbourne: University of Melbourne; 2019.Suche in Google Scholar
11. Tebandite, KE, Muyobela, KV, Lusamaki, MF, Mande, BG, Mopepe, GJ, Falay, SD, et al.. Effect of TB therapy on the health and nutritional status of infants aged 6 months to 5 years diagnosed with latent TB. J Tubercul Res 2018;6:239–50. https://doi.org/10.4236/jtr.2018.64022.Suche in Google Scholar
12. Gurung, LM, Bhatt, LD, Karmacharya, I, Yadav, DK. Dietary practice and nutritional status of tuberculosis patients in Pokhara: a cross sectional study. Front Nutr 2018;5:63. https://doi.org/10.3389/fnut.2018.00063.Suche in Google Scholar PubMed PubMed Central
13. Ali, Z. Resilient and healthy food systems in low-income settings. London: London School of Hygiene & Tropical Medicine; 2023.Suche in Google Scholar
14. Lindström, R, Orrevall, Y, Belqaid, K, McGreevy, J, Ottenblad, A, Rothenberg, E, et al.. Swedish translation and cultural adaptation of the scored patient‐generated subjective global assessment (PG‐SGA©) – a validated tool for screening and assessing malnutrition in clinical practice and research. Scand J Caring Sci, 2024. https://doi.org/10.1111/scs.13267.Suche in Google Scholar PubMed
15. De Onis, M, Onyango, A, Borghi, E, Siyam, A, Blössner, M, Lutter, C. Worldwide implementation of the WHO child growth standards. Public Health Nutr 2012;15:1603–10. https://doi.org/10.1017/s136898001200105x.Suche in Google Scholar PubMed
16. Atkins, S, Heimo, L, Carter, D, Ribas Closa, M, Vanleeuw, L, Chenciner, L, et al.. The socioeconomic impact of tuberculosis on children and adolescents: a scoping review and conceptual framework. BMC Public Health 2022;22:2153. https://doi.org/10.1186/s12889-022-14579-7.Suche in Google Scholar PubMed PubMed Central
17. Turck, D, Michaelsen, KF, Shamir, R, Braegger, C, Campoy, C, Colomb, V, et al.. World health organization 2006 child growth standards and 2007 growth reference charts: a discussion paper by the committee on nutrition of the European society for pediatric gastroenterology, hepatology, and nutrition. J Pediatr Gastroenterol Nutr 2013;57:258–64. https://doi.org/10.1097/mpg.0b013e318298003f.Suche in Google Scholar PubMed
18. Mushtaq, MU, Gull, S, Mushtaq, K, Abdullah, HM, Khurshid, U, Shahid, U, et al.. Height, weight and BMI percentiles and nutritional status relative to the international growth references among Pakistani school-aged children. BMC Pediatr 2012;12:1–12. https://doi.org/10.1186/1471-2431-12-31.Suche in Google Scholar PubMed PubMed Central
19. Rampersaud, GC, Pereira, MA, Girard, BL, Adams, J, Metzl, JD. Breakfast habits, nutritional status, body weight, and academic performance in children and adolescents. J Am Diet Assoc 2005;105:743–60. https://doi.org/10.1016/j.jada.2005.02.007.Suche in Google Scholar PubMed
20. Bailey, K, Ferro-Luzzi, A. Use of body mass index of adults in assessing individual and community nutritional status. Bull World Health Organ 1995;73:673.Suche in Google Scholar
21. Haile, D, Nigatu, D, Gashaw, K, Demelash, H. Height for age z score and cognitive function are associated with academic performance among school children aged 8–11 years old. Arch Public Health 2016;74:1–7. https://doi.org/10.1186/s13690-016-0129-9.Suche in Google Scholar PubMed PubMed Central
22. Isenring, E., J. Bauer, and S. Capra, The scored patient-generated subjective global assessment (PG-SGA) and its association with quality of life in ambulatory patients receiving radiotherapy. European J clin Nutr 2003;57:305–309. https://doi.org/10.1038/sj.ejcn.1601552.Suche in Google Scholar PubMed
23. Tallon, JM, Silva, AJ, Costa, AM, Barros, A. Obesity in adolescence–from etiological variability to interventional efficacy in the school context. Biom Biostat Int J 2020;9:22–6. https://doi.org/10.15406/bbij.2020.09.00296.Suche in Google Scholar
24. Islam, KN, Sultana, S, Rahman, F, Rahman, A. Exploring the impact of child underweight status on common childhood illnesses among children under five years in Bangladesh along with spatial analysis. PLoS One 2024;19:e0311183. https://doi.org/10.1371/journal.pone.0311183.Suche in Google Scholar PubMed PubMed Central
25. Clark, H, Coll-Seck, AM, Banerjee, A, Peterson, S, Dalglish, SL, Ameratunga, S, et al.. A future for the world’s children? A WHO–UNICEF–Lancet commission. Lancet 2020;395:605–58. https://doi.org/10.1016/s0140-6736-19-32540-1.Suche in Google Scholar
26. Ferdous, MZ, Islam, MS, Kundu, LR, Islam, US, Banik, R, Pardhan, S. Patterns of eating behaviors, physical activity, and lifestyle modifications among Bangladeshi adolescents during the COVID-19 pandemic. PLoS One 2024;19:e0302571. https://doi.org/10.1371/journal.pone.0302571.Suche in Google Scholar PubMed PubMed Central
27. Haque, MM, Zim, AFMIU, Aziz, MA, Ahmed, MI, Hossain, MA. Nutritional status of adolescent boys and girls at Hatiya Island in Bangladesh. Bangladesh J Vet Animal Sci 2018;6.Suche in Google Scholar
28. Shahjalal, M, Sultana, M, Gow, J, Hoque, ME, Mistry, SK, Hossain, A, et al.. Assessing health-related quality of life among cancer survivors during systemic and radiation therapy in Bangladesh: a cancer-specific exploration. BMC Cancer 2023;23:1208. https://doi.org/10.1186/s12885-023-11670-z.Suche in Google Scholar PubMed PubMed Central
29. Fariha, TNF, Banu, AB. Intersecting identities, gender and health: a mapping of adolescent health challenges in Bangladesh. J Asiat Soc Bangladesh Humanities 2024;69:33–65. https://doi.org/10.3329/jasbh.v69i1.74462.Suche in Google Scholar
30. Islam, MR, Rahman, SM, Tarafder, C, Rahman, MM, Rahman, A, Ekström, EC. Exploring rural adolescents’ dietary diversity, ultra-processed food consumption, and relevant socio-economic correlates: a cross-sectional study from Matlab, Bangladesh. Nutrients 2020;12:2230–47. https://doi.org/10.3390/nu12082230.Suche in Google Scholar PubMed PubMed Central
31. Hoque, MM, How has child labour been normalised in Bangladesh? A critical analysis of policies, factors, views, and evidence. 2024.Suche in Google Scholar
32. Misra, A, Khurana, L, Isharwal, S, Bhardwaj, S. South Asian diets and insulin resistance. Br J Nutr 2008;101:465–473.10.1017/S0007114508073649Suche in Google Scholar PubMed
33. Kearney, J. Food consumption trends and drivers. Phil Trans Biol Sci 2010;365:2793–807. https://doi.org/10.1098/rstb.2010.0149.Suche in Google Scholar PubMed PubMed Central
© 2025 the author(s), published by De Gruyter, Berlin/Boston
This work is licensed under the Creative Commons Attribution 4.0 International License.