Evaluating tablet-based cognitive testing in underwater environments: a case study with two divers
-
Naoto Yoshimura
 und
Kohske Takahashi
und
Kohske Takahashi


Abstract
Operating various devices is a critical skill for scuba divers. With recent technological advances, the demands and complexity of underwater device operation have increased, highlighting the importance of investigating human-device interactions on perception and movement. Recently, the waterproof tablet has enabled underwater human research. However, the potential applications and limitations of the waterproof tablet for underwater research have not been thoroughly examined. This case study, involving two divers, examined the feasibility and limitations of using the waterproof tablet to conduct cognitive tasks in underwater environments, focusing on methodological and practical challenges. Two divers performed a visual search task and a gradual-onset continuous performance task (grad-CPT) in both land-based and underwater conditions (at a depth of 6 m), and their performance was compared across environments. The results suggested that the waterproof tablet is a viable tool for conducting cognitive tasks underwater, as task performance resembled typical laboratory results. However, several issues were identified, including limitations in stimulus presentation and concerns regarding the reliability of touch responses. Our case study provides foundational data for designing future tablet-based experiments in underwater and other extreme environments.
1 Introduction
The proliferation of digital devices driven by recent technological advancements has extended to scuba diving. The ability to use wearable devices, smartphones, and tablets underwater has enabled various activities, including new AR experiences and safety management through the monitoring of physiological responses. 1 , 2 This interactive waterproof technology increasingly requires divers to manage new interactions. Yet, there has been little research on how these human-underwater device interactions impact perception and action in underwater environments. Therefore, investigating such interactions is essential for advancing applications ranging from fundamental human studies to the design of human-computer interaction technologies.
Numerous studies have been conducted to measure human cognitive function in various environments. For example, prior studies have reported effects of environmental context on memory performance. 3 , 4 In addition, this focus on the environment aligns with a broader body of field research investigating cognitive performance under other challenging conditions, such as high or low temperatures and low-oxygen environments. 5 However, such research has often focused on a limited range of cognitive functions due to high implementation costs and measurement constraints. Recent advances in Mobile Brain/Body Imaging and online experimental platforms have helped overcome these limitations by enabling the collection of biological and behavioral data outside laboratory settings. 6 , 7 , 8 , 9 , 10 , 11 , 12 , 13 These technological developments have led to an increase in research using reliable and valid measurements across a wider range of environments, including extreme conditions that were previously difficult to study.
The underwater environment has been the subject of much cognitive research due to the significant changes to the human body caused by its various physical properties. For example, hand motor performance, such as reciprocal tapping, has been found to decline in underwater settings. 14 , 15 Moreover, immersion in water has been shown to impair executive functions, especially sustained attention, response inhibition, and working memory. 16 , 17 , 18 , 19 , 20 Another critical factor in underwater environments is the use of breathing gas. During diving, air is supplied through a breathing apparatus. However, changes in the partial pressure of breathing gases due to water depth can lead to physiological and cognitive risks, including nitrogen narcosis and sensory or neurological impairments caused by decompression sickness. Studies have shown that breathing gases at depths of 10 m or more can impair cognitive performance, as supported by longer reaction times, poorer judgment, increased memory errors, and excited mood states. 19 , 21 , 22 Because work performance underwater is directly related to diver safety, many studies have investigated the cognitive consequences of these physical and physiological changes. However, factors such as water depth and task complexity pose several methodological challenges, making the findings of previous studies difficult to interpret consistently and highlighting the need to establish reliable devices, procedures, stimulus presentation methods, and measurement techniques for underwater experiments.
Among the primary challenges are the significant costs of establishing suitable research environments and the absence of standardized procedures. Conducting underwater experiments often requires specialized settings such as diving pools, open-water environments, or high-pressure chambers. 19 , 21 , 23 In addition, because experiments in underwater environments must be designed with continuous water exposure in mind, researchers have adopted a variety of approaches to stimulus presentation, response recording, and equipment setup. For instance, analog methods using stylus-based tools, such as pencils and waterproof paper or darts and plastic sheets, have been employed to assess response accuracy through manual markings and to record reaction times with waterproof stopwatches. 14 , 15 , 24 In other cases, auditory presentation has been used. Godden and Baddeley 4 , 25 utilized a communication system between researchers on land and divers underwater to deliver memory task instructions and to record verbal responses. Recently, Dalecki et al. 16 , 18 , 26 constructed a metal frame structure in a diving pool and investigated cognitive functions underwater using displays and input devices capable of electronically measuring reaction times. Although these approaches have enabled researchers to overcome the technical demands of the underwater environment, most have relied on custom-built devices. Thus, previous research has often relied on non-standardized methods, which lacked systematic evaluation from a Human-Computer Interaction (HCI) perspective, particularly regarding applicability. As a result, standardized and practical methods for measuring cognitive function remain undeveloped.
The purpose of this case study is to evaluate the feasibility and limitations of using the waterproof tablet for underwater cognitive experiments. The waterproof tablet is an effective tool for measuring human cognition underwater due to its convenience and ability to administer programmed tasks with laboratory-level precision, leading to its recent adoption in the field. 19 However, its practical feasibility and limitations as a research tool have not been systematically evaluated. Therefore, we evaluated the methodological practicality and limitations of this approach to provide foundational clues for future research. Specifically, as a first step in exploring which cognitive paradigms are suitable for this unique environment, we examined whether tasks designed to assess attention relevant to underwater activities could be reliably implemented underwater. Two divers completed both a visual search task and a sustained attention task using the waterproof tablet. The visual search task was selected as a task to assess spatial attention required for activities like monitoring dive gauges. The gradual-onset continuous performance task (grad-CPT) was chosen to examine changes in sustained attention during task performance underwater. We evaluated underwater task performance (wet condition), including correct response rates and reaction times, by comparing it to performance under land-based (dry) conditions. We also carefully observed potential sources of distortion during the experiments and addressed them in the discussion.
2 Methods
2.1 Participants
Two male participants, both certified recreational divers (Open Water or equivalent certification from PADI or NAUI), took part in this study. Both participants were healthy adults with no reported neurological, psychiatric, or physical conditions that could affect task performance. The study was conducted in accordance with the ethical standards outlined by the Ethical Review Committee of Ritsumeikan University, and informed consent was obtained from all participants prior to their participation.
2.2 Experimental environment
The experiment was conducted under two environmental conditions. The dry condition took place in a room at Ritsumeikan University (Osaka, Japan). The wet condition was conducted in a commercial indoor diving pool facility with a maximum depth of 8 m (https://marinejp.com).
2.3 Apparatus
Stimuli were presented and task sequences were controlled using a water-resistant tablet (Valtamer Alltab; see Figure 1A), which houses a Samsung Galaxy Tab S6 (SM-T886; 10.5 inches, 2,560 × 1,600 pixels, 60 Hz). Both tasks were programmed and executed using the Unity engine (Version 2022.3.2f1, 2D configuration).
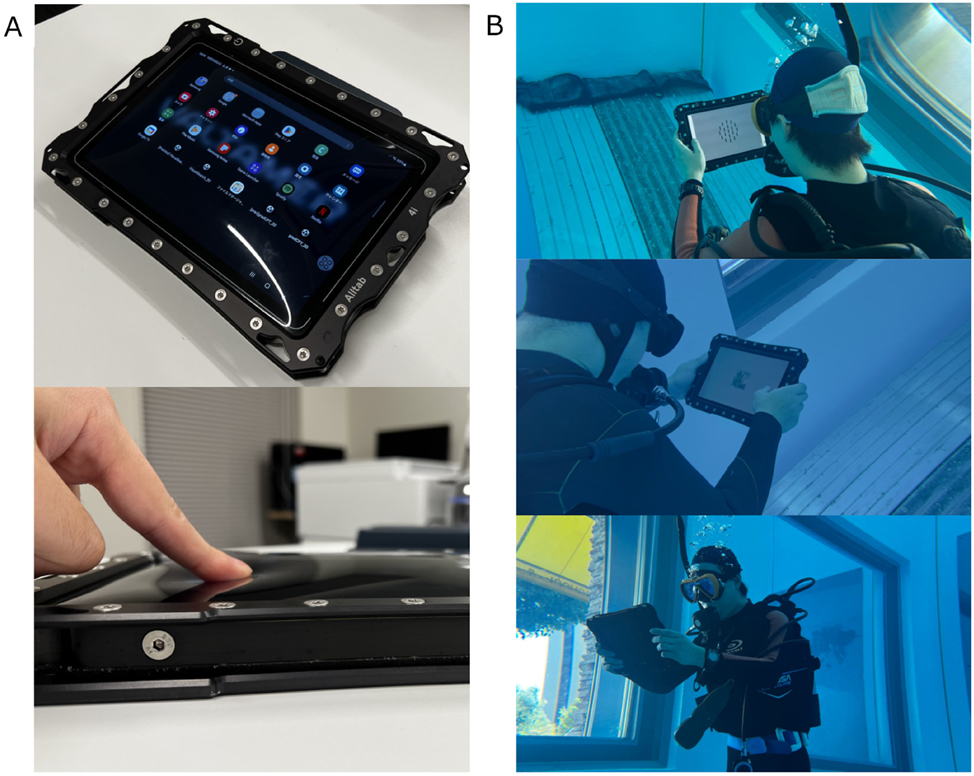
The experimental device and underwater task execution. (A) The water-resistant tablet used in the experiment. The screen is covered with a flexible waterproof membrane to allow touchscreen operation. (B) Participants performing the cognitive tasks underwater at a depth of 6 m.
2.4 Procedure
Two experimental tasks related to attention were used in this study: a visual search task and a grad-CPT. Participants performed each task under laboratory (dry) and underwater (wet) conditions at a depth of 6 m (Figure 1B). The order of the environmental conditions was counterbalanced across participants. Under wet conditions, participants received task instructions on land (i.e., poolside), then dived to practice and complete the task underwater. Participants also surfaced between the two tasks to rest on land.
2.5 Visual search task
The visual search task was adapted from previous studies 27 , 28 and modified to assess visual attention under underwater conditions. Each search array consisted of dark grey bars (32 × 128 pixels) displayed on a grey background (Figure 2). The bars were arranged in either two or three concentric circles with radii of 160, 320, and 480 pixels. Unlike in previous studies, the stimulus size was increased compared to that used in previous studies to improve visibility in underwater conditions. Additionally, the concentric circles were always centered on the screen. This modification was made due to the limited screen size and the difficulty of maintaining a fixed viewing distance underwater.
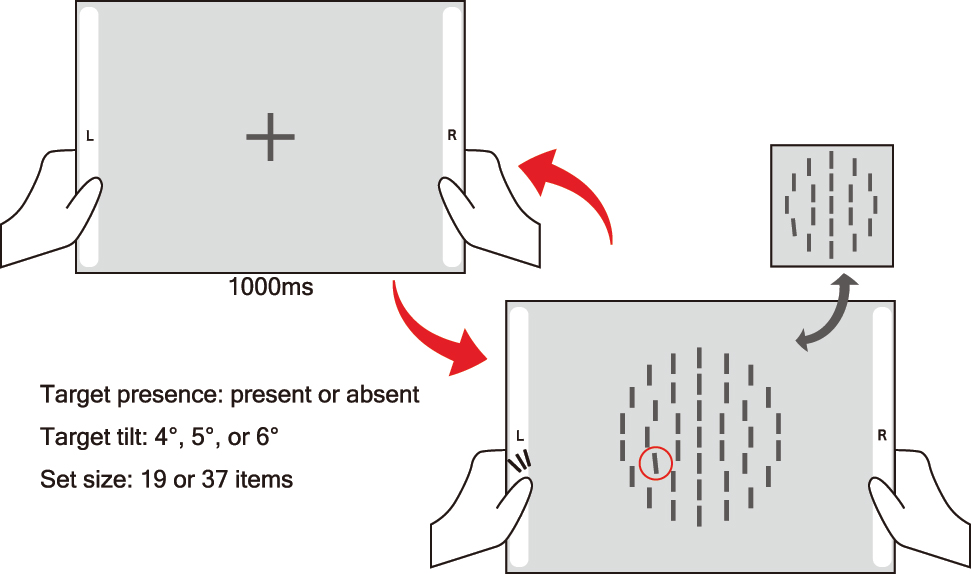
Task sequence of the visual search task. Participants tapped virtual buttons on either side of the screen to indicate the presence or absence of a tilted bar arranged in concentric circles.
A central fixation cross was presented for 1,000 ms, followed by the search display. Participants were instructed to determine as quickly as possible whether a tilted bar was present in the array, and to respond by tapping a large virtual button located on either the left or right side of the screen. Response side assignment was counterbalanced across participants. The task included a set size manipulation, with arrays consisting of either 19 or 37 bars. These set sizes were implemented by arranging the items in two or three concentric circles, respectively. Additionally, the tilt angle of the target bar was set to 4°, 5°, or 6° to manipulate the difficulty of the search. This resulted in a 2 (set size: 19 or 37) × 2 (target presence: present or absent) × 3 (tilt angle: 4°, 5°, 6°) within-subjects design, yielding 12 unique conditions. Participants first completed 12 practice trials, followed by 120 experimental trials (10 repetitions of each condition). A break was provided after 60 trials.
2.6 Gradual-onset continuous performance task
This task was adapted from Yamauchi et al. 29 and based on the grad-CPT framework proposed by Rosenberg et al. 30 Twenty grayscale landscape images (256 × 256 pixels) were used, comprising 10 mountain scenes (targets) and 10 city scenes (nontargets). All images were presented at the center of a gray background. Images were presented in a continuous stream of 600 trials (∼8 min), with each image gradually transitioning into the next over 800 ms without any inter-stimulus interval. The use of smooth, linear transitions between stimuli helps reduce the abrupt visual onsets that can reset or disrupt attentional states (e.g., Ref. 31 ), thereby allowing for a more continuous measurement of sustained attention. In this continuous shift, target (mountain) images appeared in 10 % of the trials, while nontarget (city) images appeared in 90 %.
Participants were instructed to respond to nontargets (city scenes) by tapping the screen, and to withhold responses to targets (mountain scenes). To avoid having fixed visual elements interfere with judgments of the gradually changing stimuli, no virtual buttons were used, and the entire screen served as the response area (Figure 3). This meant that participants continuously monitored the changing scenery as it gradually appeared and disappeared, tapping the screen when they judged that the cityscape had appeared and suppressing the tap response when they judged that the mountain scenery had appeared. Participants completed 10 practice trials prior to the main task to ensure task comprehension.
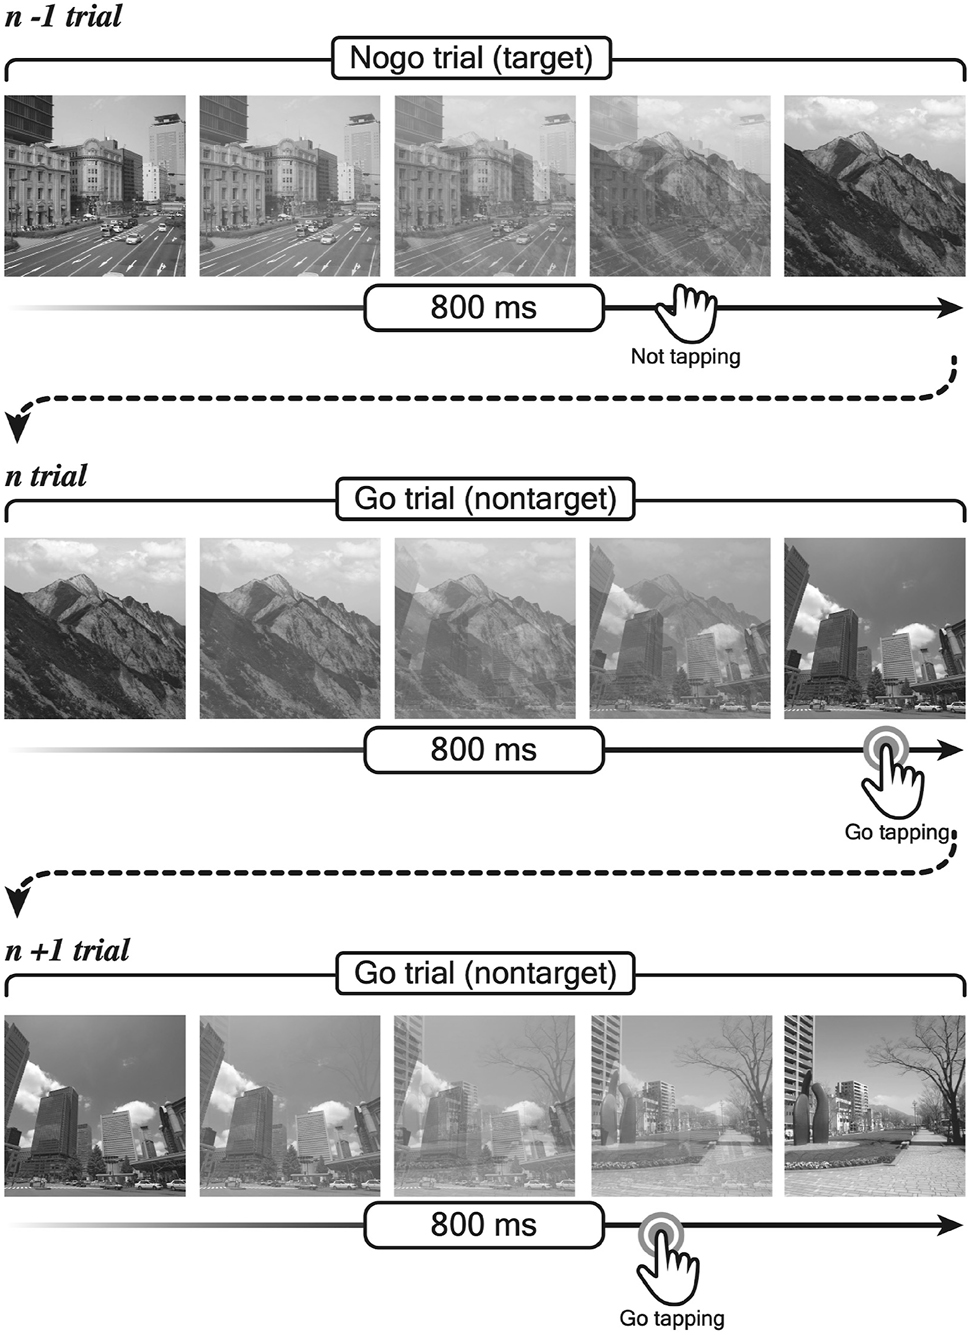
Stimulus transition and response types in the gradual-onset continuous performance task. Participants tapped the screen on go trials (city scenes) and withheld responses on nogo trials (mountain scenes).
3 Results
Given the extremely small sample size (N = 2), no statistical hypothesis testing was conducted for either task. Instead, we report descriptive trends in task performance across conditions, including measures such as mean and median reaction times, accuracy rates, and observed differences between dry and wet conditions. All analyses were conducted using R (Version 4.4.2, Ref. 32]) and RStudio (Version 2024.12.1.563, Ref. 33 ). Bootstrap procedures and effect size calculations were performed using the ‘boot’, ‘bootES’, and ‘effectsize’ packages in R. The ‘imputeTS’ package was used for time series imputation and analysis.
3.1 The results of the visual search task
To account for the small sample size, we employed a nonparametric bootstrap procedure to estimate confidence intervals for reaction times across conditions. Bootstrap estimation was conducted for each of the 24 conditions, defined by a 2 (target presence: present or absent) × 2 (set size: 19 or 37 items) × 3 (tilt angle: 4°, 5°, or 6°) × 2 (environment: dry or wet) factorial design. For each condition, 5,000 bootstrap resamples were drawn with replacement from the combined trial-level data of both participants. Prior to bootstrap resampling, trials with response errors were excluded from the analysis (2 out of 480 trials). In addition to estimating condition-wise mean reaction times and 95 % confidence intervals, we also calculated bootstrap-based estimates of effect sizes (e.g., Cohen’s d) for key contrasts of interest.
First, to evaluate the validity of the visual search task, we examined the overall mean reaction times and their 95 % confidence intervals for each condition, collapsing across environments. Bootstrap-estimated mean reaction times were shorter for target-present trials (M = 936.93 ms, 95 % CI [882.96, 1,072.64]) than for target-absent trials (M = 1,374.44 ms, 95 % CI [1,289.88, 1,483.78]), with a bootstrap-estimated Cohen’s d of 0.63 (95 % CI [0.26, 0.87]). Responses were also faster in the set size 19 condition (M = 1,018.37 ms, 95 % CI [959.89, 1,097.69]) than in the set size 37 condition (M = 1,296.74 ms, 95 % CI [1,205.56, 1,428.72]), with a bootstrap-estimated Cohen’s d of 0.39 (95 % CI [0.22, 0.54]). However, reaction times were similar across target tilts (4°, M = 1,182.64 ms, 95 % CI [1,094.94, 1,298.71]; 5°, M = 1,119.12 ms, 95 % CI [1,026.78, 1,248.38]; 6°, M = 1,169.97 ms, 95 % CI [1,075.14, 1,371.16]), and their confidence intervals largely overlapped, suggesting no meaningful effect of tilt on search performance, with a bootstrap-estimated η 2 of 0.04 (95 % CI [0.01, 0.07]). Reaction times tended to be slower in the wet condition (M = 1,278.825 ms, 95 % CI [1,191.93, 1,406.08]) compared to the dry condition (M = 1,034.52 ms, 95 % CI [974.22, 1,114.93]), with a bootstrap-estimated Cohen’s d of 0.34 (95 % CI [0.16, 0.49]). Detailed bootstrap-estimated means and confidence intervals for all 24 task conditions (collapsed across participants) are presented in Table 1 and Figure 4. These visualizations provide a comprehensive overview of the observed trends across combinations of target presence, set size, and tilt angle in both environmental conditions.
Bootstrapped mean reaction times (ms) and 95 % confidence intervals in the visual search task across dry and wet environments, categorized by set size, target angle, and target presence. All confidence intervals were obtained via bootstrapping.
| Set size | Target tilt | Dry | Wet | ||||
|---|---|---|---|---|---|---|---|
| Mean reaction time (ms) | 95 % CI lower | 95 % CI upper | Mean reaction time (ms) | 95 % CI lower | 95 % CI upper | ||
| Target-absent | |||||||
| 19 | 4° | 907.35 | 804.69 | 1,081.91 | 1,499.44 | 1,167.25 | 1,994.18 |
| 5° | 976.29 | 848.46 | 1,313.62 | 1,357.62 | 1,110.84 | 1,740.15 | |
| 6° | 1,020.90 | 896.64 | 1,223.72 | 1,239.53 | 1,064.33 | 1,665.43 | |
| 37 | 4° | 1,580.41 | 1,301.78 | 2,099.08 | 1,648.29 | 1,441.25 | 1,947.70 |
| 5° | 1,425.76 | 1,165.64 | 1,914.06 | 1,734.30 | 1,396.44 | 2,631.57 | |
| 6° | 1,431.86 | 1,203.81 | 1,907.71 | 1,690.72 | 1,512.67 | 1,908.98 | |
| Target-present | |||||||
| 19 | 4° | 813.72 | 753.84 | 938.69 | 912.80 | 798.66 | 1,092.69 |
| 5° | 733.88 | 702.37 | 787.04 | 929.55 | 813.61 | 1,119.64 | |
| 6° | 848.81 | 727.28 | 1,288.29 | 994.78 | 833.53 | 1,306.99 | |
| 37 | 4° | 926.71 | 823.24 | 1,129.13 | 1,162.05 | 980.53 | 1,372.03 |
| 5° | 895.34 | 796.99 | 1,057.71 | 898.12 | 793.68 | 1,090.31 | |
| 6° | 849.83 | 773.76 | 968.38 | 1,284.82 | 844.94 | 2,960.26 | |
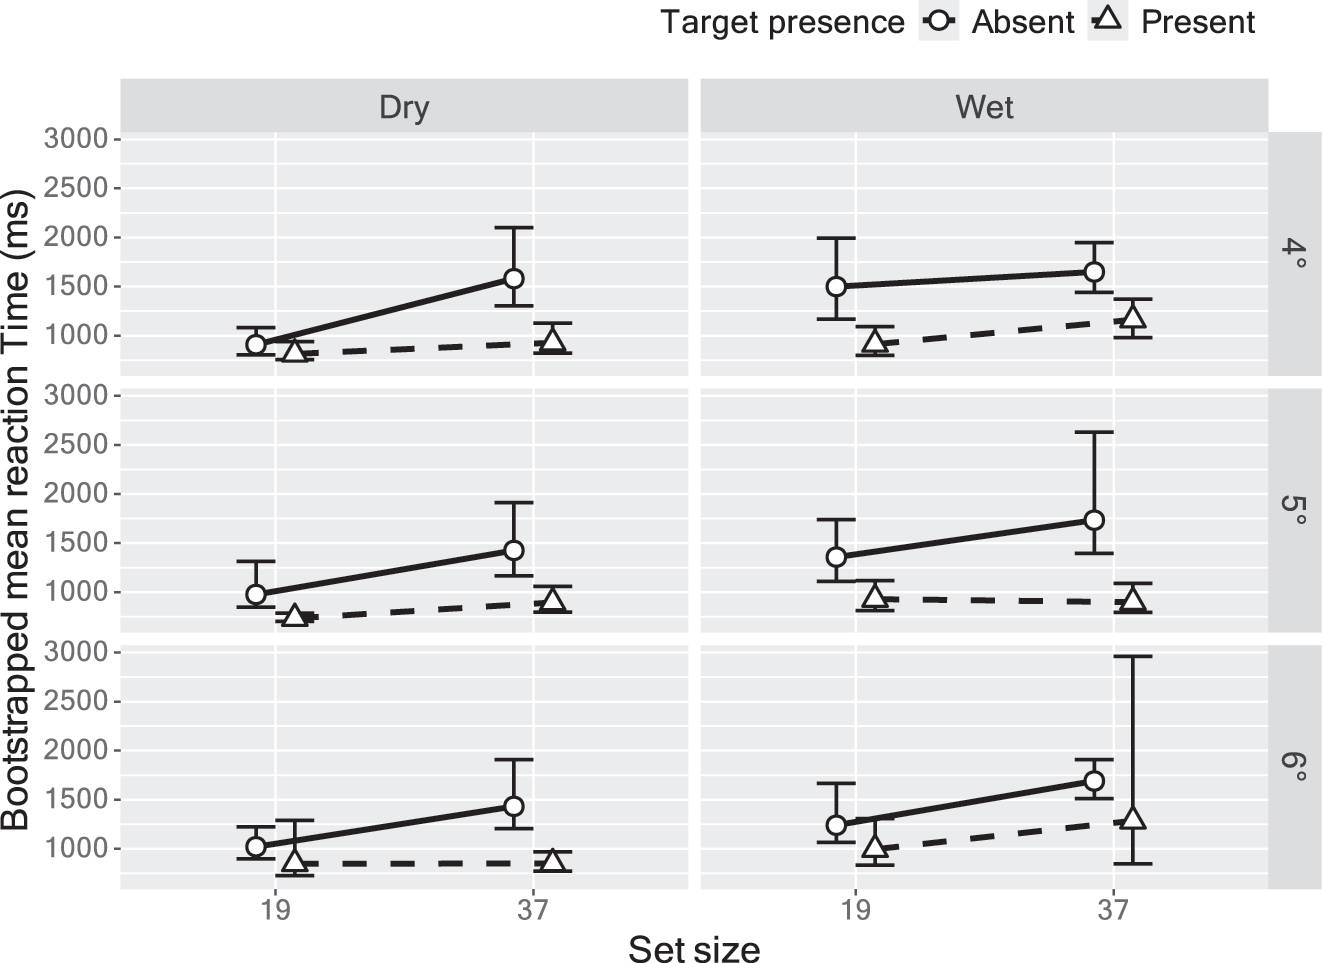
Bootstrapped mean reaction times in the visual search task across environments, target presence, set size, and target tilt. Error bars represent 95 % confidence intervals estimated via bootstrap resampling.
3.2 The results of the gradual-onset continuous performance task
In the grad-CPT, city scenes were designated as “Go” stimuli (requiring a response) and mountain scenes as “Nogo” stimuli (requiring response inhibition). Reaction times were recorded from the point at which the previous image (n − 1) reached full coherence (0 ms) to the point at which the current image (n) became fully coherent (800 ms), during which the visual stimulus gradually transitioned from one image to the next. In other words, a reaction time of 800 ms indicated that image n was presented in full coherence, without overlap from either the preceding (n − 1) or following (n + 1) image. However, at all other time points within the 800 ms window, the stimulus was a blend of two images, either n and n − 1 or n + 1. Therefore, a participant’s response may not correspond exclusively to the intended image for that trial. For example, a reaction time of 640 ms indicates that image n was displayed with approximately 80 % coherence, while image n − 1 still contributed about 20 % of the visual information. Because a reaction to n − 1 and a reaction to n may occur in one trial, up to two responses were recorded per trial. Therefore, to maximize the number of valid trials by aligning recorded responses with their corresponding stimuli, we applied a response classification procedure. We referred to the response-mapping framework developed by Yamauchi et al., 29 and gratefully used a processing template kindly shared by the authors. Specifically, responses were classified as clearly correct if the coherence of image n was at least 70 % (i.e., ≥560 ms) and the coherence of image n + 1 was less than 40 % (i.e., ≤320 ms). These were considered valid responses to image n. Other responses occurring between 320 ms and 560 ms were classified as ambiguous. When none of the surrounding trials (n − 1, n, or n + 1) had a response, the ambiguous response was assigned to the temporally closest trial, with the exception of nogo trials. In cases where multiple candidate responses were assigned to a single trial based on the classification rules, only the earliest response was retained and the others were discarded. In this study, 21 trials included two recorded responses, all of which were retained following this criterion and none were excluded from analysis.
Based on these classifications, two types of error responses were identified. Commission errors (i.e., false alarms), which are often interpreted as indicators of attentional lapses, were defined as responses made to nogo stimuli (mountain scene) that should have been ignored. Similarly, omission errors (misses) were defined as failures to respond to go stimuli (city scene).
Mean reaction times were 692.85 ms (SD = 89.75) in the dry condition and 694.73 ms (SD = 123.56) in the wet condition. The commission error rates were 1.00 % in the dry environment and 1.42 % in the wet environment, while omission error rates were 7.50 % and 10.42 %, respectively. These results were compared with those reported by Yamauchi et al. 29 (Table 2). Reaction times were longer in both environments than Yamauchi et al. 29 (Dry: M diff = 83.93 ms; Wet: M diff = 85.81 ms). Additionally, commission error rates were lower (Dry: M diff = −19.57 %; Wet: M diff = −19.15 %), while omission error rates tended to be higher (Dry: M diff = 5.55 %; Wet: M diff = 8.47 %).
Mean reaction times and error rates in the gradual-onset continuous performance task across dry and wet environments for each participant.
| Group | Environment | Mean reaction time (ms) | Standard error | Commission error rate (%) | Omission error rate (%) |
|---|---|---|---|---|---|
| Overall | Dry | 692.85 | 89.75 | 1.00 | 7.50 |
| Wet | 694.73 | 123.56 | 1.42 | 10.42 | |
| Participant 1 | Dry | 702.19 | 114.81 | 1.00 | 11.33 |
| Wet | 690.70 | 152.57 | 1.50 | 12.50 | |
| Participant 2 | Dry | 684.33 | 56.99 | 1.00 | 3.67 |
| Wet | 698.56 | 87.56 | 1.33 | 8.33 | |
| Yamauchi et al. 29 | – | 608.92 | 140.15 | 20.57 | 1.95 |
Furthermore, to examine potential performance changes over time for each participant, the 8-min task was divided into four 2-min quartiles. For each quartile, reaction times and error rates were calculated for each environment condition (Table 3 and Figure 5). Focusing on Participant 1, under dry conditions, reaction times increased in the latter phase (6–8 min: 759.78 ms), accompanied by a rise in omission errors (16 %), while commission errors remained stable. Under wet conditions, reaction times were relatively stable after the first 2 min, and only minor fluctuations were observed in commission errors, which showed a general decreasing trend over time. Omission error rates gradually decreased over time, from 17.33 % in the first quarter to 9.33 % in the final quarter. For Participant 2, reaction times showed minimal variation under both dry and wet conditions (Dry: M diff < 24.44 ms; Wet: M diff < 23.04 ms). Commission error rates also remained relatively stable across time under both dry and wet conditions (Dry: M diff < 1.33 %; Wet: M diff < 1.33 %). Omission error rates also exhibited minimal variation over time (Dry: M diff < 3.33 %; Wet: M diff < 4.00 %).
Mean reaction times and error rates in the gradual-onset continuous performance task across four 2-min quartiles for each participant and environment. Values include mean reaction times (ms), commission error rates (%), and omission error rates (%).
| Group | Environment | Quantile | Mean reaction time (ms) | SE | Commission error rate (%) | Omission error rate (%) |
|---|---|---|---|---|---|---|
| Overall | Dry | 0–2 min | 685.41 | 5.65 | 2.33 | 7.00 |
| 2–4 min | 666.64 | 5.09 | 1.00 | 5.67 | ||
| 4–6 min | 694.56 | 5.46 | 0.33 | 7.67 | ||
| 6–8 min | 726.29 | 4.83 | 0.33 | 9.67 | ||
| Wet | 0–2 min | 718.08 | 8.45 | 1.67 | 13.00 | |
| 2–4 min | 677.21 | 7.08 | 1.33 | 10.00 | ||
| 4–6 min | 695.28 | 8.70 | 1.00 | 10.67 | ||
| 6–8 min | 689.38 | 5.78 | 1.67 | 8.00 | ||
| Participant 1 | Dry | 0–2 min | 697.97 | 10.52 | 2.67 | 10.00 |
| 2–4 min | 644.60 | 9.32 | 1.33 | 9.33 | ||
| 4–6 min | 711.61 | 9.19 | 0.00 | 9.33 | ||
| 6–8 min | 759.77 | 8.27 | 0.00 | 16.67 | ||
| Wet | 0–2 min | 738.43 | 15.35 | 1.33 | 17.33 | |
| 2–4 min | 668.67 | 12.38 | 1.33 | 12.67 | ||
| 4–6 min | 689.57 | 15.59 | 1.33 | 10.67 | ||
| 6–8 min | 669.92 | 8.95 | 2.00 | 9.33 | ||
| Participant 2 | Dry | 0–2 min | 673.72 | 4.67 | 2.00 | 4.00 |
| 2–4 min | 686.84 | 4.07 | 0.67 | 2.00 | ||
| 4–6 min | 678.19 | 5.73 | 0.67 | 6.00 | ||
| 6–8 min | 698.16 | 4.31 | 0.67 | 2.67 | ||
| Wet | 0–2 min | 699.90 | 7.89 | 2.00 | 8.67 | |
| 2–4 min | 685.19 | 7.29 | 1.33 | 7.33 | ||
| 4–6 min | 700.98 | 7.83 | 0.67 | 10.67 | ||
| 6–8 min | 708.22 | 7.03 | 1.33 | 6.67 |
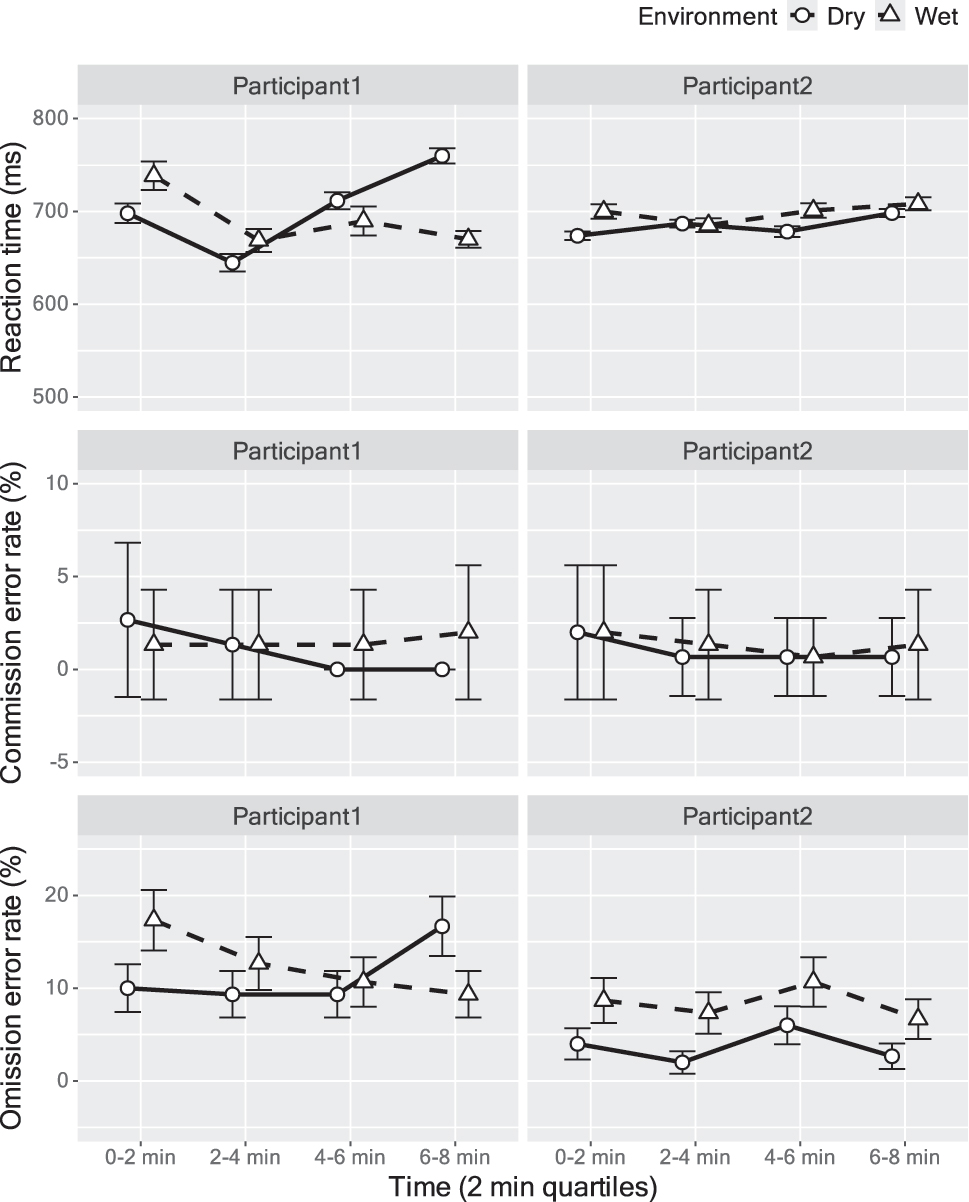
Time course of reaction times and omission error rates across 2-min quartiles in the gradual-onset continuous performance task. Data are shown for each participant under dry and wet conditions. Reaction times (top), commission error rates (middle) and omission error rates (bottom) were averaged within each quartile to assess changes in performance over time. Error bars represent standard errors of the mean.
To further characterize task performance in each environment, we calculated and compared the discrimination sensitivity index d′ and response bias c based on signal detection theory. 34 For this analysis, hits were defined as correct responses to go trials, and false alarms were defined as commission errors (failure to suppress response). The resulting d′ and c values are presented in Table 4. Overall, both participants demonstrated relatively high discrimination sensitivity (d′ > 2.1) across conditions, indicating that the task was successful in eliciting distinguishable responses between targets and nontargets even in underwater environments. However, both participants showed a reduction in d′ under wet conditions, with Participant 1 decreasing from 2.43 (dry) to 2.12 (wet), and Participant 2 decreasing from 3.02 (dry) to 2.44 (wet). Response bias c remained relatively stable across environments. For Participant 1, c was slightly liberal in the dry condition (c = −0.07) and shifted toward a more neutral bias in the wet condition (c = 0.024). For Participant 2, a liberal bias was observed in both conditions, though it became slightly more conservative in the wet condition (c = −0.23 in dry vs. −0.11 in wet).
d′ and c criterion by participant and condition. Discriminability (d′) and response bias (c) were calculated using signal detection theory.
| Participant | Environment | d’ | c |
|---|---|---|---|
| Participant 1 | Dry | 2.43 | 0.07 |
| Participant 1 | Wet | 2.12 | −0.02 |
| Participant 2 | Dry | 3.02 | −0.23 |
| Participant 2 | Wet | 2.44 | −0.11 |
4 Discussion
This study evaluated the practicality and limitations of the waterproof tablet for underwater cognitive experiments by comparing performance on a visual search task and a grad-CPT between dry and wet conditions. The results showed that the effects of target presence and set size on visual search tasks were found under both dry and wet conditions, while no effect of target tilt was found in the visual search task. In the grad-CPT, slight increases in both reaction time and error rates were observed underwater, and individual differences in performance variability over an 8-min task were also observed. Additionally, the overall reaction times were longer and the omission error rate was higher than that in the previous research. These results indicate that the waterproof tablet allows for the implementation of tasks comparable to laboratory experiments, although they also highlight several limitations in experimental design stemming from the nature of human-tablet interaction.
The results of the two tasks in the present study supported the validity of tablet devices in cognitive experiments in underwater environments. The visual search task showed typical patterns of reaction times under both dry and wet conditions. Additionally, the grad-CPT results showed that both participants achieved high discrimination sensitivity. These results demonstrate that tablets can be used to perform tasks that involve distinguishing between targets and nontargets even underwater. This is consistent with previous studies that conducted tasks such as Stroop and task switching in underwater conditions. 19 These findings suggest that tablet devices can be used to execute a wide range of cognitive paradigms beyond attention, including working memory and decision-making.
The waterproof tablet device is also valuable for research that requires monitoring cognitive status during diving operations. Individual performance patterns on the grad-CPT task (∼8 min) revealed that Participant 1 exhibited substantial temporal fluctuations in reaction time and error rate, whereas Participant 2 maintained relatively stable performance. These findings suggest that waterproof tablets can detect changes in attention and fatigue even in underwater environments. Given their ability to precisely control visual stimulus presentation, accurately record responses, and continuously assess cognitive status underwater, our study provides a foundational understanding of human-tablet interaction that can inform future advanced field cognitive tasks.
This study also revealed several limitations in the design and implementation of cognitive tasks using tablet devices in an underwater environment. The most prominent issue was the difficulty in detecting subtle differences in stimulus attributes on the waterproof tablet. In the visual search task, task difficulty was manipulated by varying the tilt angle of the target bar (4°, 5°, and 6°). However, no substantial differences in reaction time were observed across these angles under both dry and wet conditions. This may be attributed to the challenges of using mobile devices in outdoor settings, such as display instability, 35 or optical distortion. Therefore, cognitive tasks conducted with tablets in underwater (or other natural) environments should be designed to minimize the effects of viewing angles and optical distortion, and to enhance the visibility of critical stimulus changes. This also applies to the design of user interfaces intended for underwater use.
While we successfully recorded reaction times of taps on the tablet in both tasks, we also observed the practical issues in measuring reaction time. In visual search, the reaction times in previous studies were less than 850 ms even at their maximum values (see Figures 6 and 7 in Ref. 28 ), whereas the mean reaction times in this study ranged from 813.72 ms to 1,499.44 ms (Table 2). These reaction time delays may be due to device-specific limitations. Previous studies have reported that reaction times on touch screens are slower than those on conventional keyboards and mice due to the complexity of touch movement preparation. 36 , 37 Therefore, comparisons of response times between different devices should be avoided. This study used tablets under both dry and wet conditions to compare performance; however, in field-based cognitive experiments, data collection may need to be conducted using different devices in the laboratory and in the field. In such a case, the researcher should plan an experimental design that considers the possibility of device-specific response time issues, especially when using different hardware in the laboratory and in the field.
Another issue with response interaction on tablet devices is the difficulty in feeling response feedback. The grad-CPT in this study did not use virtual buttons to avoid visual objects that would interfere with monitoring gradually changing stimuli. However, this design could have reduced participants’ confidence that their taps were recorded correctly, leading to an increase in omission errors. Previous studies have reported that the absence of sensory feedback when responding on a flat surface can increase error rates. 36 , 38 , 39 In addition, the tablet devices used in this study were housed in waterproof cases and the touch screens were covered with a flexible vinyl layer (see Figure 1A), which may have made it more difficult to feel the feedback from tapping. Therefore, tasks conducted in underwater environments where physical buttons are difficult to implement need to present clear visual feedback. Since tablet devices are expected to remain the primary tool for field experiments in underwater environments, further research is needed on human-tablet interactions under such constraints.
Finally, this study has several limitations. First, the results of this study were based on a small sample size. This was mainly due to the high cost of recruiting diver participants. Therefore, increasing the sample size may give rise to new methodological discussions. Another limitation is that this study examined only one device and therefore could not compare its advantages and disadvantages with other devices. Comparison with other electronic devices such as smartphones and conventional analog devices such as styluses will need to be considered in the future. The study’s focus on only two attention tasks is also a limitation. We deliberately selected these as a first step in exploring suitable cognitive paradigms for this unique environment, given the practical constraints of dive time and participant burden. The exploration of other tasks, such as memory and decision-making or more ecologically valid navigation tasks, remains a direction for future work. To develop tasks with greater ecological validity, future studies could employ a mixed-methods approach that includes interviews with professional divers. Although there are still issues to be addressed, this study provided valuable knowledge about the practicality and limitations of the waterproof tablet for measuring human behavior in underwater settings where understanding human-computer interaction is critical for valid data collection.
5 Conclusions
This case study suggested that the waterproof tablet can be an effective tool for performing cognitive tasks underwater at levels comparable to laboratory experiments. Conversely, several methodological limitations were also identified, such as the difficulty of detecting subtle differences in stimuli and issues with button feedback. These results provide preliminary findings for designing future advanced field experiments on cognition, particularly in underwater and other extreme environments. Given the growing attention on mobile devices as a practical approach in field research, 40 , 41 , 42 this study offers initial data and practical guidelines for experimental designs in underwater and other non-conventional research environments.
Funding source: Japan Society for the Promotion of Science
Award Identifier / Grant number: 20K03376
Award Identifier / Grant number: 22J01676
Award Identifier / Grant number: 23H00078
Award Identifier / Grant number: 24K21068
Acknowledgments
We are sincerely grateful to Takumi Nishikawa and Shokei Toda for their cooperation and participation in this experiment. We also wish to thank Marine Co., Ltd. for providing access to their facilities.
-
Research ethics: This study was approved by the Ethical Review Committee of Ritsumeikan University (Approval No. 衣笠-人-2023-76). All participants gave their informed consent prior to their participation in the study, in accordance with institutional and ethical guidelines.
-
Informed consent: Informed consent was obtained from the identifiable individuals for the publication of any potentially identifiable images or data included in this article.
-
Author contributions: All authors have accepted responsibility for the entire content of this manuscript and approved its submission. NY: conceptualization, methodology, software, formal analysis, investigation, data curation, visualization, writing – original draft, writing – review & editing, project administration, funding acquisition; KT: conceptualization, methodology, visualization, writing – review & editing, supervision, funding acquisition.
-
Use of Large Language Models, AI and Machine Learning Tools: We used ChatGPT[43] as an AI-assisted technology to check grammar and spelling, and to improve the readability of this article.
-
Conflict of interest: All other authors state no conflict of interest.
-
Research funding: The present study was supported by JSPS KAKENHI Grant Number 20K03376, 22J01676, 23H00078 and 24K21068.
-
Data availability: The data, materials, and source code that support the findings of this study are openly available in the Open Science Framework at https://osf.io/pw5qx/. This repository includes the experimental code (Unity C# source code), all raw participant data, and the R scripts used for analysis. Further details are available within the repository. Stimuli are available from the corresponding author upon reasonable request for academic and non-commercial purposes. 43
References
1. Čejka, J.; Zsíros, A.; Liarokapis, F. A Hybrid Augmented Reality Guide for Underwater Cultural Heritage Sites. Pers. Ubiquit. Comput. 2020, 24 (6), 815–828. https://doi.org/10.1007/s00779-019-01354-6.Suche in Google Scholar
2. Eun, S. J.; Kim, J. Y.; Lee, S. H. Development of Customized Diving Computer Based on Wearable Sensor for Marine Safety. IEEE Access 2019, 7, 1–17957. https://doi.org/10.1109/access.2019.2894740.Suche in Google Scholar
3. Smith, S. M.; Vela, E. Environmental Context-Dependent Memory: A Review and Meta-Analysis. Psychon. Bull. Rev. 2001, 8 (2), 203–220. https://doi.org/10.3758/bf03196157.Suche in Google Scholar PubMed
4. Godden, D. R.; Baddeley, A. D. Context-Dependent Memory in Two Natural Environments: On Land and Underwater. Br. J. Psychol. 1975, 66 (3), 325–331. https://doi.org/10.1111/j.2044-8295.1975.tb01468.x.Suche in Google Scholar
5. Taylor, L.; Watkins, S. L.; Marshall, H.; Dascombe, B. J.; Foster, J. The Impact of Different Environmental Conditions on Cognitive Function: A Focused Review. Front. Physiol. 2016, 6, 372. https://doi.org/10.3389/fphys.2015.00372.Suche in Google Scholar PubMed PubMed Central
6. Dandurand, F.; Shultz, T. R.; Onishi, K. H. Comparing Online and Lab Methods in a Problem-Solving Experiment. Behav. Res. Methods 2008, 40 (2), 428–434. https://doi.org/10.3758/brm.40.2.428.Suche in Google Scholar PubMed
7. Buso, I. M.; Di Cagno, D.; Ferrari, L.; Larocca, V.; Lorè, L.; Marazzi, F.; Panaccione, L.; Spadoni, L. Lab-Like Findings from Online Experiments. J. Econ. Sci. Assoc. 2021, 7 (2), 184–193. https://doi.org/10.1007/s40881-021-00114-8.Suche in Google Scholar
8. Anwyl-Irvine, A.; Dalmaijer, E. S.; Hodges, N.; Evershed, J. K. Realistic Precision and Accuracy of Online Experiment Platforms, Web Browsers, and Devices. Behav. Res. Methods 2021, 53 (4), 1407–1425. https://doi.org/10.3758/s13428-020-01501-5.Suche in Google Scholar PubMed PubMed Central
9. Shamay-Tsoory, S. G.; Mendelsohn, A. Real-Life Neuroscience: An Ecological Approach to Brain and Behavior Research. Perspect. Psychol. Sci. 2019, 14 (5), 841–859. https://doi.org/10.1177/1745691619856350.Suche in Google Scholar PubMed
10. de Leeuw, J. R.; Gilbert, R. A.; Luchterhandt, B. JsPsych: Enabling an Open-Source Collaborative Ecosystem of Behavioral Experiments. J. Open Source Softw. 2023, 8 (85), 5351. https://doi.org/10.21105/joss.05351.Suche in Google Scholar
11. Henninger, F.; Shevchenko, Y.; Mertens, U. K.; Kieslich, P. J.; Hilbig, B. E. Lab.Js: A Free, Open, Online Study Builder. Behav. Res. 2022, 54 (2), 556–573. https://doi.org/10.3758/s13428-019-01283-5.Suche in Google Scholar PubMed PubMed Central
12. Peirce, J.; Gray, J. R.; Simpson, S.; MacAskill, M.; Höchenberger, R.; Sogo, H.; Kastman, E.; Lindeløv, J. K. PsychoPy2: Experiments in Behavior Made Easy. Behav. Res. Methods 2019, 51 (1), 195–203. https://doi.org/10.3758/s13428-018-01193-y.Suche in Google Scholar PubMed PubMed Central
13. De Sanctis, P.; Solis-Escalante, T.; Seeber, M.; Wagner, J.; Ferris, D. P.; Gramann, K. Time to Move: Brain Dynamics Underlying Natural Action and Cognition. Eur. J. Neurosci. 2021, 54 (12), 8075–8080. https://doi.org/10.1111/ejn.15562.Suche in Google Scholar PubMed PubMed Central
14. Kerr, R. Movement Time in an Underwater Environment. J. Mot. Behav. 1973, 5 (3), 175–178. https://doi.org/10.1080/00222895.1973.10734962.Suche in Google Scholar PubMed
15. Hancock, P. A.; Milner, E. K. Mental and Psychomotor Task Performance in an Open Ocean Underwater Environment. Res. Q. Exerc. Sport 1982, 53 (3), 247–251. https://doi.org/10.1080/02701367.1982.10609349.Suche in Google Scholar
16. Dalecki, M.; Bock, O.; Schulze, B. Cognitive Impairment During 5 m Water Immersion. J. Appl. Physiol. 2012, 113 (7), 1075–1081. https://doi.org/10.1152/japplphysiol.00825.2012.Suche in Google Scholar PubMed
17. Dalecki, M.; Bock, O.; Hoffmann, U. Inverse Relationship Between Task Complexity and Performance Deficit in 5 m Water Immersion. Exp. Brain Res. 2013, 227 (2), 243–248. https://doi.org/10.1007/s00221-013-3506-4.Suche in Google Scholar PubMed
18. Dalecki, M.; Steinberg, F.; Beurskens, R. Rapid Dual-Task Decrements After a Brief Period of Manual Tracking in Simulated Weightlessness by Water Submersion. Hum. Factors 2021, 65, 187208211051804. https://doi.org/10.1177/00187208211051804.Suche in Google Scholar PubMed
19. Steinberg, F.; Doppelmayr, M. Executive Functions of Divers are Selectively Impaired at 20-Meter Water Depth. Front. Psychol. 2017, 8, 1000. https://doi.org/10.3389/fpsyg.2017.01000.Suche in Google Scholar PubMed PubMed Central
20. Möller, F.; Hoffmann, U.; Dalecki, M.; Dräger, T.; Doppelmayr, M.; Steinberg, F. Physical Exercise Intensity During Submersion Selectively Affects Executive Functions. Hum. Factors 2021, 63 (2), 227–239. https://doi.org/10.1177/0018720819879313.Suche in Google Scholar PubMed
21. Boucher, L.; Feingold, J.; Concannon, K.; Talavera, S.; Tartar, J.; Matthew Collins, W. Memory and Attention While SCUBA Diving at Shallow and Deep Depths: An Open Water Study. J. Sports Neurosci. 2022, 1 (2), 5.Suche in Google Scholar
22. Clark, J. E. Moving in Extreme Environments: Inert Gas Narcosis and Underwater Activities. Extrem. Physiol. Med. 2015, 4 (1), 1. https://doi.org/10.1186/s13728-014-0020-7.Suche in Google Scholar PubMed PubMed Central
23. Hou, G.; Zhang, Y.; Zhao, N.; Chen, R.; Xiao, W.; Yu, H.; Wang, J.; Yuan, T.-F. Mental Abilities and Performance Efficacy Under a Simulated 480-m Helium-Oxygen Saturation Diving. Front. Psychol. 2015, 6, 979. https://doi.org/10.3389/fpsyg.2015.00979.Suche in Google Scholar PubMed PubMed Central
24. Kerr, R. Diving, Adaptation, and Fitts Law. J. Mot. Behav. 1978, 10 (4), 255–260. https://doi.org/10.1080/00222895.1978.10735159.Suche in Google Scholar PubMed
25. Godden, D.; Baddeley, A. When Does Context Influence Recognition Memory? Br. J. Psychol. 1980, 71 (1), 99–104. https://doi.org/10.1111/j.2044-8295.1980.tb02735.x.Suche in Google Scholar
26. Dalecki, M.; Bock, O. Changed Joint Position Sense and Muscle Activity in Simulated Weightlessness by Water Immersion. Aviat. Space Environ. Med. 2013, 84 (2), 110–115. https://doi.org/10.3357/asem.3394.2013.Suche in Google Scholar PubMed
27. Liesefeld, H.; Moran, R.; Usher, M.; Müller, H.; Zehetleitner, M. Search Efficiency as a Function of Target Saliency. J. Exp. Psychol. 2016, 42 (6), 821–836; https://doi.org/10.1037/xhp0000156.Suche in Google Scholar PubMed
28. Yoshimura, N.; Yonemitsu, F.; Marmolejo-Ramos, F.; Ariga, A.; Yamada, Y. Task Difficulty Modulates the Disrupting Effects of Oral Respiration on Visual Search Performance. J. Cogn. 2019, 2 (1), 21. https://doi.org/10.5334/joc.77.Suche in Google Scholar PubMed PubMed Central
29. Yamauchi, K.; Kihara, K.; Kawahara, J. I. Predicting Sustained Performance Over a Short Time. Jpn. J. Psychonomic Sci. 2019, 38 (1), 2–12. https://doi.org/10.14947/psychono.38.3.Suche in Google Scholar
30. Rosenberg, M.; Noonan, S.; DeGutis, J.; Esterman, M. Sustaining Visual Attention in the Face of Distraction: A Novel Gradual-Onset Continuous Performance Task. Atten. Percept. Psychophys. 2013, 75 (3), 426–439. https://doi.org/10.3758/s13414-012-0413-x.Suche in Google Scholar PubMed
31. Yantis, S.; Jonides, J. Abrupt Visual Onsets and Selective Attention: Evidence from Visual Search. J. Exp. Psychol. Hum. Percept. Perform. 1984, 10 (5), 601–621. https://doi.org/10.1037/0096-1523.10.5.601.Suche in Google Scholar
32. R Core Team. R: A Language and Environment for Statistical Computing; R Foundation for Statistical Computing: Vienna, Austria, 2024.Suche in Google Scholar
33. Posit Team. RStudio: Integrated Development Environment for R; Posit Software, PBC: Boston, MA, 2024.Suche in Google Scholar
34. Stanislaw, H.; Todorov, N. Calculation of Signal Detection Theory Measures. Behav. Res. Methods Instrum. Comput. 1999, 31 (1), 137–149. https://doi.org/10.3758/bf03207704.Suche in Google Scholar PubMed
35. Bezerianos, A.; Isenberg, P. Perception of Visual Variables on Tiled Wall-Sized Displays for Information Visualization Applications. IEEE Trans. Visualization Comput. Graphics 2012, 18 (12), 2516–2525. https://doi.org/10.1109/TVCG.2012.251.Suche in Google Scholar PubMed
36. Lin, C.-J.; Wu, C. Reactions, Accuracy and Response Complexity of Numerical Typing on Touch Screens. Ergonomics 2013, 56 (5), 818–831. https://doi.org/10.1080/00140139.2013.767384.Suche in Google Scholar PubMed
37. Sears, A.; Revis, D.; Swatski, J.; Crittenden, R.; Shneiderman, B. Investigating Touchscreen Typing: The Effect of Keyboard Size on Typing Speed. Behav. Inf. Technol. 1993, 12 (1), 17–22. https://doi.org/10.1080/01449299308924362.Suche in Google Scholar
38. Faeth, A.; Harding, C. Effects of Modality on Virtual Button Motion and Performance. In Proceedings of the 14th ACM International Conference on Multimodal Interaction; ICMI ’12; Association for Computing Machinery: New York, NY, USA, 2012; pp. 117–124.10.1145/2388676.2388704Suche in Google Scholar
39. Kim, J. R.; Tan, H. Z. Effect of Information Content in Sensory Feedback on Typing Performance Using a Flat Keyboard. In 2015 IEEE World Haptics Conference (WHC); IEEE, 2015; pp. 228–234.10.1109/WHC.2015.7177718Suche in Google Scholar
40. Guo, Y.; Shachat, J.; Walker, M. J.; Wei, L. On the Generalizability of Using Mobile Devices to Conduct Economic Experiments. J. Behav. Exp. Econ. 2023, 106 (102057), 102057. https://doi.org/10.1016/j.socec.2023.102057.Suche in Google Scholar
41. Miller, G. The Smartphone Psychology Manifesto. Perspect. Psychol. Sci. 2012, 7 (3), 221–237. https://doi.org/10.1177/1745691612441215.Suche in Google Scholar PubMed
42. Harari, G. M.; Lane, N. D.; Wang, R.; Crosier, B. S.; Campbell, A. T.; Gosling, S. D. Using Smartphones to Collect Behavioral Data in Psychological Science: Opportunities, Practical Considerations, and Challenges: Opportunities, Practical Considerations, and Challenges. Perspect. Psychol. Sci. 2016, 11 (6), 838–854. https://doi.org/10.1177/1745691616650285.Suche in Google Scholar PubMed PubMed Central
43. OpenAI. ChatGPT; OpenAI: San Francisco, CA, USA, 2025. https://chat.openai.com/.Suche in Google Scholar
© 2025 the author(s), published by De Gruyter, Berlin/Boston
This work is licensed under the Creative Commons Attribution 4.0 International License.