Formation of Nano-porous Structure in a Cathode at the Interface between Pt Electrode and YSZ during CO2 Electrolysis at 1,000 °C
-
Yoshiaki Kashiwaya
 ,
Takahiro Nomura
,
Takahiro Nomura

Abstract
The electrolysis of CO2 was investigated using a simple Pt/YSZ/Pt cell (yttria-stabilized zirconia (YSZ)). The cell performance increased drastically after applying the overvoltage of 4.0 V for ~5 min. The current density increased 30 times at 1.4 V and 11 times at 2.0 V. Using a laser microscope and field emission scanning electron microscopy (FE-SEM), the structural changes of the surface of the Pt electrode and the interface between the YSZ and Pt electrode were investigated to understand the reaction mechanism at the cathode for increasing the cell performance. The results showed that the Pt electrode surface became smooth after the experiment. Moreover, the interface between YSZ and the Pt cathode greatly changed after the electrolysis experiment, while that of the anode showed only a minor change. The structure of the cathode interface consisted of a 1-μm-thick nano-porous Pt layer and a micro-porous structure comprising YSZ and Pt. These structures are involved in CO2 electrolysis. Possible elementary reactions are also presented in this paper.
Introduction
Decreasing CO2 emissions is currently an important issue for all developing countries. There are many approaches for reducing CO2 emissions. One effective method is CO2 capture and storage (CCS) for large CO2-discharging fields such as electrical power plants and steelmaking mills. In addition, some CO2 from CCS can be used for high-temperature CO2 electrolysis. This application can be practiced when a plant has unused heat. This source of energy can be used in combination with renewable energy resources such as solar and wind power.
Ebbesen et al. [1] have published a comprehensive review on high-temperature electrolysis. They pointed out that only limited studies on CO2 electrolysis in the gas phase have been done [2, 3, 4, 5], while H2O electrolysis [6-10] has been extensively investigated. The development of electrolyte materials having high ionic conductivity such as gadolinia-doped ceria (GDC) and La-Sr-Cr-Mn (LSDM) oxide systems has been studied by many researchers [11, 12, 13, 14, 15]. Since it is favourable to decrease the total energy of electrolysis, a goal of researchers is to reduce the temperature of electrolysis to as low a temperature as possible.
In the case of CO2 electrolysis, however, carbon deposition occurs below 700 °C, which can be expected by thermodynamic calculation from the reaction (2CO(g)=C(s)+CO2(g), under CO/CO2=0.5 and 700 °C), and decreases cell performance. This decreased cell performance is one reason that there are few research efforts on CO2 electrolysis. In our previous study [16], the increase in the performance of CO2 electrolysis was studied by applying a voltage ranging from 2.5 V to 4.0 V using a simple Pt/YSZ/Pt cell, which increased the current density drastically after ~5 min of application.
In this series of studies, YSZ and Pt electrodes are used in a cell in order to use the 1,000–1,500 °C exhaust discharged from a steelmaking plant. One of the benefits of YSZ is its stability at high temperatures. In addition, the technology for fabricating YSZ products is well established. Furthermore, although platinum is expensive, it is 100 % recyclable.
In this report, the change in the micro- and nanostructure of the interface between the Pt electrode and YSZ is investigated using FE-SEM and a laser microscope. The relationship between the increase in cell performance and the change in the electrode structure was elucidated together with the reaction mechanism at the cathode.
Experimental
Figure 1 shows the reaction system used in this study. The cathode and anode reactions are expressed by eqs (1) and (2), respectively.

Reaction system used in the present study.
The electrolytic cell used in the present study was a tube type having the construction Pt/YSZ/Pt (YSZ: 8 mol% Y2O3, Nikkato, Co. Ltd.). Its size was 8 × 5 mm in diameter × 50 mm in length. The gas composition used in the cathode was Ar: 50 cm3 (STP)/min, CO2: 30 cm3 (STP*)/min, and CO: 2 cm3 (STP)/min, which equates to 62 vol% Ar, 36 vol% CO2, and 2 vol% CO. The anode gas was ultra-high pure Ar (>99.9999 %) at 50 cm3 (STP)/min. The linear velocities of the cathode and anode gases were ~1.67 cm/s and ~11 cm/s, respectively. (STP: standard temperature and pressure. (0 °C, 1 bar=105 Pa)
Figure 2 shows the cross section and side view of the electrolytic cell. The Pt electrodes were 20–50 μm thick, and the cathode had an area of 1 cm2. After coating with Pt paste (TR-7601, Tanaka Kikinzoku Kougyou) for the desired area, the Pt paste was dried under ambient atmosphere. The cell was then heated to 1,000 °C and held for 2 h to evaporate the organic compound, and to fix the thin Pt electrode to the YSZ surface. The details of the experimental setup and procedure have been reported in a previous study [16].

Cross section and side view of tube-type YSZ.
In this study, the structure of the Pt electrode was observed by a laser microscope and FE-SEM before and after the electrolytic experiments. The sample was embedded in resin, and then cut and polished for correctly observing the interface between YSZ and the Pt electrode using FE-SEM.
Results and discussion
When the applied voltage exceeded 2.0 V, the colour of the cell turned black, which meant that some reduction of YSZ had occurred. Cell operation times exceeding ~10 min resulted in cell breakage. After a short time operation about 5 min at 4.0 V was performed, the operation voltage was returned to the lower one less than 2.0 V, when the colour of YSZ could return to the original colour.
To elucidate the effect of voltage on cell performance, AC impedance measurements (VARSASTAT4-200, Princeton Applied Research) were conducted. The results are shown in Figure 3.

(a) Variation of Nyquist diagram with voltage ranging from 0 V (OCV) to 2.0 V at 800 °C and (b) a larger-scale view of the points of intersection from (a).
DC voltage of 0 V (open circuit voltage (OCV)) to 2.0 V was applied at intervals of 0.2 V, and then the frequency was varied from 1 mHz to 1 MHz. The resulting Nyquist plots are shown in Figure 3(a). From OCV to 0.6 V, the current did not flow and the slope of the Nyquist plots was at almost 45°, implying a semi-infinite resistance. From 0.8 V, a current gradually flows and the resistance of the cell decreases continuously. The point at which the left-hand-side of the Nyquist plot intersects the real axis (Z′) is about 4.98 Ω·cm–2, which is almost the same as the resistance of YSZ at 800 °C. The diameters of the semi-circles in the Nyquist plots decrease drastically as the voltage increases. The points of intersection on the real axis at the left-hand-side of the Nyquist plot are shown in larger scale in Figure 3(b). It is seen that the resistance of YSZ decreases slightly at 1.8 V. As mentioned earlier in this section, the colour of YSZ did not change after the experiment at 2.0 V. More specifically, it can be said that the resistance of YSZ is about 4.94 Ω·cm–2 at 1.8 V, and then it decreases at voltages greater than 1.8 V. At 2.0 V, the resistance of YSZ decreases to 4.85 Ω·cm–2, and scattering of the Nyquist plot becomes large. These changes indicate that some kind of physical change on the electrode and YSZ has occurred.
Results obtained at 800 °C were almost the same as those obtained at 1,000 °C, except for the value of resistance (about 2.0 Ω·cm–2, 1.5 mm in thickness).
Figure 4 shows the relationships between voltage and current density for a new and used cell. The used cell underwent four runs on applying high voltage until 4.0 V at 1,000 °C. After that, the current density increased ~30 times at 1.4 V and ~11 times at 2.0 V. To understand the reason for this increase, the change in the surface morphology of the Pt electrode on YSZ was examined using a laser microscope and FE-SEM. In addition, the nano- and micro-structures of the interface between the Pt electrode and YSZ were observed using FE-SEM. Figure 5 shows the surface of the Pt electrode using a laser microscope before and after this experiment. Figure 5(a) and 5(c) are images before the experiment, and Figure 5(b) and 5(d) are those after the experiment. The meandering line in the figures indicates the same position before and after the experiment. The horizontal line and small arrows indicate a position for measuring the surface profile, which is shown in Figure 6.
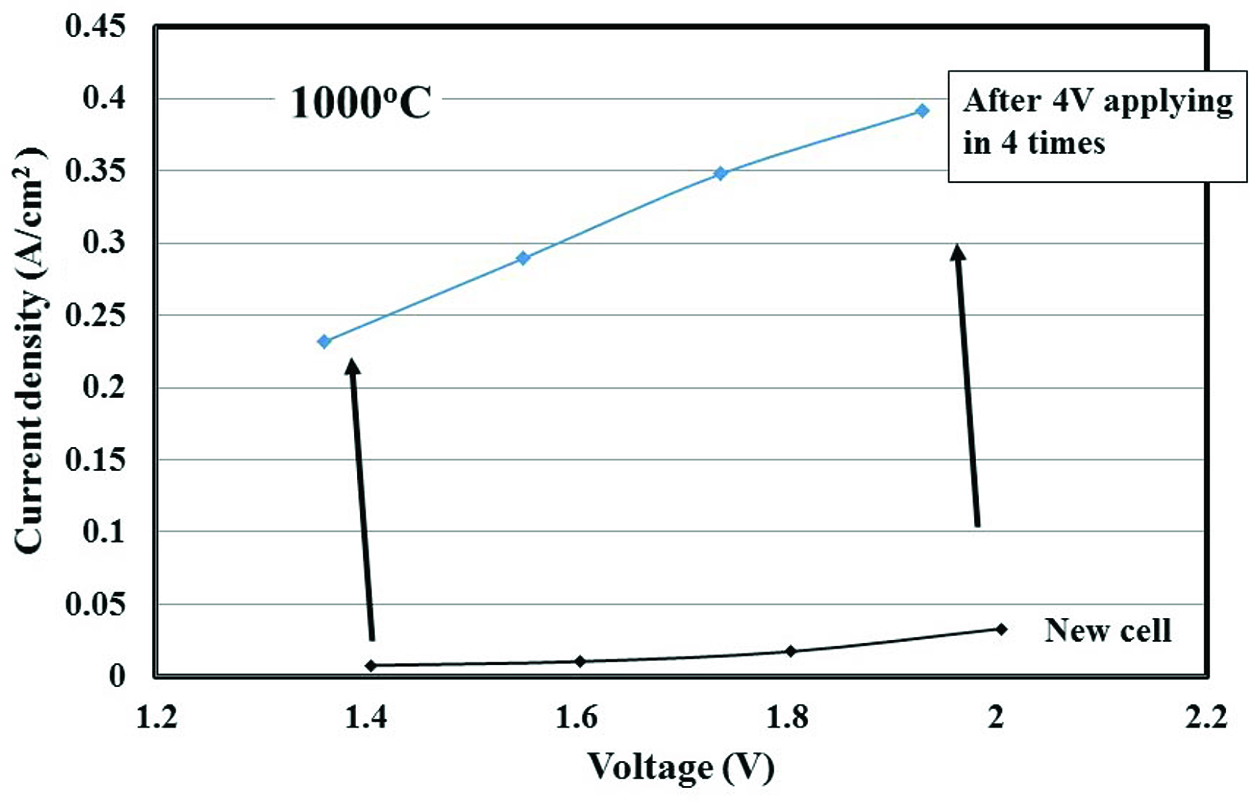
Relationship between voltage and current density at 1,000 °C.

Change in the morphology of Pt surface before and after experiment.

Comparison of the surface profiles of the Pt electrode before and after experiment. The position is indicated by the line in Figure 5 (five small arrows means the positions of holes).
The surface morphology of the Pt electrode changed drastically after the experiment (Figure 5(a) and 5(b)). The pore diameter seems to become larger after the experiment. In addition, the wall thickness of the Pt pores became thicker, which meant the Pt pore network was strengthened. It is considered that the larger pore size corresponds to high gas diffusivity, and the strong network corresponds to high electron conductivity. It is considered that these changes lead to an increase in current density. Figure 5(c) and 5(d) show the distributions of height before and after the experiment, respectively. Since the surfaces are a part of a tube, the average height increases slightly from the bottom of the image to the top of the image. Except for the incline of the base line, it is found that the surface roughness increases after the experiment.
Figure 6 shows the comparison of surface profiles on the line shown in Figure 5. The small arrows ((1)–(5)) in Figure 6 show the position of pores in Figure 5. The height of the surface profile ranged from 5–10 μm before experiment, while the height was 3–10 μm after the experiment. In addition, the variation of height increased after the experiment. The pore indicated by arrow (1) became wider, and the complicated structure disappeared, where located near arrow (1) before the experiment. Similarly, the pores indicated by arrows (3) to (5) were wider and deeper after the experiment. Some of the pores might be deeper than that in the figure and reaching to the surface of YSZ. However, because of the limits of the laser microscope, the measured depth of pores does not mean that the pores reach to the surface of YSZ.
Figure 7 shows the surface morphology of the Pt cathode electrode before the experiment, immediately after heat treatment for 2 h under an air atmosphere at 1,000 °C. The morphology of Pt shows a facet (Figure 7(c) and 7(d)) corresponding to the crystal structure of Pt (FCC). This shape is stable in air. However, this surface structure drastically changed after the electrolytic experiment at ≥2.0 V, as shown in Figure 8. The pores became wider and deeper (Figure 8(a) and 8(b)), which is the same result as that observed with the laser microscope (Figure 5). Moreover, the faceted surface disappears and showed a round and smooth shape (Figure 8(c) and 8(d)). This structure is related to the adsorption of CO2(g) and its decomposition into oxygen, which is adsorbed on the empty site of the surface of Pt, (θPt(O)), which moves to the interface between YSZ and the Pt electrode during electrolysis. The elementary reactions can be expressed by Eqs. (3)-(6).

Pt surface before experiment after heat treatment at 1,000 °C for 2 h in air.

Surface of Pt cathode after experiment (maximum potential: 2.0 V).
where θPt is the free adsorption site on the Pt surface (or Pt atom having a dangling bond), and θPt(CO2) and θPt(O) are CO2 and O adsorbed on the sites, respectively; δc is a site in the cathode electric double layer within the YSZ neighbouring the Pt electrode, and δc(O2-) is an oxygen ion occupied on the site of the electric double layer.
The gas phase species on the surface of Pt are θPt(CO2) and θPt(O). θPt(O) will migrate to the interface between YSZ and the Pt electrode. The change in surface morphology is related to the migration of θPt(O). Generally, the edge of the facet plane provides an intense adsorption site. When the voltage is applied to the cell, θPt(O) should move toward the interface. The mechanism for this reaction is not exactly known. One possible mechanism is a transfer through the site exchanging reaction (Eq. (7)).
Another possibility is the migration of θPt(O) itself (eq. (8)).
If θPt(O) is moving, a Pt atom will also move together with the adsorbed O atom. This mechanism (eq. (8)) can explain the change in the surface structure of Pt during electrolysis.
Figure 9 shows the cross-sectional image of the interface between the Pt cathode and YSZ when the maximum voltage is 2.0 V. The original interface must be straight [16] between the Pt electrode and YSZ. However, the shape of the interface changed, which means that Pt migrated in the region of YSZ broken by the high voltage. The extent of breakage was significant at 4.0 V as mentioned below. Since the amount of broken YSZ was smaller in this condition (2.0 V), the area of nano-porous Pt layer was also small (Figure 9(b)). The bulk Pt electrode showed a micro-porous structure, which had a 1–5 μm diameter pore size and a 2–10-μm-thick pore wall. As mentioned earlier in this section, the cell performance did not change macroscopically when 2.0 V was applied. However, it was found that the results of AC impedance measurement showed the change in the performance when 1.8 and 2.0 V were applied (Figure 3). In the Nyquist diagram (Figure 3(b)), the right end point means a resistance of YSZ,which is around 4.97 to 4.98 Ωcm–2 at 0.8 V to 1.6 V, os that the YSZ remains an original thickness. On the other hand, in the case of 1.8 V and 2.0 V, the resistance decreased to 4.94 and 4.85 Ωcm–2, respectively, which means that YSZ become thin. This results coincided with the observation of the interface (Figure 9).
Interface between Pt cathode and YSZ after experiment (maximum potential: 2 V).
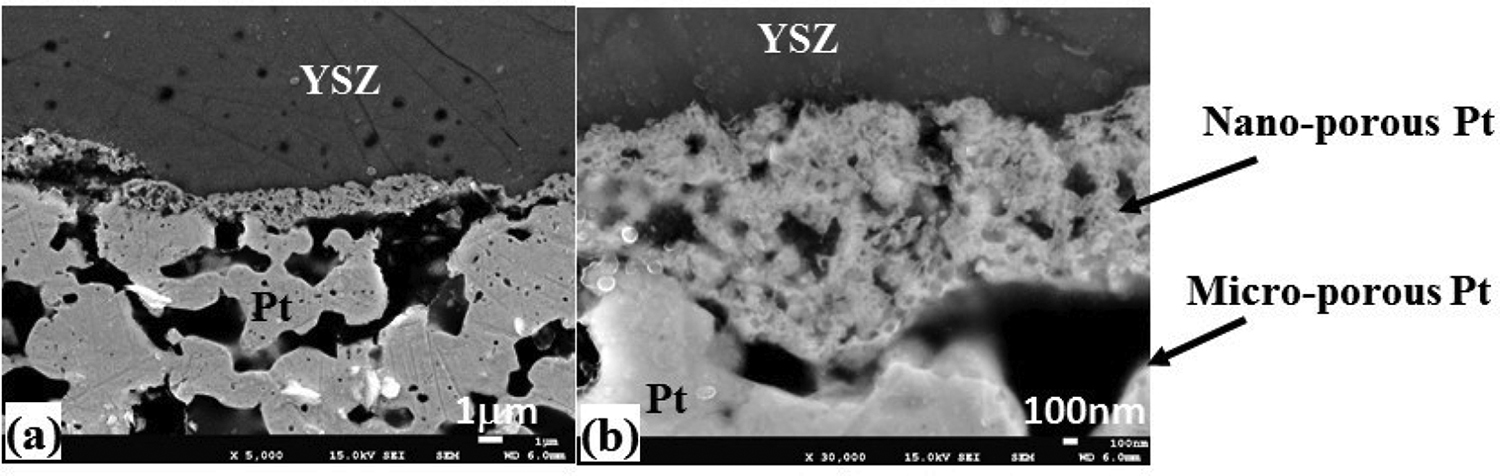
The interface structure changed slightly during electrolysis at 2.0 V. The higher-voltage application (maximum voltage: 4.0 V) was performed and the structure of the interface was examined by FE-SEM. The results are shown in Figure 10. Figure 11 also shows an illustration of nano- and micro-structures corresponding to Figure 10(a). In Figure 10(a), the front of the interface consists of about 1-μm-layer of Pt. Behind this Pt layer, two different structures of Pt exist, one is a finer structure (5 μm in thickness), and the other is a coarser structure (13 μm in thickness). Between these Pt layers, two layers of broken YSZ exist. The broken YSZ was resulted from the breakage of the electric double layer by the high voltage as shown in Figure 12. The energy-dispersive X-ray spectroscopy (EDX) observations show that the Pt layers comprised a mixture of Pt and YSZ. The dimension of the coarse structure increases from the front to the bulk of interface. The finer structure is around 0.5 μm and the coarser one is 1–2 μm. The position of the front Pt layer was magnified one million times (Figure 10(b), 10(c), and 10(d)). It was found that 50–100-nm-ling nano-channels existed in the nano-Pt layer, which was perpendicular to the interface. These channels might provide a passage to the oxygen ion to reach the anode side of YSZ. As shown by eq. (5), the transition reaction from adsorbed oxygen on the Pt surface (θPt(O)) to the site in an electric double layer (θc(O2-)) in YSZ will occur in this position.

Interface between Pt cathode and YSZ after experiment (maximum potential: 4 V). (a) Microscopic image and (b), (c), and (d) are increasing magnifications.

Illustration of nano-structure in the interface between the Pt electrode and YSZ in cathode after the experiment (maximum potential: 4 V).

Reaction mechanism of CO2 electrolysis in cathode and the breakage by high voltage and formation of a new electric double layer.
On the other hand, when the voltage is too high, the electric double layer will be broken, which causes the breakage of YSZ itself. When a part of the YSZ surface is broken, a nano- or micro-space is formed. Consequently, Pt will migrate toward the space and fill it. Hence, the micro-porous structure of Pt and YSZ forms.
In Figure 12, the mechanism of CO2 electrolysis at the cathode is summarized. The breakage of the YSZ surface by high voltage occurs owing to the breakage of the electric double layer. Simultaneously, a Pt atom migrates to the reaction front and fills the broken YSZ gap. Consequently, electron conductivity is improved and the Pt layer consists of a nano-structure. Figure 12(a) shows an illustration corresponding to the elementary reactions (3)–(6). Through the migration of Pt, the gap formed in the broken YSZ layer (Figure 12(b)) is filled with Pt, which has a nano-structure (Figure 12(c)).
Conclusion
Using a simple Pt/YSZ/Pt cell, the mechanism of CO2 electrolysis was investigated. When an overvoltage of 4.0 V was applied, the cell performance increased drastically. In this study, structural changes of the Pt electrode and the interface between YSZ and the Pt electrode were investigated to formulate a clear mechanism for the increase in the current density.
The surface of the Pt electrode became smooth after the experiment.
In addition, the structure of the interface in the cathode consisted of a 1-μm-thick nano-porous Pt layer and a micro-porous structure consisting of a mixture of YSZ and Pt.
A mechanism of CO2 electrolysis was presented to explain the structure change of the Pt electrode at the cathode.
Funding statement: A part of this research was supported by a Grant-in-Aid for Scientific Research B, (No. 24561010), Japan Society for the Promotion of Science (JSPS).
References
[1] S.D. Ebbesen, S.H. Jensen, A. Hauch and M.B. Mogensen, Chem. Rev., 114 (2014) 10697–10734.10.1021/cr5000865Search in Google Scholar PubMed
[2] S.D. Ebbesen and M.J. Mogensen, Power Sources., 193 (2009) 349.10.1016/j.jpowsour.2009.02.093Search in Google Scholar
[3] R.D. Green, C.C. Liu and S.B. Adler, Solid State Ionics., 179 (2008) 647.10.1016/j.ssi.2008.04.024Search in Google Scholar
[4] X.L. Yue and J.T.S. Irvine, Electrochem. Solid-State Lett., 15 (2012) B31.10.1149/2.021203eslSearch in Google Scholar
[5] F. Bidrawn, G. Kim, G. Corre, J.T.S. Irvine, J.M. Vohs and R.J. Gorte, Electrochem. Solid-State Lett., 11 (2008) B167.10.1149/1.2943664Search in Google Scholar
[6] T. Ishihara and T. Kanno, ISIJ Int., 50 (2010) 1291.10.2355/isijinternational.50.1291Search in Google Scholar
[7] T. Ishihara, H. Matsuda and Y. Takita, J. Am. Chem. Soc., 116 (1994) 3801.10.1021/ja00088a016Search in Google Scholar
[8] R. Accorsi and E. Bergmann, J. Electrochem. Soc., 127 (1980) 804.10.1149/1.2129761Search in Google Scholar
[9] A. Brisse, J. Schefold and M. Zahid, Int. J. Hydrogen Energy., 33 (2008) 5375.10.1016/j.ijhydene.2008.07.120Search in Google Scholar
[10] T. Ishihara, J.W. Yan, M. Shinagawa and H. Matsumoto, Electrochim. Acta., 52 (2006) 1645.10.1016/j.electacta.2006.03.103Search in Google Scholar
[11] H.N. Im, S.-Y. Jeon, D.-K. Lim, B. Singh, M. Choi, Y.-S. Yoo, and S.-J. Song, J. Electrochem. Soc., 162 (2015) F54-F59.Search in Google Scholar
[12] P.K. Addo, B. Molero-Sanchez, M. Chen, S. Paulson and V. Birss, Fuel Cells, 15 (2015) 689–696.10.1002/fuce.201400196Search in Google Scholar
[13] H. Fan, M. Keane, P. Singh and M. Han, J. Power Source, 268 (2014) 634–639.10.1016/j.jpowsour.2014.03.080Search in Google Scholar
[14] S.J. Kim and G.M. Choi, Solid State Ionics, 262 (2014) 303–306.10.1016/j.ssi.2014.01.001Search in Google Scholar
[15] S.J. Kim and G.M. Choi, ECS Trans., 57 (2013) 3137–3142.10.1149/05701.3137ecstSearch in Google Scholar
[16] Y. Kashiwaya, Y. Shiomi and T. Nomura, ISIJ Int., 55 (2015) 392–398.10.2355/isijinternational.55.392Search in Google Scholar
© 2018 Walter de Gruyter GmbH, Berlin/Boston
This article is distributed under the terms of the Creative Commons Attribution Non-Commercial License, which permits unrestricted non-commercial use, distribution, and reproduction in any medium, provided the original work is properly cited.
Articles in the same Issue
- Frontmatter
- Research Articles
- Effect of Heat Treatment on Microstructure and Thermal Fatigue Properties of Al-Si-Cu-Mg Alloys
- Effect of Laser Welding Parameters on Weld Bowing Distortion of Thin Plates
- Effect of the Tundish Gunning Materials on the Steel Cleanliness
- Effects of Laser Shock Processing on Impact Toughness of Ti-17 Titanium Alloy
- Effect of Prior Thermomechanical Treatment on Annealed Microstructure and Microhardness in Cobalt-Based Superalloy Co-20Cr-15W-10Ni
- Oxidation Resistance of Austenitic Steels under Thermal Shock Conditions in an Environment Containing Water Vapor
- Comparative Evaluation of Spark Plasma and Conventional Sintering of NiO/YSZ Layers for Metal-Supported Solid Oxide Fuel Cells
- Present Situation and Prospect of EAF Gas Waste Heat Utilization Technology
- Formation of Nano-porous Structure in a Cathode at the Interface between Pt Electrode and YSZ during CO2 Electrolysis at 1,000 °C
- Numerical Simulation of Inclusion Capture in the Slab Continuous Casting Considering the Influence of the Primary Dendrite Arm Spacing
- Effect of Surface Fe-Sn Intermetallics on Oxide Films Formation of Stainless Steel in High Temperature Water