Optimizing recognition models for wood species identification using multi-spectral techniques
-
Chengxuan Li


Abstract
The identification of wood species is critical for effective forest management and conservation. However, existing methods frequently neglect the potential benefits of integrating multiple spectral properties. Current research often relies on uniform feature selection and modelling methods, despite the fact that each spectral technique has its own optimal recognition model. This study aims to address the gap in THz, NIR, and HSI data, systematically comparing these techniques to derive the best recognition models. This study employed the SNV transformation to preprocess the spectral data of four coniferous and one broad-leaved species. Subsequently, relevant frequency features were filtered using competitive adaptive weighting (CARS), uninformative variable elimination (UVE), and successive projections algorithm (SPA) to reduce dimensionality and enhance recognition efficacy. A comparative analysis of five algorithms – extreme learning machines (ELM), support vector machines (SVM), random forests (RF), long short-term memory networks (LSTM), and convolutional neural networks (CNN) – was conducted to identify the optimal recognition models. The results demonstrated impressive accuracy rates: 96.7 % for NIR (UVE + CARS + ELM), 96.7 % for HSI (CARS + LSTM), and 98.3 % for THz (SPA + RF). This analysis identifies the most effective models for each spectral type, advancing the field of spectral wood identification.
1 Introduction
Wood, a widespread biological composite material, plays a significant role in both industrial production and daily life. However, the global rise in illegal logging and trade presents a severe challenge to forest ecosystems and societal stability. This issue not only distorts market but also exacerbates economic instability and accelerates environmental degradation (Lowe et al. 2016). Therefore, the development of wood identification methods is of great practical significance for the identification of regulated species, the regulation of the wood trade market, and the rational and effective use of wood resources (Duchesne et al. 2023).
Traditional wood identification techniques can be broadly categorized into three groups: simple macro-identification, combined macro- and micro-identification, and methods based on physical or chemical analyses. Although these methods enable a certain degree of anatomical wood identification, they suffer from several limitations. The processes involved are labor-intensive, time-consuming, and require a high level of expertise, often resulting in low identification accuracy. Moreover, these methods frequently cause varying degrees of damage during the identification process, rendering them unsuitable for rare or high-value wood species, such as mahogany. Therefore, there is an urgent need for rapid, efficient, and non-destructive techniques for wood identification. The advancement and maturity of modern spectroscopic technologies offer a promising solution to this challenge. The most commonly utilized spectral bands for wood identification currently include NIR, HSI, and THz spectroscopy.
NIR spectroscopy is an effective technique for measuring the physicochemical properties of organic substances containing hydrogen groups (Nasir et al. 2023; Schimleck et al. 2023). By recording the overtone and combination frequency absorption information of chemical bond vibrations, such as C–O, O–H, and N–H, NIR spectroscopy provides valuable information for the analysis of organic compounds (Wang et al. 2022). It has gained widespread use as a prominent detection method in various fields (Lazarescu et al. 2016; Mishra et al. 2021). Pace et al. (2019) performed data downscaling and classified the NIR spectra of 12 Brazilian wood species using partial least squares discriminant analysis with an accuracy of 93.2 %. Gonçalves et al. (2021) used NIR spectroscopy and combined it with principal component analysis to extract features to successfully achieve taxonomic identification of wood from archaeological sites. Zhou et al. (2019) developed an efficient online tree species classification system by integrating NIR spectral analysis with advanced chemometrics methods, enabling the identification of the green wood samples of western hemlock and mountain fir. However, due to the high homogeneity requirement of NIR spectral samples, model applicability limitations, and the fact that commonly used variable selection algorithms suffer from some problems like excessive algorithmic complexity and the tendency to fall into local optimums (Chen et al. 2020; Ren et al. 2020), the importance of complementing with other detection methods comes to the fore.
Hyperspectral imaging represents one of the most advanced non-destructive testing techniques, as it simultaneously captures both spectral and spatial information of an object. This method is distinguished by its ability to generate an image for each spectral band, allowing for the comprehensive analysis of an object’s unique spectral properties while preserving its spatial characteristics. This dual capability, often referred to as “one image per spectrum,” enables the concurrent collection of spectral data and spatial image features, making hyperspectral imaging particularly valuable for complex material analysis. Based on the principal component (PC) images derived from the PC scores of the hyperspectral images, Kanayama et al. (2019) built a deep learning prediction model to produce successful classification outcomes. Henriksen et al. (2022) applied unsupervised machine learning on short wave infrared hyperspectral data to build a model for classification of plastics. The model can successfully distinguish between twelve plastics (PE, PP, PET, PS, PVC, PVDF, POM, PEEK, ABS, PMMA, PC, and PA12) and the utility is further proven by recognizing three unknown samples (PS, PMMA, PC). Hycza et al. (2018) used hyperspectral images of a forest stand in northeastern Poland as a study object and used nine classification algorithms to classify seven tree species, and obtained a 90.3 % correct rate, indicating that hyperspectral images of the jungle can enable the accurate categorization of tree species in the forest.
THz spectroscopy has emerged as a promising technique owing to its short wavelength and non-ionizing characteristics, which allows for deep penetration into many materials without causing radiation damage or ionizing effects. Additionally, its high optical resolution enables the detection of nanoscale structures in a non-destructive manner. Trafela et al. (2013) demonstrated the potential of THz spectroscopy in the chemical characterization of complex organic materials of natural origin by quantitatively determining the chemical and mechanical properties of his torical papers. Inagaki et al. (2014) carried out lineage density determination of 46 distinct wood species by THz time-domain spectroscopy and quantified the relationship between the density and THz dielectric properties of the wood. In 2019, Krügener et al. (2019) analyzed THz time-domain spectra of 17 typical European-grown woods, and the results of the analysis showed that THz spectroscopy is an excellent method for non-destructive evaluation of conifers and shows considerable analytical potential.
NIR spectroscopy is widely used for the rapid, non-destructive testing of wood (Ayanleye and Avramidis 2020; Zhou et al. 2020), However, its spectral reflectance characteristics for similar species can lead to the phenomenon of “foreign objects with identical spectra,” which may negatively impact classification accuracy. While HSI offers advantages over NIR, such as a great number of spectral bands and higher spectral resolution, it is limited in its ability to detect key biomolecules in wood, including cellulose and lignin. THz spectroscopy, on the other hand, is capable of detecting and quantitatively analyzing substances, making it highly valuable for characterizing the physical and chemical properties of materials, as well as for compositions fingerprinting their unique spectral signatures. However, the advanced equipment required for THz research is primarily designed for laboratory environments, which may limit its applicability under field conditions and hinder the broader implementation of its practical applications. Additionally, the effective use of THz technology requires a solid understanding of data processing and statistical analysis, placing additional demands on the expertise of operators.
Despite the fact that researchers have conducted numerous studies on wood recognition using each of these spectral techniques, no study has ever directly compared the effectiveness of these three spectra in wood recognition; in our previous research work, we did so for NIR spectroscopy, HSI spectral information, and THz spectroscopy, but using the same feature selection and modelling methods. However, each spectral technique has its own optimal recognition model. Therefore, in this paper’s study, we used specific feature selection methods for the three spectra, and efficient feature capture for HSI spectra, NIR spectra, and THz spectra using competitive adaptive reweighted sampling, non-informative variable rejection, and continuous projection algorithms, respectively. Subsequently, the obtained data were passed through ELM, SVM, LSTM, RF, and CNN five recognition models, trained in multiple iterations to obtain the most suitable recognition model for the respective spectra, aiming to be more efficient and accurate for wood recognition, and comprehensively discussed to seek the wood classification model with the highest recognition accuracy suitable for the three spectra.
2 Materials and methods
2.1 Experimental material
In this study, four species of Pinaceae coniferous wood and one species of broadleaf wood were collected from the Hadamen Township woodland in Hunchun City, Jilin Province, China. The wood samples were harvested from the trunk at a height of approximately 1.3 m, and precisely cut into discs using a precision cutter. A total of 40 samples were obtained from each of the five species, resulting in a comprehensive set of 200 wood chip samples, each measuring 50 mm × 50 mm × 5 mm in thickness. To minimize the impact of moisture on the THz experiment, all wood specimens were naturally dried in the same atmospheric environment until they reached a dry state (25.66 + 1.01 °C).
Figure 1 depicts a representative image of the wood samples used in the experiments. To facilitate data analysis, the collected wood feature data is partitioned into training and test sets using the Kennard-Stone algorithm, which ensures that the most representative samples are selected for model training while minimizing overlap between sets. The dataset was divided with a 7:3 ratio for training and test purposes, respectively. Table 1 displays the breakdown of the dataset results.

Wood sample of (a) Tilia tuan, (b) Pinus sylvestris, (c) Pinus tabuliformis, (d) Pinus koraiensis, and (e) Larix gmelinii.
Results of dataset segmentation.
| Wood species | Tab | Training set | Test set |
|---|---|---|---|
| Tilia tuan Szyszyl | 1 | 28 | 12 |
| Pinus sylvestris | 2 | 28 | 12 |
| Pinus tabuliformis | 3 | 28 | 12 |
| Pinus koraiensis | 4 | 28 | 12 |
| Larix gmelinii | 5 | 28 | 12 |
| Total | 140 | 60 |
2.2 Experimental instruments
In this study, three spectroscopic instruments were employed to obtain spectral data from wood samples.
Firstly, an MPA II NIR spectrometer (Bruker, Germany) was used to acquire NIR spectra of wood samples, as illustrated in Figure 2. The instrument operates over a wavelength range of 800–2,800 nm and is capable of performing 32 scans per measurement. All measurements were conducted in diffuse reflectance mode, with each locus subjected to 32 automated scans, taking approximately 10 s per scan. Three parallel experiments were carried out for each specimen, and the spectra obtained were averaged to mitigate random errors.
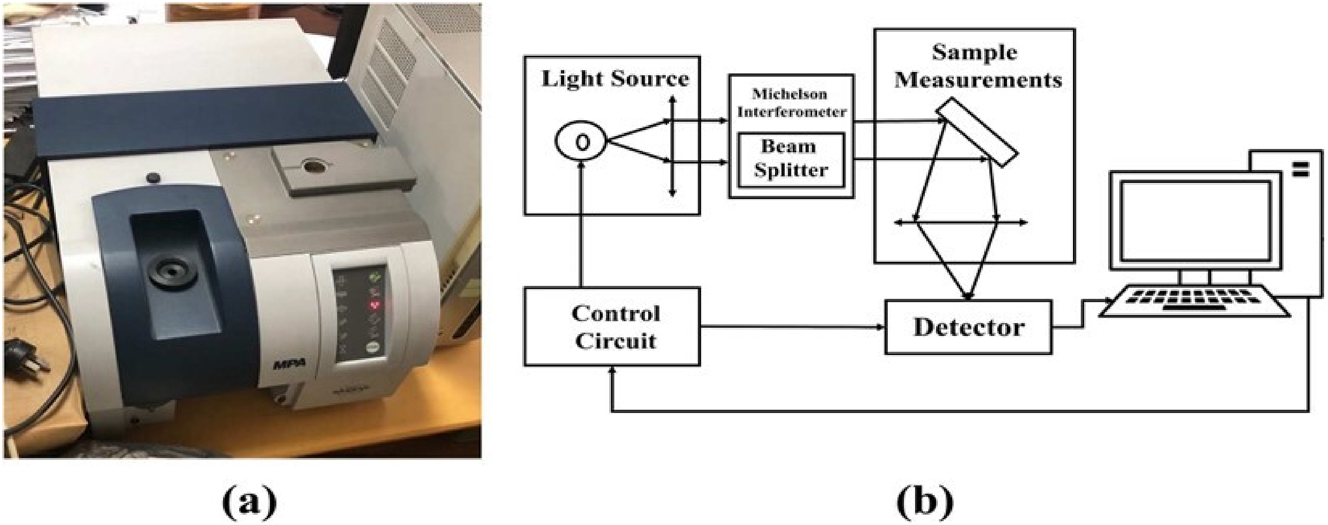
NIR instrument: (a) NIR system, and (b) the schematic diagram of NIR system.
In addition, a SOC710VP hyperspectral imaging system was employed for hyperspectral data acquisition. The system consists of an imaging spectrometer, CCD imaging lens, halogen lights, and an upper computer for data processing (Figure 3). This setup enables fixed-point, long-term continuous measurement and offers functionalities such as visual focusing and rapid imaging, which are highly suitable for microscopic and biochemical investigation.

Hyperspectral instrument: (a) hyperspectral imaging system, and (b) the schematic diagram of hyperspectral imaging system.
Furthermore, THz-TDS was conducted using the TERA K15 equipment (Menlo Systems, Germany). This system was selected due to its superior performance in capturing THz spectral information for thin samples, such as the wood slices used in this study, which had dimensions of 50 mm × 50 mm × 5 mm. The transmission THz-TDS system, illustrated in Figure 4, provides high-resolution spectra by transmitting THz radiation through the samples.

THz-TDS instrument: (a) THz-TDS system, and (b) the schematic diagram of THz-TDS system.
The instrument employed in this study offers a spectral resolution of 0.011 THz, a dynamic range of 70 dB, and a scanning range of 300 ps. Additional specifications include a pulse duration of less than 90 fs and an average output power exceeding 60 mW. The system operates within a spectral range of 0–3.5 THz. Before collecting sample data, reference spectra were acquired using dry air as the medium. The time-domain signal of each wood sample was subsequently transformed into the frequency domain through a Fast Fourier Transform (FFT) for analysis. Data were collected at three distinct locations – the top, middle, and bottom of each sample. The final spectrum for each specimen was determined by averaging these data points. THz absorption coefficients were calculated by employing the optical parameter model proposed by Dorney et al. (2001), based on the characteristics of the THz frequency domain spectrum.
2.3 Spectral pre-processing
Spectral data are often affected by various noise sources, including baseline fluctuations, electrical noise, and environmental disturbances, which can compromise the reliability of subsequent analysis. To mitigate these issues and enhance the identification and quantification of spectral features, data preprocessing techniques such as smoothing, baseline correction, and noise filtering are commonly employed. In this study, the Standard Normal Variate (SNV) transformation was applied to minimize the effects of scattering and spectral noise, thus improving the quality and interpretability of the spectra.
The SNV transformation is a commonly used method for spectral correction, particularly effective in mitigating scattering effects and baseline deviations. In this study, the SNV transform was applied to correct the spectral data. The process involves calculating the mean value of each individual spectrum, subtracting it from the spectral data, and then dividing the result by the standard deviation of the spectrum. This normalization adjusts the spectrum by minimizing variations due to scattering and other interferences.
A feature selection technique is essential for optimizing the selection of spectral bands, as raw spectra contain redundant information across numerous spectral characteristics. In this study, the NIR spectra, due to their high dimensionality and numerous bands, were processed using a combination of UVE and CARS algorithms. These methods have proven effective in selecting the most informative bands, reducing data redundancy, and improving model performance. The number of bands in HSI information data is also large, and the redundant features are obvious, using CARS can effectively improve the ability of high-dimensional data processing, redundant feature removal and classification performance enhancement. For THz spectra, where the number of bands is typically smaller, the SPA was employed for feature selection. This decision is based on previous findings (Wang et al. 2019), which achieved recognition accuracy of 96 % in wood identification after applying SPA to screen THz spectral data. Therefore, SPA is particularly well-suited for the THz spectrum in this study, facilitating efficient feature extraction and enhancing the model’s predictive accuracy.
The CARS algorithm is a feature selection technique that integrates partial least squares (PLS) techniques with Monte Carlo sampling, effectively optimizing the identification of relevant spectral features (Li et al. 2009). In CARS, adaptive reweighted sampling (ARS) is employed to iteratively select a subset of points based on the regression coefficients derived from the PLS model. Specifically, the absolute values of these coefficients guide the selection process, where points with higher weights are retained, and those with lower weights are progressively eliminated. This adaptive process continues over multiple iterations, each constructing a new PLS model on the remaining subset of points. At each iteration, the wavelength with the smallest cross-validated root-mean-square error (RMSE) is identified and chosen as the feature wavelength.
The UVE algorithm is a variable selection method based on PLS analysis. It uses the intrinsic correlations within the sample data to remove the uninformative variables based on the magnitude of their contribution value, resulting in a reduction in the degree of data redundancy. UVE works by randomly partitioning the original training dataset into sub-datasets through cross-validation. Uninformative features were systematically removed by assessing the contribution value of each variable, leaving only the most significant variables for further analysis.
Additionally, the SPA is employed as a forward variable selection technique. SPA operates by projecting each wavelength onto other wavelengths and comparing the magnitude of the resulting projection vectors. Through this iterative process, SPA identifies the final set of feature wavelengths based on their relevance to the model, ensuring that the selected variables possess the least covariance and redundancy. This approach effectively enhances the precision of spectral analysis by isolating the most informative wavelengths, improving the model’s interpretability and predictive power.
2.4 Recognition model
The optimal recognition models for the NIR spectrum, HSI spectrum, and THz spectrum were identified through a comparative analysis of the accuracies of five different wood species in both training and test sets, utilizing five commonly employed models: THz: SPA + RF, HSI: CARS + LSTM, and NIR: UVE + CARS + ELM.
ELM is characterized as a single hidden layer feedforward neural network characterized that employs randomly chosen input layer parameters. This model minimizes the loss function to determine the connection weights between the hidden and output layers, based on Moore–Penrose theory. Owing to its reduced number of training parameters, ELM facilitates rapid learning, exhibits a lower tendency for overfitting, and demonstrates enhanced generalization capabilities.
LSTM networks represent a specialized variant of Recurrent Neural Network (RNN) that incorporate gating units to mitigate the issues of gradient vanishing and explosion, which are commonly encountered in traditional RNNs. Consequently, LSTM are well-suited for effectively processing significant events that occur over extended time intervals and temporal delays in time series data.
RF is an ensemble classifier that utilizes multiple decision trees, with the mode of the classifications produced by each tree determining the final output categories. This algorithm was developed by Leo Breiman and Adele Cutler, who also trademarked the term “Random Forests.” In addition to facilitating dimensionality reduction, Random Forests are applicable to both classification and regression problems. They outperform individual decision trees in prediction and classification tasks and exhibit strong resilience to noise and outliers.
3 Results and discussion
3.1 Analysis of spectra
The analysis was conducted over a wavelength range from 800 to 2,787 nm, with wavelength plotted on the horizontal axis and reflectance on the vertical axis. Figure 5 presents a comparison of the NIR spectra before and after SNV processing. The spectral curves of the five wood species exhibit significant overlap in the 800–1,400 nm region, as demonstrated by the original spectra in Figure 5, which complicates the identification. In contrast, the SNV-treated spectra reveal a more distinct separation among the five curves in the regions of 1,500–1,600 nm, 2,300–2,400 nm, and 2,500–2,700 nm, compared to the other spectral bands.

NIR absorption coefficient of wood samples: (a) the original spectra, (b) the spectra pre-processed by SNV.
The comparison of HSI between the original and SNV-treated spectra is illustrated in Figure 6, where reflectance is plotted on the vertical axis and wavelength ranges from 370 to 1,035 nm on the horizontal axis. The spectral curves of the five wood species show considerable similarity in the 400–1,000 nm range, exhibiting an increasing trend in the 400–850 nm band. Beyond 850 nm, the spectral curves gradually flatten or even decline, with no noticeable absorption peaks observed. This suggests that the material composition of the five wood species is approximately similar. Notably, the spectral curves of Larix gmelinii are more distinctive compare to those of the other four species.

HSI spectral information reflectance spectra of wood samples: (a) the original spectra, (b) the spectra pre-processed by SNV.
Figure 7 compares the THz absorption coefficient spectra of the raw and SNV-treated samples, with frequency plotted on the horizontal axis and absorption coefficient on the vertical axis. The THz absorption coefficient spectra of the five wood species do not exhibit significant overlap in the 0.2–1 THz range. Notably, the absorption coefficient spectrum of L. gmelinii displays a distinct position for its absorption peak relative to the other four species. Additionally, the five species demonstrate markedly in the intensity of their absorption coefficients, ranked as follows: Tilia tuan Szyszyl, L. gmelinii, Pinus koraiensis, Pinus tabuliformis, and Pinus sylvestris.

THz absorption coefficient of wood samples: (a) the original spectra, (b) the spectra pre-processed by SNV.
3.2 Feature selection
To achieve optimal recognition results, this study employs multiple algorithms for the selection of distinct features based on three spectral types: THz, HSI, and NIR.
The CARS algorithm was employed for secondary dimensionality reduction, successfully reducing the dimensionality of feature variable to 51, which accounts for 4.42 % of the total feature bands. This final accuracy surpasses that obtained by independently applying the CARS and UVE algorithms. Initially, the NIR spectrum was processed using the UVE algorithm. However, due to the high dimensionality of the NIR bands, 577 features remained after selection, complicating subsequent data processing.
Owing to the benefits of the CARS algorithm in screening features from HSI data (Masia et al. 2015), this method was similarly for feature selection within the HSI spectrum. Following the screening process, 39 feature bands – representing 30.47 % of the total – were identified, with the majority concentrated between 800 and 1,000 nm in wavelength.
For THz frequency bands, the SPA method was utilized due to its exceptional performance in THz frequency selection (Wang et al. 2019). After applying the SPA algorithm, 15 feature bands – accounting for 9.20 % of the total – were identified. These bands were primarily distributed in the 0.2–0.6 THz range.
3.3 Analysis of model results
To develop the optimal recognition model for each of the three feature-extracted spectra, the most suitable methods were selected and integrated with the corresponding feature extraction algorithms.
3.3.1 Recognition models for NIR spectra
Five widely recognized models – ELM, LSTM, RF, CNN, and SVM – were applied to the NIR spectral data obtained through the UVE + CARS method, as presented in the previous section. This analysis aimed to determine the model that provides the best recognition performance. Among the five wood species, T. tuan Szyszyl and L. gmelinii are generally more easily identifiable, as shown in Table 2. The average recognition accuracy of the SVM model across the five models was only 71.4 %, which can be attributed to significant spectral overlap among the wood types. In contrast, the ELM model demonstrates superior recognition performance, achieving an accuracy of 100.0 % in the training set and 96.7 % in the test set. CNN, LSTM, and ELM all exhibited high accuracy, exceeding 90 %. Figure 8 illustrates the recognition performance of the five wood species following the application of the ELM model, which resulted in a recognition accuracy of 96.7 %. According to the results, only two of the 60 samples in the test set exhibited misclassification.
Comparison of five recognition models for five wood species in NIR spectroscopy.
| Wood species | Recognition models | Training set (%) | Testing set (%) |
|---|---|---|---|
| Tilia tuan Szyszyl | ELM | 100.0 | 100.0 |
| SVM | 83.9 | 78.2 | |
| LSTM | 100.0 | 99.0 | |
| RF | 95.7 | 88.2 | |
| CNN | 100.0 | 100.0 | |
| Pinus sylvestris | ELM | 100.0 | 98.4 |
| SVM | 80.8 | 73.9 | |
| LSTM | 100.0 | 100.0 | |
| RF | 93.9 | 81.4 | |
| CNN | 100.0 | 100.0 | |
| Pinus tabuliformis | ELM | 100.0 | 100.0 |
| SVM | 75.5 | 76.0 | |
| LSTM | 100.0 | 91.9 | |
| RF | 98.1 | 75.8 | |
| CNN | 100.0 | 92.9 | |
| Pinus koraiensis | ELM | 100.0 | 97.1 |
| SVM | 68.7 | 59.8 | |
| LSTM | 100.0 | 94.4 | |
| RF | 95.5 | 82.6 | |
| CNN | 100.0 | 91.3 | |
| Larix gmelinii | ELM | 100.0 | 94.5 |
| SVM | 85.2 | 69.0 | |
| LSTM | 100.0 | 96.8 | |
| RF | 89.6 | 80.2 | |
| CNN | 100.0 | 92.5 |

Recognition results of ELM for five wood species in the NIR spectrum.
3.3.2 Recognition models for HSI information
Five widely utilized recognition models – ELM, LSTM, RF, CNN, and SVM – were applied to the hyperspectral imaging (HSI) data acquired through the CARS method to achieve optimal recognition results. Among the five wood species, T. tuan Szyszyl and L. gmelinii are comparatively easier to identify, as indicated in Table 3. SVM performs poorly in both the hyperspectral and near-infrared spectra, probably because the hyperspectral and near-infrared spectra share some common bands. The CNN, LSTM, and RF models demonstrate the highest recognition accuracy. The training set accuracy stabilizes at 100 % after 600 iterations with an LSTM layer of six and a maximum of 1,000 iterations, while the test set accuracy stabilizes at 96.7 % after 1,000 iterations. The recognition performance of the five wood species following the LSTM model is displayed in Figure 9, with only two of the 60 samples in the test set identified as misclassified.
Comparison of five recognition models for five wood species with HSI information.
| Wood species | Recognition models | Training set (%) | Testing set (%) |
|---|---|---|---|
| Tilia tuan Szyszyl | ELM | 100.0 | 98.4 |
| SVM | 87.8 | 84.6 | |
| LSTM | 100.0 | 100.0 | |
| RF | 100.0 | 100.0 | |
| CNN | 100.0 | 100.0 | |
| Pinus sylvestris | ELM | 100.0 | 88.3 |
| SVM | 90.6 | 82.1 | |
| LSTM | 100.0 | 96.0 | |
| RF | 100.0 | 90.8 | |
| CNN | 100.0 | 97.8 | |
| Pinus tabuliformis | ELM | 100.0 | 84.5 |
| SVM | 89.1 | 84.4 | |
| LSTM | 100.0 | 92.8 | |
| RF | 98.5 | 94.8 | |
| CNN | 100.0 | 92.7 | |
| Pinus koraiensis | ELM | 93.9 | 87.1 |
| SVM | 92.7 | 79.8 | |
| LSTM | 100.0 | 100.0 | |
| RF | 100.0 | 100.0 | |
| CNN | 100.0 | 98.9 | |
| Larix gmelinii | ELM | 92.6 | 96.8 |
| SVM | 83.1 | 91.0 | |
| LSTM | 100.0 | 100.0 | |
| RF | 100.0 | 97.1 | |
| CNN | 98.5 | 100.0 |

Recognition results of LSTM for five wood species with HSI information.
3.3.3 Recognition models for THz spectrum
To achieve optimal recognition results, five widely utilized models – ELM, LSTM, RF, CNN, and SVM – were applied to the THz spectral data obtained through the SPA described in the previous section. Table 4 illustrates that the THz spectrum exhibits superior recognition accuracy compared to both the NIR and HSI spectral types. Furthermore, no discernible variation in recognition performance was observed among the five wood species, as all models achieved accuracy levels exceeding 90 %. These findings suggest that the THz spectrum is more readily recognized than both the NIR spectrum and the hyperspectral data. With 50 decision trees, the error decreases to 0.02 when the number of trees reaches 35. The RF model demonstrated the highest recognition accuracy, achieving 98.3 % in the test set and 100 % in the training set. The recognition performance of the five wood types following RF model application is depicted in Figure 10. The results indicate that, out of the 60 test set samples, only one sample exhibited misclassification.
Comparison of five recognition models for five species of wood in the THz spectrum.
| Wood species | Recognition models | Training set (%) | Testing set (%) |
|---|---|---|---|
| Tilia tuan Szyszyl | ELM | 100.0 | 94.5 |
| SVM | 99.3 | 96.3 | |
| LSTM | 99.3 | 97.2 | |
| RF | 100.0 | 100.0 | |
| CNN | 100.0 | 96.0 | |
| Pinus sylvestris | ELM | 98.8 | 92.1 |
| SVM | 100.0 | 95.1 | |
| LSTM | 98.9 | 94.0 | |
| RF | 100.0 | 98.8 | |
| CNN | 100.0 | 100.0 | |
| Pinus tabuliformis | ELM | 97.9 | 94.3 |
| SVM | 98.4 | 94.9 | |
| LSTM | 97.0 | 91.8 | |
| RF | 100.0 | 97.8 | |
| CNN | 100.0 | 94.7 | |
| Pinus koraiensis | ELM | 100.0 | 93.7 |
| SVM | 99.1 | 98.8 | |
| LSTM | 99.0 | 95.8 | |
| RF | 100.0 | 100.0 | |
| CNN | 100.0 | 98.5 | |
| Larix gmelinii | ELM | 100.0 | 100.0 |
| SVM | 97.7 | 93.0 | |
| LSTM | 98.5 | 90.6 | |
| RF | 100.0 | 95.4 | |
| CNN | 100.0 | 95.0 |

Recognition results of RF for five wood species in the THz spectrum.
Following a comparison of five models – CNN, SVM, LSTM, RF, and ELM – the findings indicated that L. gmelinii and T. tuan Szyszyl were more readily identifiable. The feature-selected ELM model for the NIR spectral data achieved 100 % identification accuracy on the training set and 96.7 % on the test set. Similarly, the LSTM model demonstrated robust performance in the analysis of hyperspectral data, maintaining a constant accuracy of 100 % in the training set and 96.7 % in the test set. In contrast, all models achieved identification rates exceeding 90 % when applied to THz spectrum data, with the RF model showing the highest accuracy at 100 % in the training set and 98.3 % in the test set. Overall, the results suggest that THz spectra perform more effectively in wood recognition compared to both NIR and HSI data.
4 Conclusions
In this study, three spectral datasets – NIR, HSI, and THz – were collected from the forestland of Hadamen Township, Hunchun City, Jilin Province. These datasets were pre-processed using SNV transformation, after which the three spectra were feature-engineered and modeled to facilitate identification. Ultimately, the three optimal identification models were established: THz using SPA combined with RF, HSI utilizing CARS combined with LSTM, and NIR employing UVE combining with CARS and ELM, achieving respective accuracies of 96.7, 96.7, and 98.3 % on their test sets. Additionally, the CNN demonstrated an overall accuracy exceeding 95 % across all three spectral datasets. A comprehensive analysis of the optimal models for the three spectra was conducted to compare the identification effectiveness of different models, thereby enhancing accuracy in wood species identification.
Acknowledgments
This work was supported by School of Technology, Beijing Forestry University, Beijing, People’s Republic of China, Research Center for Biodiversity Intelligent Monitoring, Beijing Forestry University, Beijing, People’s Republic of China, Joint International Research Institute of Wood Nondestructive Testing and Evaluation, Beijing Forestry University, Beijing, People’s Republic of China.
-
Research ethics: Not applicable.
-
Informed consent: Not applicable.
-
Author contributions: The authors have accepted responsibility for the entire content of this manuscript and approved its submission.
-
Use of Large Language Models, AI and Machine Learning Tools: None declared.
-
Conflict of interest: The authors state no conflict of interest.
-
Research funding: None declared.
-
Data availability: Not applicable.
References
Ayanleye, S. and Avramidis, S. (2020). Predictive capacity of some wood properties by near-infrared spectroscopy. Int. Wood Prod. J. 12: 83–94, https://doi.org/10.1080/20426445.2020.1834312.Suche in Google Scholar
Chen, Y., Ma, H., Zhang, Q., Zhang, S., Chen, M., and Wu, Y. (2020). Comparison of several variable selection methods for quantitative analysis and monitoring of the Yangxinshi tablet process using near-infrared spectroscopy. Infrared Phys. Technol. 105: 103188, https://doi.org/10.1016/j.infrared.2020.103188.Suche in Google Scholar
Dorney, T.D., Baraniuk, R.G., and Mittleman, D.M. (2001). Material parameter estimation with terahertz time-domain spectroscopy. J. Opt. Soc. Am. A 18: 1562–1571, https://doi.org/10.1364/JOSAA.18.001562.Suche in Google Scholar PubMed
Duchesne, I., Lamichhane, D., Dias, R., de la Mata, A.P., Williams, M., Lamothe, M., Harynuk, J., Isabel, N., and Cloutier, A. (2023). Comparing GC×GC-TOFMS-based metabolomic profiling and wood anatomy for forensic identification of five Meliaceae (mahogany) species. Wood Fiber Sci. 55: 53–82, https://doi.org/10.22382/wfs-2023-07.Suche in Google Scholar
Gonçalves, T.A.P., Navarro, A.G., Nisgoski, S., and Sonsin-Oliveira, J. (2021). The trees of the Water People: archeological waterlogged wood identification and near-infrared analysis in Eastern Amazonia. Wood Sci. Technol. 55: 991–1011, https://doi.org/10.1007/s00226-021-01288-4.Suche in Google Scholar
Henriksen, M.L., Karlsen, C.B., Klarskov, P., and Hinge, M. (2022). Plastic classification via in-line hyperspectral camera analysis and unsupervised machine learning. Vib. Spectrosc. 118: 103329, https://doi.org/10.1016/j.vibspec.2021.103329.Suche in Google Scholar
Hycza, T., Stereńczak, K., and Bałazy, R. (2018). Potential use of hyperspectral data to classify forest tree species. N. Z. J. For. Sci. 48: 1–13, https://doi.org/10.1186/s40490-018-0123-9.Suche in Google Scholar
Inagaki, T., Hartley, I.D., Tsuchikawa, S., and Reid, M. (2014). Prediction of oven-dry density of wood by time-domain terahertz spectroscopy. Holzforschung 68: 61–68, https://doi.org/10.1515/hf-2013-0013.Suche in Google Scholar
Kanayama, H., Ma, T., Tsuchikawa, S., and Inagaki, T. (2019). Cognitive spectroscopy for wood species identification: near infrared hyperspectral imaging combined with convolutional neural networks. Analyst 144: 6438–6446, https://doi.org/10.1039/C9AN01180C.Suche in Google Scholar
Krügener, K., Sommer, S., Stübling, E., Jachim, R., Koch, M., and Viöl, W. (2019). THz properties of typical woods important for European forestry. J. Infrared, Millim. Terahertz Waves 40: 1–5, https://doi.org/10.1007/s10762-019-00601-4.Suche in Google Scholar
Lazarescu, C., Hart, F., Pirouz, Z., Panagiotidis, K., Mansfield, S.D., Barrett, J.D., and Avramidis, S. (2016). Wood species identification by near-infrared spectroscopy. Int. Wood Prod. J. 8: 32–35, https://doi.org/10.1080/20426445.2016.1242270.Suche in Google Scholar
Li, H., Liang, Y., Xu, Q., and Cao, D. (2009). Key wavelengths screening using competitive adaptive reweighted sampling method for multivariate calibration. Anal. Chim. Acta 648: 77–84, https://doi.org/10.1016/j.aca.2009.06.046.Suche in Google Scholar PubMed
Lowe, A.J., Dormontt, E.E., Bowie, M.J., Degen, B., Gardner, S., Thomas, D., Clarke, C., Rimbawanto, A., Wiedenhoeft, A., Yin, Y., et al.. (2016). Opportunities for improved transparency in the timber trade through scientific verification. BioScience 66: 990–998, https://doi.org/10.1093/biosci/biw129.Suche in Google Scholar
Masia, F., Karuna, A., Borri, P., and Langbein, W. (2015). Hyperspectral image analysis for CARS, SRS, and Raman data. J. Raman Spectrosc. 46: 727–734, https://doi.org/10.1002/jrs.4729.Suche in Google Scholar PubMed PubMed Central
Mishra, P., Herrmann, I., and Angileri, M. (2021). Improved prediction of potassium and nitrogen in dried bell pepper leaves with visible and near-infrared spectroscopy utilising wavelength selection techniques. Talanta 225: 121971, https://doi.org/10.1016/j.talanta.2020.121971.Suche in Google Scholar PubMed
Nasir, V., Schimleck, L., Abdoli, F., Rashidi, M., Sassani, F., and Avramidis, S. (2023). Quality control of thermally modified western hemlock wood by NIR spectroscopy and explainable machine learning. Polymers 15: 4147, https://doi.org/10.3390/polym15204147.Suche in Google Scholar PubMed PubMed Central
Pace, J.-H.C., Latorraca, J.-V.F., Hein, P.-R.G., Carvalho, A.M., Castro, J.P., and Silva, C.-E.S. (2019). Wood species identification from Atlantic forest by near infrared spectroscopy. For. Syst. 28: e105, https://doi.org/10.5424/fs/2019283-14558.Suche in Google Scholar
Ren, G., Wang, Y., Ning, J., and Zhang, Z. (2020). Highly identification of keemun black tea rank based on cognitive spectroscopy: near infrared spectroscopy combined with feature variable selection. Spectrochim. Acta, Part A, Mol. Biomol. Spectrosc. 230: 118079, https://doi.org/10.1016/j.saa.2020.118079.Suche in Google Scholar PubMed
Schimleck, L., Ayanleye, S., Avramidis, S., and Nasir, V. (2023). A chemistry-based explainable machine learning model based on NIR spectra for predicting wood properties and understanding wavelength selection. Wood Mater. Sci. Eng. 18: 2116–2127, https://doi.org/10.1080/17480272.2023.2265349.Suche in Google Scholar
Trafela, T., Mizuno, M., Fukunaga, K., and Strlič, M. (2013). Quantitative characterisation of historic paper using THz spectroscopy and multivariate data analysis. Appl. Phys. A 111: 83–90, https://doi.org/10.1007/s00339-012-7525-y.Suche in Google Scholar
Wang, Y., She, S., Zhou, N., Jia, P., and Zhang, J. (2019). Classification of terahertz rosewood based on continuous projection algorithm and random forest. Spectrosc. Spectral Anal. 39: 2719–2724.Suche in Google Scholar
Wang, Y., Xiang, Z., Tang, Y., Chen, W., and Xu, Y. (2022). A review of the application of near-infrared spectroscopy (NIRS) in forestry. Appl. Spectrosc. Rev. 57: 300–317, https://doi.org/10.1080/05704928.2021.1875481.Suche in Google Scholar
Zhou, Z., Rahimi, S., and Avramidis, S. (2019). On-line species identification of green hem-fir timber mix based on near infrared spectroscopy and chemometrics. Eur. J. Wood Wood Prod. 78: 151–160, https://doi.org/10.1007/s00107-019-01479-8.Suche in Google Scholar
Zhou, Z., Rahimi, S., Avramidis, S., and Fang, Y. (2020). Species- and moisture-based sorting of green timber mix with near infrared spectroscopy. BioResources 15: 317–330, https://doi.org/10.15376/biores.15.1.317-330.Suche in Google Scholar
© 2025 the author(s), published by De Gruyter, Berlin/Boston
This work is licensed under the Creative Commons Attribution 4.0 International License.
Artikel in diesem Heft
- Frontmatter
- Wood Growth/Morphology
- Optimizing recognition models for wood species identification using multi-spectral techniques
- Wood Chemistry
- Influence of moisture on the identification of tropical wood species by NIR spectroscopy
- Practical high-yield production of vanillins from kraft or soda lignin using highly alkaline hydrogen peroxide treatment
- Wood Physics/Mechanical Properties
- An investigation of mechanical properties of linden green wood
- Free shrinkage characteristics of Eucalyptus urophylla × E. grandis wood prone to collapse
- A study on the relationship between porosity and dielectric constant of wood considering the change of moisture content and frequency
- Wood Biochemistry
- An investigation of marine wood boring organism’s attack on various wood materials in Korea