Fatigue testing of wood up to one billion load cycles
-


Abstract
Solid birch wood (Betula pendula) was investigated with a newly developed ultrasonic resonance test set-up enabling accelerated fully reversed fatigue experiments of wood. Ultrasonic fatigue lifetimes were measured at a cycling frequency of about 20 kHz up to 109 load cycles. For comparison, servo-hydraulic fatigue tests at 50 Hz cycling frequency up to 5 × 10⁶ were performed. Numbers of cycles to failure plotted against stress amplitudes determined at both frequencies show comparable slope and standard deviation in the regime of overlapping lifetimes. Birch does not show a fatigue limit. Failures still occurred up to 108 load cycles at stress amplitudes of 30 MPa corresponding to approximately 35% of the ultimate compressive strength. Working principles and control mode of the ultrasonic fatigue test set-up are presented. A modal analysis of excited resonance vibration of the employed load train has been performed by the finite-element-method. Furthermore, the process of determination of applied strain and stress amplitudes was verified by comparative measuring techniques using a contact extensometer.
1 Introduction
In recent years, noticeable efforts have been made to establish wood and wood-based materials in transport facilities (Müller et al. 2020). Especially as a sustainable alternative for reinforced polymers which are laborious and expensive to recycle, wood is a promising material. Besides light weight and sustainability, it features many advantageous properties such as high specific strength and stiffness, easy machinability, good availability, and cost efficiency. If used for load carrying components in vehicles, however, the material is subjected to numerous stress cycles, that can cause fatigue damage of the material. Sound knowledge of the respective cyclic properties are therefore crucial for the design of components in order to ensure safe service lives.
Investigations of fatigue properties of wood, however, are scarce. Tsai and Ansell (1990) performed cyclic bending experiments with three different kinds of wood (African mahogany (Khaya ivorensis) veneers laminated with epoxy resin, Sitka spruce (Picea sitchensis) and laminated beech (Fagus sylvatica)) with focus on loading condition and moisture content. Presenting numbers of cycles to failure versus the maximum bending stress in an S-N diagram, lifetimes were the longer the higher the load ratio R whereas an increase of moisture content from 5 to 35% decreased static as well as cyclic strength. An interesting result was that fatigue strength was found to be largely species independent when lifetimes are presented versus normalised stresses, i.e. ratio of maximum cyclic stress and static strength. Bond and Ansell (1998) made a similar observation, when investigating three jointed wood composites made of Khaya (K. ivorensis), poplar (populus canadensis/serotina) and beech (F. sylvatica) under fully reversed axial loading conditions. Normalising the fatigue data with the respective ultimate compressive strength led to a similar progression of all three S-N curves. Bonfield and Ansell (1991) investigated African mahogany (K. ivorensis) veneer laminates under cyclic tension, cyclic compression, cyclic tension-compression and cyclic shear loading. They found the fatigue strengths to be in line with static strengths, i.e. the fatigue strength is highest under tension loading and lowest under shear loading. Testing wood-epoxy laminates made of rotary cut Khaya veneer layers under cyclic tension, cyclic compression and cyclic tension-compression, Hacker and Ansell (2001) found tension-compression loading to be the most damaging of the three loading conditions. When tested up to one million load cycles at a load ratio of R = 0, bending stress amplitudes of 50 and 40% of the static bending strengths were found to be endurable without failure for pine (Pinus sylvestris) and beech (F. sylvatica) (Yildirim et al. 2015) as well as for several wood composites used for furniture (Bao et al. 1996), respectively. The influence of modification with low-molecular weight phenol formaldehyde resin on cyclic strength was studied in cyclic bending tests with pine (P. sylvestris) and beech (F. sylvatica) (Pečnik et al. 2021). Lifetimes of 106 cycles were reached for both woods in not modified condition if the maximum bending stress of the load cycle was 67% of the static bending strength. For modified pine and beech, the cyclic strength decreased to 58 and 53% of the static strength, respectively.
Increasing testing frequencies can drastically shorten fatigue testing times. However, possible influences of cycling frequency on fatigue lifetimes must be considered, especially when static preloads are applied as creep may occur. Cyclic compression tests with spruce at stress levels of 80% of the compressive strength delivered increasing fatigue lifetimes when the test frequency was increased from 0.01 to 10 Hz (Clorius et al. 2000). This influence was found to be dependent on the moisture content for cyclic tension loading perpendicular to the grain, i.e. spruce featuring high moisture content (85%) showed a frequency effect whereas a lower content (65%) did not (Clorius 2001). Higher lifetimes in the regime between 102 and 104 cycles to failure were also found for structural plywood when subjected to cyclic shear loading at 5 instead of 0.5 Hz, whereas lifetimes of about 106 cycles were unaffected (Sugimoto and Sasaki 2006). Cyclic bending tests at 0.5 and 5 Hz on Japanese cedar (Cryptomeria japonica) and Selangan batu (Shorea spp.) at a load ratio R = 0 delivered a slight frequency influence for cedar but not for batu (Watanabe et al. 2014).
The above-mentioned studies on the fatigue properties of wood and wood-based materials are limited to numbers of cycles below 10 million. Load carrying components in vehicles, however, may be subjected to more than 100 million cycles during service, and sound knowledge of the so called very high cycle fatigue (VHCF) properties of the used materials is crucial. In the ideal case, test frequencies and resulting strain rates in fatigue tests correspond to stress and strain rates occurring in the respective applications. However, when it comes to accessing the very high cycle fatigue regime, i.e. the range above 107 load cycles, which corresponds to years of service lives, conducting fatigue tests using real strain rates becomes unpracticable. Even at a typical testing frequency of 20 Hz, a single fatigue test up to 100 million load cycles would take approximately 58 days, prolonging the time necessary to generate an S-N curve in the range up to one billion load cycles to years. Therefore, accelerated testing techniques are usually applied. The most appropriate experimental method is ultrasonic fatigue testing working at cycling frequencies close to 20 kHz (Stanzl-Tschegg 2014). The high testing frequency allows for accumulation of statistically significant fatigue data at very high numbers of cycles within reasonable testing times. The method has been well established for fatigue testing of metals, in particular high-strength steels, aluminium and titanium alloys, which are insusceptible to influences of testing frequencies (Mayer 2016). However, in recent developments, the ultrasonic fatigue testing technique has also been applied successfully on fibrous materials such as carbon and glass fibre reinforced polymers (Backe et al. 2015; Flore et al. 2017; Premanand and Balle 2022) and even Sycamore maple (Acer pseudoplatanus) (Schönbauer et al. 2022).
In the present investigation, fatigue tests up to 109 load cycles were carried out on birch (Betula pendula) using ultrasonic fatigue testing technique operating at a testing frequency of 20 kHz. Additional fatigue tests were performed using servo-hydraulic equipment at a testing frequency of 50 Hz. Special focus was given to the verification of the developed ultrasonic fatigue test set-up, i.e. in particular the procedure of determining applied strains and stresses. Lifetimes generated in ultrasonic fatigue tests were compared to those obtained using conventional servo-hydraulic testing equipment in order to identify possible influences of cycling frequency and test control on measured lifetimes. Furthermore, the present investigation will answer the question, whether or not wood shows a fatigue limit below 109 cycles.
2 Materials and methods
2.1 Material and sample preparation
The investigated material was flawless birch wood (B. pendula) from Austria. The material was obtained from a conventional timber trading company (Frischeis, Austria). For perfect fibre orientation, the samples were split from the board with a wedge, planed on four sides and sent to a special company for turning (Holzdrehscheibe Drechslerei Prohaska, Austria). Prior to sample preparation, the wood was stored in a climate chamber (65% rel. humidity, 20 °C) until equilibrium moisture content of 12%. Uniaxial fatigue tests were carried out with loading parallel to the grain. Prior to testing, the specimens were ground with abrasive paper up to a grade of #2000 to obtain a smooth surface finish for strain gauge application. The specimen shapes used in conventional and ultrasonic fatigue testing are shown in Figure 1.

Specimen shapes used in the present investigation: in ultrasonic fatigue tests (a) and in servo-hydraulic fatigue tests (b); all dimensions are in mm.
The mechanical properties of the investigated material are listed in Table 1. 63 and fifteen specimens were used to determine density and Young’s modulus, respectively, by standardised procedure.
Mechanical properties of the investigated material.
| Density1 (kg/m3) | Ultimate tensile strength2 (MPa) | Ultimate compressive strength3 (MPa) | Young’s modulus4 (GPa) | Young’s modulus5 (GPa) | Young’s modulus1 (GPa) |
|---|---|---|---|---|---|
| 647 ± 0.1 | 164.5 ± 1.1 | 81.0 ± 1.6 | 17.9 ± 1.0 | 17.6 ± 0.9 | 17.9 ± 0.1 |
-
1Value obtained by standardised procedure. 2−5Values obtained using specimen shape shown in Figure 1b. 4Measured by contact extensometer, 5measured by strain gauge.
Additionally, Young’s modulus and static strength were determined using the specimen shape shown in Figure 1b, in order to avoid the need for considering possible size effects. For this purpose, a servo-hydraulic load frame operating in force-control mode was employed. Three specimens were used to measure ultimate tensile and compressive strength, respectively at a force rate of 0.03 kN/s. Four specimens were used to determine the Young’s modulus simultaneously by contact extensometer and strain gauge at a force rate of 0.015 kN/s.
The environmental condition for all tests performed was laboratory air, featuring a relative humidity of 50% and 23 °C. The specimens were stored under this condition for a minimum of three days prior to testing in order to ensure a uniform moisture content. It has to be noted that adapting temperature and humidity to meet standard conditions for wood testing (i.e. 20 °C and 65% RH) was not possible due to diverse experiments running simultaneously in the laboratory.
2.2 Ultrasonic fatigue testing at 20 kHz
In ultrasonic fatigue tests, specimens, rather than being stressed by external forces, are excited to resonance vibrations. Specimens are mounted into a load train consisting of components of specific shapes and lengths that are constrained by resonance condition at ultrasonic frequency. Both ends of each component vibrate in opposite directions resulting in vibration nodes with maximum strain and stress in their centres. The basic version of such a load train features an ultrasonic transducer to generate high frequency vibrations, a titanium horn to magnify the vibration amplitude, and the test specimen whose lower end vibrates freely under fully reversed loading. However, for the purpose of superimposing static loads or for suppressing undesired excitation modes, the ultrasonic load train can be extended by additional mounting parts.
A piezo-electric transducer generates soundwaves in the range of ultrasonic frequencies that travel through the components of the load train. The velocity, vS, in a cylindrical component is determined by the Young’s modulus, E, and the density, ρ, of its constituting material according to:
with λ being the wavelength and f being the frequency of the ultrasonic soundwave.
The ultrasonic fatigue testing equipment employed in the present investigation is shown in Figure 2. The ultrasonic load train was extended by two titanium rods mounted at the upper and lower end of the specimen. The specimen itself was attached on both ends to aluminium threads by using ARALDITE® 2014-1 adhesive, in order to fit into the load train.

Ultrasonic fatigue testing equipment: Overview of electronic components and ultrasonic load train (left); detail of the specimen mounted between two titanium rods, pressurised air-cooling and infrared thermometer (right).
Components of the ultrasonic load train have to meet resonance condition that is determined by density, Young’s modulus and shape of the respective component. Hence, components of different materials and shapes will feature different lengths when vibrating in resonance. In order to find the correct length of each component, the experimental test set-up consisting of specimen, aluminium threads and titanium rods has been simulated and analysed concerning its modal behaviour with the finite-elements analysis (FEA) software Autodesk® Inventor Nastran 2022. The study was set up as the “Normal Modes” type assuming linear elastic behaviour. In order to simplify the simulation, linear elastic isotropic material behaviour representing the axial direction was used. The soundwave travelling through the specimen is a planar, one-dimensional wave travelling in the axial (i.e., x) direction. Consequently, all but the x-x component of the stress tensor resulting from modal vibration are zero i.e., only the Young’s modulus in axial direction is relevant and all other elastic constants (i.e. Young’s modulus in other directions and Poisson numbers) do not influence the mode in x-x direction. Density and Young’s modulus used for FEA, and lengths of the analysed components are listed in Table 2.
Parameters used for finite-element analysis.
| Material | Density (kg/m3) | Young’s modulus (GPa) | Length (mm) |
|---|---|---|---|
| Betula pendula | 647 | 17.9 | 67 |
| Ti-6Al-4V | 4430 | 113.8 | 129.5 |
| Al7075-T6 | 2810 | 71.7 | 5 |
The solid bodies were meshed with triangular elements, where mesh resolution was determined via modal frequency convergence. Sufficiently high resolution was indicated with 0.3 mm mesh resolution over the gauge section (the rods experience much less deformation, consequently a much coarser resolution of 2 mm was sufficient). FEA post-processing allowed to extract stress, strain and displacement for every mesh element. The resulting distributions of displacement and strain across the ultrasonic load train for modal vibration at 19.1 kHz are shown in Figure 3.
Ultrasonic fatigue tests are displacement controlled. The vibration amplitude is measured with a vibration gauge that is positioned at the lower end of the magnifying horn, i.e. at the location where a vibration antinode occurs. The signal of the vibration gauge is used to control cyclic loading. Displacement at all antinodes along the load train is proportional to the strain in the centre of the specimen. In order to perform an ultrasonic fatigue test at a given stress amplitude, the linear correlation between displacement and resulting strain in the specimen’s centre is determined prior to testing (see 2.3.). The resulting stress amplitude, σa, applied on the material can then be calculated according to Hooke’s law:
with E being the Young’s modulus and εa being the strain amplitude.
The ultrasonic fatigue testing equipment employed in the present investigation has been developed at BOKU (Mayer 2016) guaranteeing a very high accuracy of process control. Closed-loop control circuits ensure an agreement of pre-selected and actual vibration amplitudes within ±1% and of excitation and resonance frequency within ±1 Hz, respectively. Furthermore, it allows for intermittent loading, i.e. cyclic loading is applied in pulses of 100 ms followed by pauses of appropriate lengths correspondent to the load level. Effective testing frequencies, i.e. numbers of cycles per second, of 380 s−1 at stress amplitudes of 60 and 52 MPa, and 920 and 1760 s−1 at stress amplitudes of 40 and 30 MPa, respectively, were used. Thus, and in addition to pressurised air-cooling, excessive self-heating of the specimens was prevented. By temperature monitoring using an infrared thermometer, it was ensured that the specimens’ temperature remains below 30 °C throughout the tests. Eleven specimens have been tested using the above-described test set-up.
2.3 Strain gauge measurements
Prior to the tests, the linear correlation between vibration amplitude and strain amplitude was determined by strain gauge measurements. Strain gauges of the type KFGS-1-120-C1-23 featuring a resistance of 120 Ω and a gauge size of 1 × 1 mm were attached at the upper and lower end of the gauge section of each specimen using the instantaneous adhesive CC-33A-5. Both strain gauges and instantaneous adhesive were by KYOWA®. The strain gauges were used as quarter bridge with a bridge voltage of 5 V.
In order to investigate the accuracy of strain gauge measurements, static tension-compression tests using strain gauges and a contact extensometer, respectively, have been carried out on four specimens as shown in Figure 1b, i.e. featuring a gauge length of 10 mm. The applied contact extensometer of the type DD1 by HBM® featured a gauge length of 8.5 mm. Three specimens have been loaded by tension and compression stresses up to limiting values of 80 and −50 MPa, respectively. One specimen was loaded solely by tension stresses up to 80 MPa. The hereby obtained data has been further used to determine the Young’s modulus for the given material and grain orientation.
2.4 Servo-hydraulic fatigue testing at 50 Hz
Conventional, force-controlled fatigue tests using a servo-hydraulic load frame have been carried out under fully reversed sinusoidal loading for comparison using eight specimens. The employed specimen shape featured the same gauge volume as used in ultrasonic fatigue testing in order to avoid the need for considering possible size effects and can be seen in Figure 1b. Four specimens have been tested at a load level of 40 and 52 MPa, respectively, at a loading frequency of 50 Hz. Limiting lifetimes were 5 × 10⁶ cycles.
3 Results and discussion
3.1 Accuracy of strain gauge measurements
When comparing fatigue data obtained by servo-hydraulic and ultrasonic fatigue testing, the control mode of the respective testing system needs to be considered, i.e. force and displacement control, respectively. Given that ultrasonic fatigue tests are strictly performed in the linear elastic regime, the linear correlation between vibration amplitude and strain amplitude is determined prior to the test, and the resulting stress amplitudes are calculated by Hooke’s law. Hence, the validity of given values for applied stress amplitudes depends on the accuracy of the strain gauge measurement.
In particular, the quality of adhering of the strain gauge on the specimen’s surface may be an issue for a porous and fibrous material like wood since the required smoothness of surface is hardly achieved. Consequently, paste-like adhesives are usually applied in order to compensate for superficial unevenness, however, also leading to thicker adhesive layers that might generate measurement errors. Furthermore, the size of the strain gauge must be considered since inhomogeneous materials usually require larger and longer strain gauges. Therefore, the accuracy of the strain gauge measurements performed in the present study was investigated by comparing it to the signal obtained by a contact extensometer in stress-strain tests. The data generated in both the tensile and compressive regime up to 80 MPa and −50 MPa, respectively, are shown in Figure 4. The values for the Young’s modulus that were derived on basis of these data coincide within ±2% suggesting a high accuracy of the applied set-up.

Results of finite element analysis: distribution of displacement (top) and strain (bottom) across the ultrasonic load train consisting of the specimen and two titanium rods and aluminium threads, respectively.

Stress-strain data obtained by strain gauge and contact extensometer.
3.2 Presenting stress amplitudes against numbers of cycles to failures
Fatigue lifetime tests have been carried out under fully reversed loading conditions using eleven and eight specimens at testing frequencies of 20 kHz and 50 Hz, respectively. The results are shown in Figure 5. Stress amplitudes, σa, are plotted against numbers of cycles in a double-logarithmic diagram. Only two specimens tested at 20 kHz survived limiting lifetimes, i.e. 109 load cycles, without failure. These are labelled run-outs and are marked with an arrow. Mean lifetimes as well as standard deviations are displayed by solid and dashed lines, respectively. Standard deviations were calculated assuming a Gauss-distribution of the fatigue lifetimes’ logarithms (Maenning 1997). Investigated lifetimes ranged from 103 to 109 load cycles. 50% fracture probability at 104 and 109 cycles were found at a stress amplitude of 55 and 29 MPa, respectively. Failures still occurred up to 108 numbers of cycles, i.e. no fatigue limit has been found.
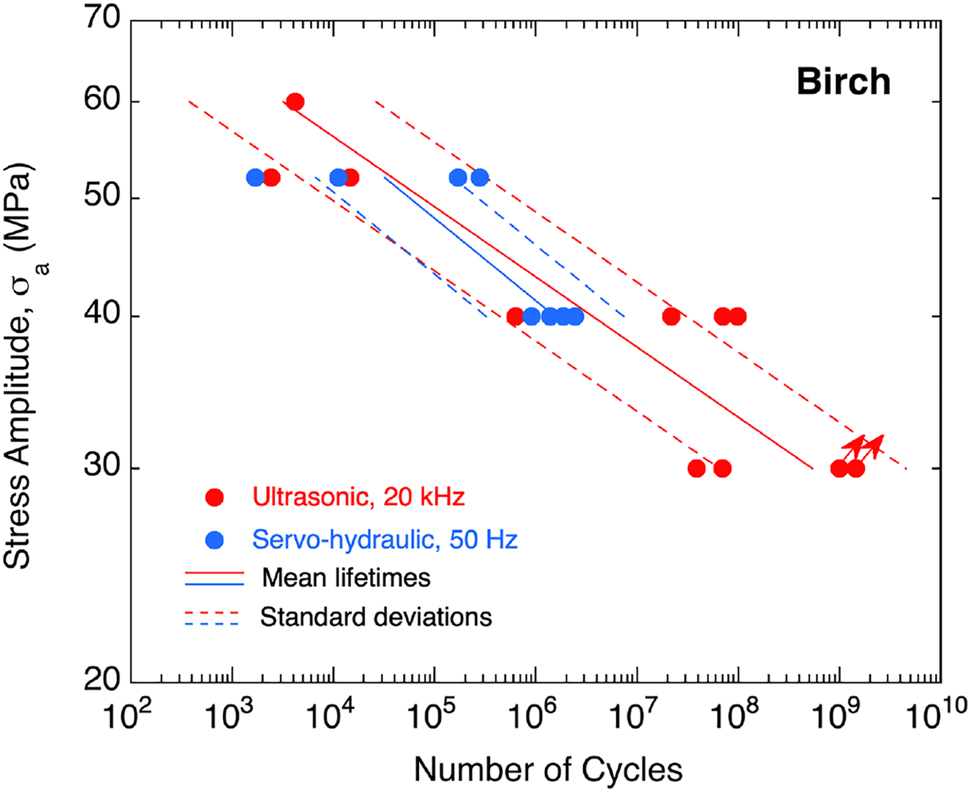
Fatigue data of birch obtained by ultrasonic (red dots) and servo-hydraulic (blue dots) fatigue testing, stress amplitudes are plotted double-logarithmically against numbers of cycles to failure, specimens surviving limiting lifetimes of 109 load cycles are marked with an arrow.
3.3 Influence of cycling frequency
As can be seen in Figure 5, there is good agreement between high and low frequency fatigue data. Considering the overlap of standard deviation of both data sets, S-N curves obtained at 20 kHz and 50 Hz are well comparable. This suggests a negligible effect of testing frequency for the investigated fully reversed cyclic tension-compression loading in the applied range of cycling frequencies. The ultrasonic fatigue testing technique is therefore appropriate for accelerated collection of fatigue data of birch. Furthermore, the present finding is well in accordance with a previous investigation of Sycamore maple, where no frequency effect on fatigue lifetimes could be observed (Schönbauer et al. 2022).
Few investigations about the effect of testing frequency on the fatigue life of wood are available in the literature and these are limited to the lower frequency range up to 10 Hz. The strongest influence of cycling frequency on stress-strain hysteresis and fatigue lifetimes was found in cyclic compression tests when loading was perpendicular to the grain direction (Clorius et al. 2000). In cyclic bending tests, where the principal stresses are parallel to the grain, influences of cycling frequency were found to be absent or small (Watanabe et al. 2014).
In the present study, no effects of frequency on fatigue lifetimes were observed. However, the investigated testing frequencies were of at least one order of magnitude higher than those studied in the literature. Whether wood shows an effect of frequency for lower frequencies than 50 Hz and for other loading modes (e.g. cyclic tension, cyclic compression), would therefore be a matter of further studies.
3.4 Presenting relative stress amplitudes against numbers of cycles to failure
In a previous study, the fatigue properties of Sycamore maple were studied at 50 Hz and ultrasonic frequency (Schönbauer et al. 2022). Sycamore maple, however, showed a lower cyclic strength than the presently investigated birch. In order to compare fatigue data of both materials, cyclic stresses can be normalised by the compressive strength of the respective material, when loaded at R = − 1. In this case, the stress amplitudes during the tensile and compressive part of a stress cycle are equal, however, the static compressive strength of wood is about half of its tensile strength, and therefore, the compressive part may be considered to be more damaging. This is in line with the cyclic strength being lower under cyclic compression than under cyclic tension (Schönbauer et al. 2022).
In Figure 6, fatigue lifetimes of birch are presented versus stress amplitudes, σa, normalised by the compressive strength, σc, obtained by using the same specimen shape as in fatigue tests in a double-logarithmic plot. Relative stress amplitudes, σa/σc, range from 68% to 36% of the compressive strength, σc, correspondent to fatigue lifetimes between 104 and 109 load cycles.

Fatigue data of birch obtained by ultrasonic (red dots) and servo-hydraulic (blue dots) fatigue testing, relative stress amplitudes are plotted double-logarithmically against numbers of cycles to failure, specimens surviving limiting lifetimes of 109 load cycles are marked with an arrow.
In Figure 7, the results of low and ultrasonic frequency fatigue tests with Sycamore maple are shown using relative stress amplitudes, σa/σc (Schönbauer et al. 2022). Figures 6 and 7 are presented for the same range of lifetimes, i.e. from 103 to 109 load cycles. Mean lifetimes of 107 cycles were measured for relative stress amplitudes, σa/σc, of 0.46 ± 0.05 for birch (Figure 6) and 0.43 ± 0.07 for Sycamore maple (Figure 7) indicating that the correlation between relative stress amplitudes and cycles to failure is comparable for both materials.

Fatigue data of sycamore maple (Schönbauer et al. 2022) obtained by ultrasonic (red dots) and servo-hydraulic (blue dots) fatigue testing, relative stress amplitudes are plotted double-logarithmically against numbers of cycles to failure, specimens surviving limiting lifetimes of 5 × 10⁶ and 109 load cycles, respectively, are marked with an arrow.
This observation is in good agreement with the literature (Bond and Ansell 1998). In this study, a master S-N curve was derived from fatigue data obtained by three scarf-jointed species, Khaya, poplar and beech that have been tested under fully reversed axial fatigue loading up to limiting lifetimes of 107. Taken into account the compressive ultimate strength of the respective wood composite, σc, the following correlation between cycles to failures, N and stress amplitude, σ a , was obtained (Bond and Ansell 1998):
If this equation is used to predict the cyclic strength at numbers of cycles, N, of 109, the formula predicts a fatigue strength, σ w , of approximately 4% of the ultimate compressive strength, σ c . This would suggest that wood could hardly be used for applications where such high numbers of load cycles occur. In the present study, experimentally observed fatigue strengths at 109, however, were approximately 36% of the static strength for birch and 31% for Sycamore maple, respectively. Thus, the difference to the predicted value is significant and implies the necessity of actually performing very high cycle fatigue tests in order to accurately determine the fatigue strength.
4 Conclusions
An ultrasonic fatigue test set-up enabling very high cycle fatigue testing of wood within reasonable testing time has been developed. Fully reversed tension-compression fatigue tests were carried out on solid birch wood using ultrasonic and servo-hydraulic fatigue testing equipment operating at 20 kHz and 50 Hz, respectively. Investigated lifetimes ranged from 103 to 109 load cycles. The ultrasonic test set-up was verified with regard to determination of applied strain and stress amplitudes, respectively.
The following conclusions can be drawn:
The ultrasonic fatigue testing technique is an appropriate method for accelerated fatigue testing of wood enabling the collection of statistically significant fatigue data of up to 109 load cycles within reasonable testing time.
Fatigue failures still occurred in the very high cycle fatigue regime. Birch does not show a fatigue limit below 109 load cycles. 50% fracture probability at 109 cycles is found at 29 MPa, which is 36% of the ultimate compressive strength (determined using the same specimen shape as in fatigue tests).
Fatigue data obtained at 50 Hz and 20 kHz show good agreement. The S-N curves run similarly and within the same range of scatter. An influence of testing frequency in the investigated frequency range could not be observed.
Fatigue properties of birch and Sycamore maple are similar and material independent when normalised by the static strength of the respective material.
Nomenclature
- E
-
Young’s modulus
- ε a
-
strain amplitude
- f
-
frequency
- λ
-
wavelength
- N
-
number of cycles
- R
-
ratio of minimum to maximum stress
- ρ
-
density
- S
-
stress
- σ
-
stress
- σ a
-
stress amplitude
- σ c
-
ultimate compressive strength
- σ w
-
fatigue strength
- v S
-
speed of sound
-
Author contributions: All the authors have accepted responsibility for the entire content of this submitted manuscript and approved submission.
-
Research funding: The authors are grateful for research funding from the Federal Ministries BMK and BMDW as well as the Province of Styria within the COMET – Competence Centers for Excellent Technologies program, and for funding from the companies ACstyria Mobilitätscluster GmbH, BASF SE, DI Gottfried STEINER, DYNAmore Gesellschaft für FEM Ingenieurdienstleistungen mbH,, Forst-Holz-Papier, Fill Gesellschaft m. b.H, Glanzstoff Management GmbH, Holzcluster Steiermark GmbH, Klumpp Coatings GmbH, LEAN Management Consulting GmbH, Volkswagen AG and Weitzer Wood Solutions GmbH. The COMET program is handled by the Austrian Research Promotion Agency (FFG, 882509) and the Styrian Business Promotion Agency (SFG, 1,000,065,896).
-
Conflict of interest statement: The authors declare that they have no conflicts of interest regarding this article.
References
Backe, D., Balle, F., and Eifler, D. (2015). Fatigue testing of CFRP in the very high cycle fatigue (VHCF) regime at ultrasonic frequencies. Compos. Sci. Technol. 106: 93–99, https://doi.org/10.1016/j.compscitech.2014.10.020.Search in Google Scholar
Bao, Z., Eckelman, C., and Gibson, H. (1996). Fatigue strength and allowable design stresses for some wood composites used in furniture. Holz als Roh- Werkst. 54: 377–382, https://doi.org/10.1007/s001070050204.Search in Google Scholar
Bond, I.P. and Ansell, M.P. (1998). Fatigue properties of jointed wood composites. Part I: statistical analysis, fatigue master curves and constant life diagrams. J. Mater. Sci. 33: 2751–2762, https://doi.org/10.1023/a:1017565215274.10.1023/A:1017565215274Search in Google Scholar
Bonfield, P.W. and Ansell, M.P. (1991). Fatigue properties of wood in tension, compression and shear. J. Mater. Sci. 26: 4765–4773, https://doi.org/10.1007/bf00612416.Search in Google Scholar
Clorius, C.O. (2001). Fatigue in wood: an investigation in tension perpendicular to the grain. Technical University of Denmark, Lyngby, Denmark.Search in Google Scholar
Clorius, C.O., Pedersen, M.U., Hoffmeyer, P., and Damkilde, L. (2000). Compressive fatigue in wood. Wood Sci. Technol. 34: 21–37, https://doi.org/10.1007/s002260050005.Search in Google Scholar
Flore, D., Wegener, K., Mayer, H., Karr, U., and Oetting, C.C. (2017). Investigation of the high and very high cycle fatigue behaviour of continuous fibre reinforced plastics by conventional and ultrasonic fatigue testing. Compos. Sci. Technol. 141: 130–136, https://doi.org/10.1016/j.compscitech.2017.01.018.Search in Google Scholar
Hacker, C.L. and Ansell, M.P. (2001). Fatigue damage and hysteresis in wood-epoxy laminates. J. Mater. Sci. 36: 609–621, https://doi.org/10.1023/a:1004812202540.10.1023/A:1004812202540Search in Google Scholar
Maenning, W.W. (1997). Planning and evaluation of fatigue tests. In: Lampman, S.R., Davidson, G.M., Reidenbach, F., Boring, R.L., Hammel, A., Henry, S.D., and Scott, W.W. (Eds.), ASM handbook fatigue and fracture. ASM International, Materials Park, OH, pp. 303–313.Search in Google Scholar
Mayer, H. (2016). Recent developments in ultrasonic fatigue. Fatig. Fract. Eng. Mater. Struct. 39: 3–29, https://doi.org/10.1111/ffe.12365.Search in Google Scholar
Müller, U., Jost, T., Kurzböck, C., Stadlmann, A., Wagner, W., Kirschbichler, S., Baumann, G., Pramreiter, M., and Feist, F. (2020). Crash simulation of wood and composite wood for future automotive engineering. Wood Mater. Sci. Eng. 15: 312–324.10.1080/17480272.2019.1665581Search in Google Scholar
Pečnik, J.G., Kutnar, A., Militz, H., Schwarzkopf, M., and Schwager, H. (2021). Fatigue behavior of beech and pine wood modified with low molecular weight phenol-formaldehyde resin. Holzforschung 75: 37–47.10.1515/hf-2020-0015Search in Google Scholar
Premanand, A. and Balle, F. (2022). Development of an axial loading system for fatigue testing of textile-composites at ultrasonic frequencies. Mater. Lett. X 13: 100131, https://doi.org/10.1016/j.mlblux.2022.100131.Search in Google Scholar
Schönbauer, B.M., Killinger, M., Karr, U., Fitzka, M., Müller, U., Teischinger, A., and Mayer, H. (2022). Fatigue properties of wood at different load ratios tested at 50 Hz and 20 kHz. Mater. Werkst. 53: 344–354.10.1002/mawe.202100280Search in Google Scholar
Stanzl-Tschegg, S. (2014). Very high cycle fatigue measuring techniques. Int. J. Fatig. 60: 2–17, https://doi.org/10.1016/j.ijfatigue.2012.11.016.Search in Google Scholar
Sugimoto, T. and Sasaki, Y. (2006). Effect of loading frequency on fatigue life and dissipated energy of structural plywood under panel shear load. Wood Sci. Technol. 40: 501–515, https://doi.org/10.1007/s00226-006-0080-y.Search in Google Scholar
Tsai, K.T. and Ansell, M.P. (1990). The fatigue properties of wood in flexure. J. Mater. Sci. 25: 865–878, https://doi.org/10.1007/bf03372174.Search in Google Scholar
Watanabe, A., Sasaki, Y., and Yamasaki, M. (2014). Bending fatigue of wood: strain energy-based failure criterion and fatigue life prediction. Wood Fiber Sci. 46: 216–227.Search in Google Scholar
Yildirim, M.N., Uysal, B., Ozcifci, A., and Ertas, A.H. (2015). Determination of fatigue and static strength of Scots pine and beech wood. Wood Res. 60: 679–686.Search in Google Scholar
© 2022 the author(s), published by De Gruyter, Berlin/Boston
This work is licensed under the Creative Commons Attribution 4.0 International License.
Articles in the same Issue
- Frontmatter
- Original Articles
- Intra-species variation in maximum moisture content, cell-wall density and porosity of hardwoods
- Fractal dimension of wood pores from pore size distribution
- Fatigue testing of wood up to one billion load cycles
- The influence of vacuum heat treatment on the pore structure of earlywood and latewood of larch
- The relationship between color and mechanical properties of heat-treated wood predicted based on support vector machines model
- Effect of water/moisture migration in wood preheated by hot press on sandwich compression formation
- Quercetin-grafted modification to improve wood decay resistance
- Organosolv delignification of birch wood (Betula pendula): DMSO/water pulping optimization
- Alkali lignin as a pH response bifunctional material with both adsorption and flocculation for wastewater treatment
- Evaluation of the mechanical properties of different parts of bending bamboo culm by nanointendation