Effect of water/moisture migration in wood preheated by hot press on sandwich compression formation
-
Rongfeng Huang
 ,
Shanghuan Feng
,
Shanghuan Feng

Abstract
By regulating preheating time, effects of water/moisture immigration and distribution in wood on sandwich compression formation were investigated in this study. Kiln-dried poplar wood was first immersed in water to result in high moisture content (MC) layers on wood surfaces. These wood specimens were then conditioned at room temperature in sealed plastic bags and preheated with hot press platens at 180 °C to drive water/moisture into wood. Wood preheated for 10–600 s contained one to two high MC layers all the time. Extended preheating time moved the high MC layers from wood surfaces to the center. Mechanical pressure on preheated wood specimens resulted in sandwich compressed wood with the compressed layer(s) position(s) consistent to that of the high MC layer(s) before compression. The positions of compressed layer(s) and MC peak(s) both increased exponentially as a function of the logarithm of preheating time. Wood preheating by platens led to water/moisture migration and therefore controlled water/moisture distribution, thus promoting the softening of specific wood layer(s), which is mainly responsible for sandwich compression. A logarithmical model that can be used for predicting the position(s) of the compressed layer(s) was developed.
1 Introduction
Compression enhances the mechanical properties of plantation wood such as hardness and strength, thus extending wood applications (Inoue et al. 1998; Kamke and Rathi 2011; Kutnar et al. 2009; Laine et al. 2013; Norimoto 1993). Wood compression can diversify applications of low-quality wood for various purposes such as wood flooring and furniture. Conventionally, the enhancement of mechanical properties of compressed wood relies heavily on the high compressing ratio (Kitamori et al. 2010), which involves a large loss of wood volume and thereby increases the manufacturing costs. To minimize wood consumption and the cost of wood compression, wood sandwich compression involving partial and selective densification of wood surfaces or interior for wood properties enhancement has been developed (Huang et al. 2012; Li et al. 2018).
Sandwich compression is an advanced technology that densifies wood surfaces or interior to enhance wood properties with minimal wood compressing ratios as needed. As for a sandwich compressing process, wood with MC lower than 10% is immersed in water to wet surfaces, then the wood is conditioned, preheated and compressed by hot press platens. The resultant compressed wood can be surfaces or interior compressed, depending on preheating temperature and preheating time (Figure 1). When wood lumber with thickness of 20 mm was compressed to 15 mm, compressed wood surface hardness increased by 128% (Huang et al. 2012). The position(s) of the compressed layer(s) can be regulated along wood thickness by adjusting preheating temperature and time (Gao et al. 2019; Li et al. 2018; Wu et al. 2019). Wood sandwich compression was invented 10 years ago (Huang et al. 2012) and it has been frequently reported in the past years by Huang group (Gao et al. 2016; Huang et al. 2021; Li et al. 2018; Wu et al. 2019; Xiang et al. 2020), the mechanism of wood sandwich compression has yet to be elucidated.

Density distribution in sandwich compressed wood (10, 40, 240 and 420 s represent sandwich compressed wood after preheating at 150 °C for 10, 40, 240 and 420 s, respectively): (a) sandwich compressed wood; (b, c, d) SEM micrographs of transverse sections of sandwich compressed wood) (Huang et al. 2012; Li et al. 2018).
Moisture and temperature are critical variables affecting wood softening (Furuta et al. 2010; Takamura 1968). The glass transition temperature (softening temperature) of hemicellulose and lignin in oven-dried wood is 150–220 and 134–235 °C, respectively (Goring 1963; Salmen 1982). Wood softening temperature is reduced when MC increases. When wood MC increases to 20%, the glass transition temperature of lignin reduces to 80 °C (Furuta et al. 2010). While for hemicellulose, when the MC increases to 30%, its glass transition temperature reduces to only 20 °C (Salmen 1982). Even when the temperature reaches the glass transition point, the initial wood compressing stress is still strongly affected by MC. Initial compressing stress of wood with low MC is substantially higher than that of wood with high MC (Penneru et al. 2006). Steaming and boiling in water for softening wood are critical for wood densification via compression and molding (Inoue et al. 1993, 1998; Penneru et al. 2005, 2009). The objective of wood softening is to ensure that the wood cell wall is not disrupted or squashed during compression (Liu et al. 1993; Norimoto 1993). The water/moisture is evenly distributed in wood during conventional compression, but is seldom reported. In contrast to conventional wood compression, the moisture and temperature gradients in wood and their variation during wood preheating are key parameters affecting wood sandwich compression. The mechanism of wood sandwich compression can be understood by elucidating these issues.
In this study, kiln-dried poplar (Populus tomentosa) wood was first immersed in water, conditioned in sealed bags, and then preheated using hot press platens, to investigate moisture/water migration and distribution along the thickness during preheating. The position(s) of compressed layer(s) after compression were determined to elucidate the mechanism of wood sandwich compression.
2 Materials and methods
2.1 Materials
Twenty-five years old poplar (P. tomentosa) wood with 25–35 cm in diameter at breast height was harvested from a plantation forest in Guan County, Shandong Province in China. The average and maximum density of the poplar wood was 440 and 490 kg/m3, respectively. Before the experiment, the poplar wood was kiln-dried to 10% MC, followed by processing into specimens with 800 mm (L) × 150 mm (T) × 20 mm (R) in size. Each specimen was then sawn into two specimens S1 and S2, with identical dimensions of 400 mm (L) × 150 mm (T) × 20 mm (R), and were used to test MC and sandwich compression, respectively. Both S1 and S2 cross-sections were sealed with paraffin wax.
2.2 MC adjustment and determination of water/moisture distribution in wood
2.2.1 MC adjustment
Water/moisture distribution was adjusted by regulating wood immersion time in water and preheating time (Figure 2b). Wood was immersed in water for various periods including 60, 120, 240, 360, 480 and 600 min. The S1 specimens were first immersed in water for 120 min, then conditioned in sealed plastic bags. After 18 h of conditioning in the sealed plastic bags, S1 specimens were preheated at 180 °C in a hot press at both top and bottom surfaces without any loading (Figure 2c) for 0, 10, 20, 40, 80, 120, 240, 360, 480, or 600 s. Each preheating run was replicated six times.

Schematic representation of wood sampling and sandwich compression.
2.2.2 Determination of water/moisture distribution
Water/moisture distribution in wood was determined using the vertical density profile method (Cai 2008; Li et al. 2010). A soft X-ray densitometer (D-31785 Hameln) with a 20 µm step was used for density measurement, scanning from the top to the bottom surface along the specimen thickness.
Water/moisture distribution in various wood layers was quantified as MC. To determine water/moisture distribution, S1 specimens were immersed in water, conditioned and preheated. A smaller specimen with the size of 50 mm (L) × 50 mm (T) × 20 mm (R) was then sampled from each S1 center for density (ρ i ) measurement using a soft X-ray densitometer. The tested specimens were then oven-dried at 103 °C to constant weight and scanned again with a soft X-ray densitometer for density (ρ0) measurement. The MC of various layers in wood was determined according to the following equation (Cai 2008; Li et al. 2010).
where M, G, ρ, L, T, and h denote MC (%), mass (g), density (kg/m3), longitudinal dimension (mm), tangential dimension (mm), and the thickness (mm) of each layer, respectively. The subscripts i and o indicate the wet and oven-dried states of wood, respectively. The thickness of each layer was 1.0 mm, including 20 layers.
2.2.3 Determination of water/moisture penetration depth
S1 specimens densities were used to generate the density distribution profiles of wood immersed in water and the associated oven-dried ones along the thickness. The water/moisture penetration depth in wood was determined by partially overlapping the density profile of dried wood specimen with another density profile of immersed wood specimen, as illustrated by Figure 3. The maximum water penetration depth in wood during immersion in water was denoted by the profile separation points “a” and “b” as displayed in Figure 3. The shaded areas represent wood interior areas of water penetration. The density profiles were adjusted based on wood swelling or shrinkage following immersion in water or oven-drying.

Density distribution along the thickness of wood after immersion in water for 360 min and oven-drying. Blue-shaded areas represent water penetration into wood interior; “a” and “b” denote points of water penetration, i.e., maximum water penetration depth.
2.3 Wood sandwich compression and density distribution
2.3.1 Wood sandwich compression
S2 specimens shown in Figure 2a were used for wood sandwich compression. Preheated specimens were pressed at the rate of 3 mm/min to a thickness of 15 mm. After compression, the 15 mm thickness was maintained for 30 min under 6.0 MPa. Sandwich compressed wood including surfaces compressed wood, interior compressed wood and center compressed wood were then obtained, as shown in Figure 2e.
2.3.2 Determination of density distribution in sandwich compressed wood
After sandwich compression, smaller specimens (5 mm (L) × 50 mm (T) × 15 mm (R)) were cut from the center of sandwich compressed wood. The specimens were conditioned at 20 °C and 65 RH% for two weeks, followed by scanning with a soft X-ray densitometer (D-31785 Hameln) to determine the density along the specimen thickness.
2.3.3 Definition of sandwich compressed layer(s)
The average and maximum density of poplar wood was 440 and 490 kg/m3, respectively. After compression, the wood layer with 20% higher density than the control was defined as the compressed layer. Herein, any areas in sandwich compressed wood with a density higher than 590 kg/m3 were considered as the compressed layers. Sandwich compressed wood with surfaces, interior or center compressed was named as surfaces compressed wood, interior compressed wood or center compressed wood, respectively (Li et al. 2018).
3 Results and discussion
3.1 Water absorption on wood surfaces and water penetration into wood
Figure 4 shows the water absorption rate when kiln-dried wood with cross-section sealed by paraffin wax was immersed in water for 720 min. The water absorption rate sharply increased at the initial stage and peaked when immersed for 0.5 min. After immersion for 60 min, the water absorption rate decreased sharply by 30%, then declined eventually. Since the cross-sections of specimens were sealed before immersion, the tangential and radial surfaces with broken surface cells including vessels and wood fibers cells absorbed water. The open cell can be rapidly filled with water, followed by water migration into and across the wood via pits in the cell wall, or by slow diffusion between the continuous cell wall structures (Bao and Lv 1992; Kuroda and Siau 1988). When wood was not exposed to heat or pressure, the water was retained on wood surfaces or the adjacent interior areas for several hours or longer, which facilitated the adjustment of water/moisture distribution in various layers of the wood.
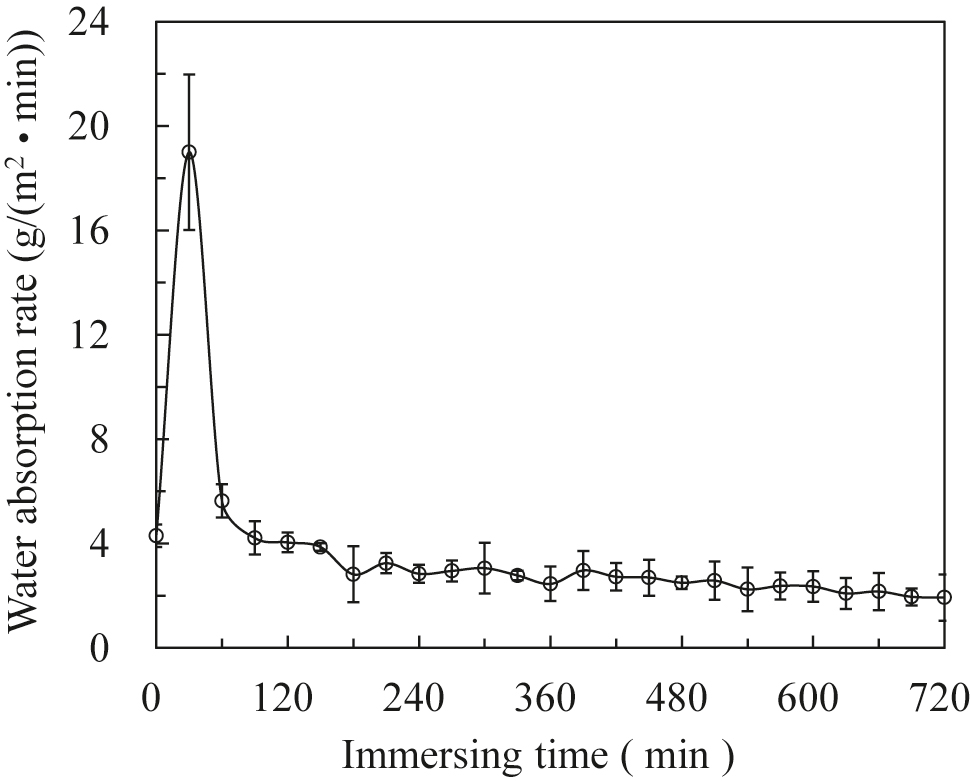
Water absorption rate at room temperature.
As shown in Figure 5, the density distribution in wood after immersion in water and oven-drying can be used to analyze the MC changes along the thickness. Prolonged immersion periods led to more water absorption by the wood, thereby increasing the measured density of wood layers. Wood surface density increased from 560 to 710 kg/m3 when the immersion time was increased from 60 to 120 min. When the immersion time was extended to 360 min, the density of one wood surface reached 1000 kg/m3. Further extending the immersion time to 600 min increased the density of both wood surfaces to high as 1000 kg/m3, suggesting water saturation of both wood surfaces.

Density distribution along the thickness of wood specimens after immersing in water for various periods and after oven-drying. “a” and “b” are the points of water penetration, indicating maximum water penetration depth.
As shown in Figure 6, the density distribution profiles of wood were generated by immersing in water and oven-drying, together with the altered density profile of oven-dried wood. Water penetration depth increased linearly with the extension of immersion time. When wood was immersed in water for 60 min at room temperature, water penetration depth was 0.74 mm. When the immersion time was extended to 600 min, the water penetration depth increased to 5.58 mm. The water penetration rate tended to reduce over time. The average water penetration rate of wood immersed in water for 60 min was 0.0123 mm/min, whereas the average penetration rate decreased to 0.0095 mm/min for wood immersed in water for 360 min. Further extending immersion time resulted in almost no change in the average penetration rate.

Water penetration depth and velocity versus immersion time.
3.2 Preheating driven water/moisture migration in wood
Figure 7 shows the density and water/moisture distribution along wood thickness after immersion in water, conditioning in sealed plastic bags and preheating by hot press platens. After immersion in water for 120 min, the wood surface density reached 892 kg/m3 and wood surfaces MC exceeded 40%. Subsequent conditioning for 18 h reduced the wood surface density to 618 kg/cm3, and the wood surface peak MC decreased to 27%, which was caused by moisture diffusion from wood surface to the interior. Water penetration depth increased from 1.32 to 6.28–7.45 mm (Figure 7a and b) after 18 h of conditioning. As illustrated by the density change of wood after immersion and conditioning, water penetrated from wood surface into the interior, forming two high density areas adjacent to wood surfaces. These high-density areas were indeed high MC areas (Figure 7b). When preheated at 180 °C for 10 s (Figure 7c), the wood surface density was reduced to 528 k/m3 and the peak MC decreased to 20%. The peak MC was detected at 1 mm below the wood top surface, while the water/moisture penetration depth increased to 8.22 mm. Thus, it can be concluded that 10 s of preheating at 180 °C contributed to deeper water/moisture penetration than 18 h of conditioning. As shown in Figure 7, the high MC areas existed during the whole process of water immersion, conditioning and preheating. When the preheating time was 40 s (Figure 7d and e), the density of wood after immersion, conditioning and preheating was higher than that of oven-dried wood, and the density gap was reduced when the preheating time was extended to 240 s (Figure 7e). Further extending the preheating time to 480 s decreased this density gap; however, the density peak still appeared in the center of wood along the thickness. Meanwhile, wood surfaces MC was reduced to less than 5%, while the MC at the center increased from 10 to 12%.

Density and water/moisture distribution in wood after immersion in water, conditioning in sealed plastic bags and preheating with hot press platens.
Even though the MC peak gradually reduced for the sake of preheating time extension, the high MC layers originally formed on wood surfaces existed in wood all the time. These high MC layers gradually migrated into the wood center along the thickness. When the preheating time reached 480 s, wood surface MC was reduced to less than 5%, while the center MC increased from 10 to 12%. Thus, MC variation greater than 5% still existed along wood thickness (Figure 7f). When wood was preheated to 180 °C after immersion in water and conditioning, wood surface temperature increased rapidly, which gasified the absorbed water. At the same time, the wood interior absorbed water. At comparatively high temperatures, the variation in adsorption and desorption isotherms became smaller (Yan and Wang 2014) and the hygroscopic hysteresis disappeared, leading to almost the same rates of adsorption and desorption (Weichert 1963). Thus, a MC variation greater than 5% existed all the time and the high MC layers gradually moved from wood surface to the center. When wood surface MC was less than 5%, the moisture in wood existed as bound water via hydrogen bonds or absorbed water via van der Waals forces in the form of a single molecular layer, which was difficult to desorb from wood. Thus, when wood surface MC was lower than 5%, the MC was not further reduced in spite of the extended preheating time. As wood initial compressing stress depended on the MC (Penneru et al. 2006), a MC variation greater than 5% was detected in wood during the whole preheating process, which contributed to the compressing stress variation among the layers in wood and thus sandwich compression.
3.3 Effect of preheating time on water/moisture distribution and compressed layer(s) position(s)
Water/moisture distribution along wood thickness after preheating for 0, 10, 20, 40, 80, 120, 240, 360, 480 and 600 s is shown in Figure 8. Without preheating, water/moisture distribution in wood after immersion in water and conditioning in sealed spaces showed a “V” shape, suggesting high MC on wood surfaces, and substantially lower MC level inside. Once preheated for 10–480 s, water migrated from the surface areas into wood interior, and the water/moisture distribution showed an “M” shape. When the preheating time was extended to 600 s, water/moisture distribution profile turned into an inverted “V” shape. When the preheating time further extended, MC peaks moved from wood surfaces into wood center. In contrast, the MC peak value declined eventually.

Water/moisture distribution along the thickness of wood specimens preheated for various periods.
Figure 9 displays sandwich compressed wood specimens and their associated soft X-ray images. In the soft X-ray images, the brighter area(s) represent compressed layer(s) with high density, whereas in the wood specimens, the darker area(s) denote compressed layer(s). The differences and boundaries between the compressed and uncompressed layers were extremely clear, and the top and bottom surfaces paralleled each other. As a result of extended preheating, the compressed layers moved from wood surfaces to the center. When the preheating time ranged from 0 to 360 s, two compressed layers with high density can be observed. When the preheating time was increased from 360 to 480 s, the two compressed layers merged into one, but the density in the center along the thickness was still comparatively less than that in other areas of the compressed layers. Further extending the preheating time to 600 s resulted in a thinner compressed layer with higher density. Regardless of compressed layer(s) positions(s), the density of the compressed layer(s) reached 800 kg/m3.
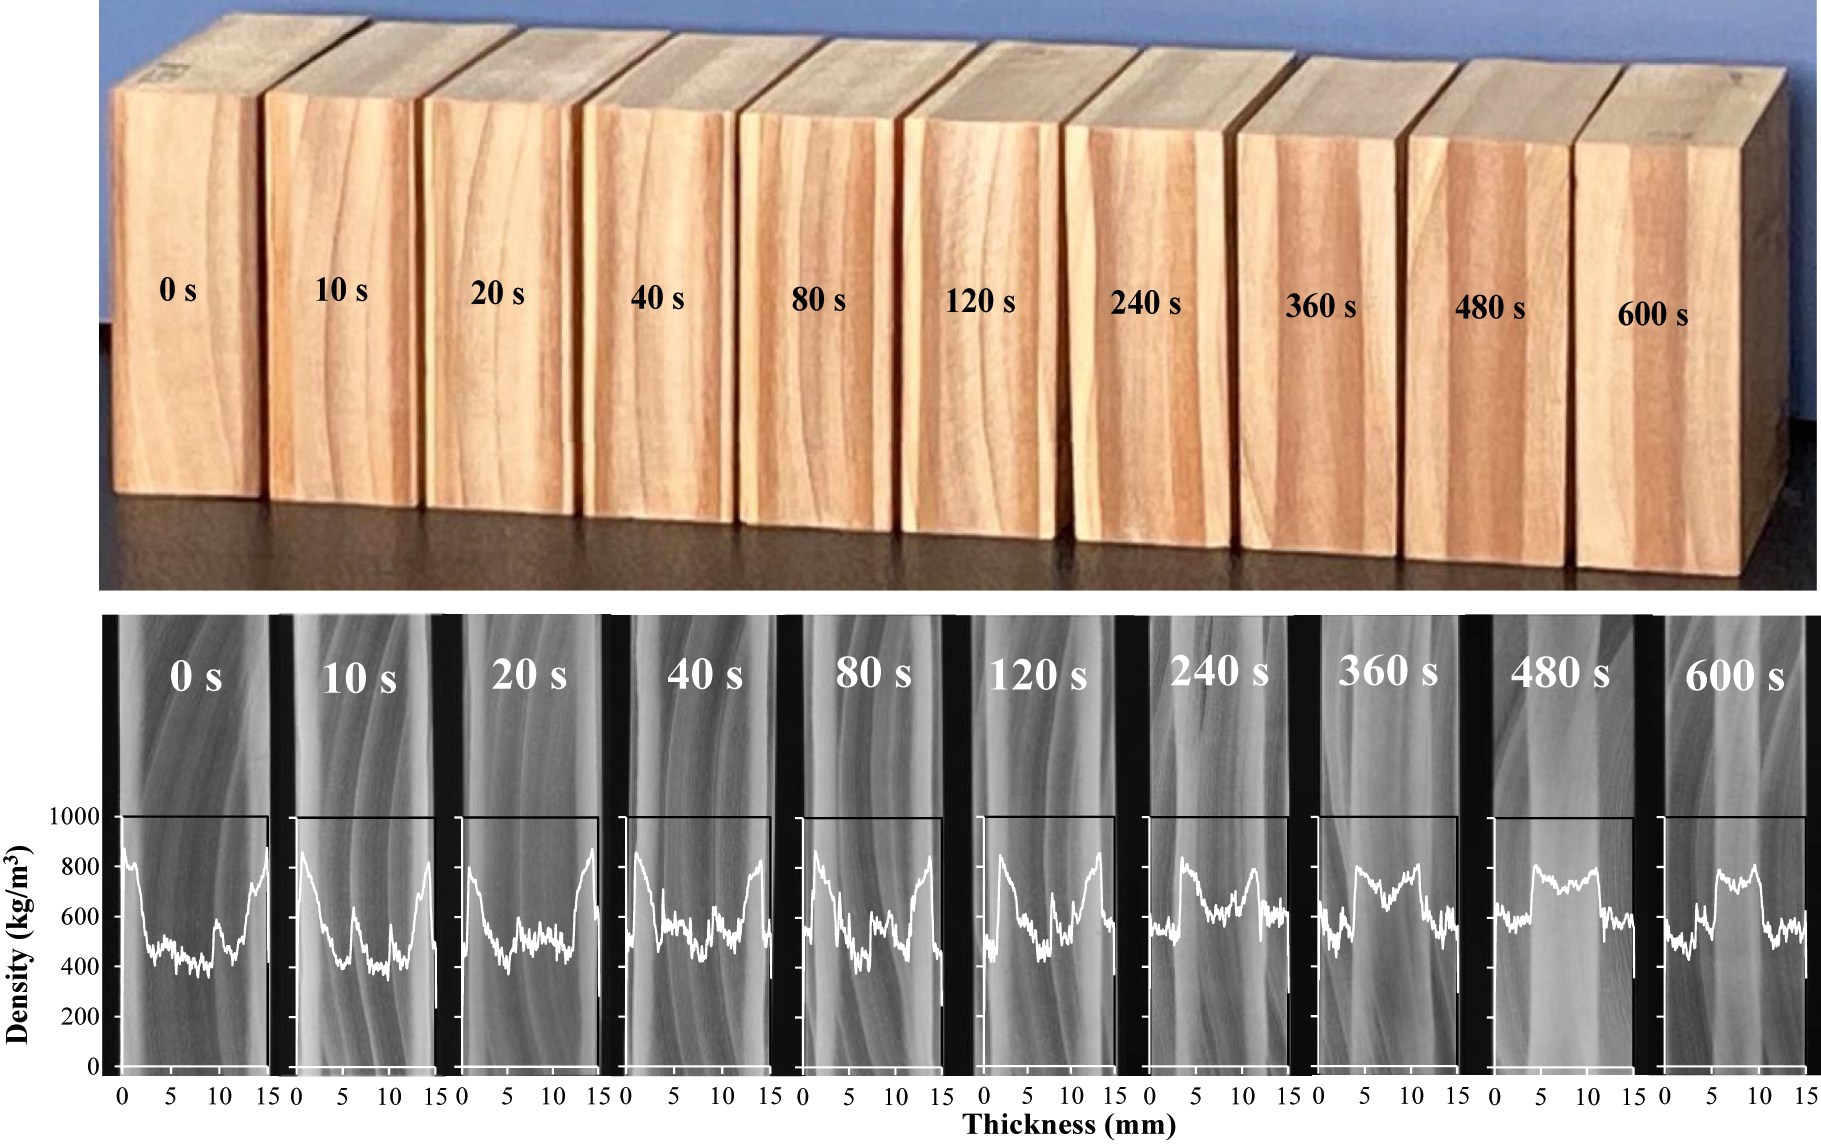
(Upper) Sandwich compressed wood specimens and (lower) their associated soft X-ray images, and density distribution (white highlighted profiles in the soft X-ray images) in the sandwich compressed wood. In sandwich compressed wood specimens, the darker layers represent the compressed layers, while the brighter layers in the soft X-ray images represent compressed layers.
Figure 10 illustrates the relationship between the positions of MC peak and compressed layer(s) center along wood thickness. Both the distance from compressed layer(s) and MC peak to their associated surfaces linearly increased with the extended preheating time. The linear trends of compressed layer(s) position(s) versus preheating time and that of MC peak position(s) versus preheating time were extremely consistent and almost paralleled to each other.

Preheating time versus positions of MC peak(s) and compressed layer(s).
According to Peneru’s study (2006), when MC increased from 6 to 12%, wood initial compressing stress reduced from 17.9 to 11.0 MPa. Further increasing MC to 20% led to only 5.98 MPa of the initial compressing stress. The density distribution and formation of wood sandwich compression can be explained by the dependence of the initial compressing stress of wood on MC. In this study, the water/moisture distribution along wood thickness was regulated by immersing wood in water, conditioning in sealed plastic bags and preheating with hot press platens. A MC variation over 5% along wood thickness contributed to yield stress gradient or variation, which primarily resulted in sandwich compression formation. Upon loading, wood layer(s) with high MC can be compressed easily. Since the total compression of top and bottom surfaces was 5 mm, the whole process of compression is completed once the layers of high MC are compressed. The distance between the compressed layer(s) and its associated surface was 2 mm less, which further confirmed the consistency between the positions of MC peaks(s) and compressed layer(s) before and after sandwich compression.
The changes in the positions of MC peak(s) and compressed layer(s) resulting from the logarithm of preheating time were also investigated. Figure 11 shows the positions of MC peak(s) and compressed layer(s) versus the logarithm of preheating time. The profiles were simulated by mathematic functions with the determination co-efficiency as high as 0.965. Distances of MC peak(s) and compressed layer(s) from the associated wood surfaces increased logarithmically with preheating time, which suggests variation in the distances of MC peak(s) and compressed layer(s) from their associated wood surfaces as a result of decline in preheating time. This model with such a high degree of fit can be used for predicting the position(s) of compressed layer(s) in sandwich compressed wood.

Logarithm of preheating time versus positions of MC peaks and compressed layer(s).
Based on the high consistency between compressed layer(s) and MC peak(s) in terms of their positions, it can be concluded that the compressed layer(s) formation was essentially relevant to water/moisture migration and distribution in wood during preheating. Previous studies showed that wood cells in the uncompressed areas of sandwich compressed wood were intact, while wood cells in the compressed layer(s) were greatly deformed (Li et al. 2018; Wu et al. 2019). During sandwich compression, wood is not boiled in water or steamed for softening, but water absorption on wood surfaces during preheating results in softening. Mechanical compression after preheating contributes to the co-existence of compressed layer(s) and uncompressed area(s), which is due to the variation in the degree of wood surface/interior softening along the thickness. However, to completely elucidate the mechanism of wood sandwich compression, variables affecting wood softening need to be completely investigated from the perspectives of temperature distribution in the wood interior and response of yield stress to hygrothermal treatment.
4 Conclusions
High MC layer(s) along wood thickness played a key role in sandwich compression formation. After surfaces wetting, conditioning and preheating by hot press, high MC layer(s) with over 5% MC higher than other areas in wood formed along wood thickness. Prolonged preheating shifted high MC layer(s) from the wood surface to the center. When the compressing ratio was 25%, only high MC layer(s) were compressed, while all the other layers were uncompressed, which contributed to wood sandwich compression. The distances between compressed layer(s) position(s) and their associated wood surfaces increased logarithmically with the extended preheating time. The logarithmical model can be used to predict the position(s) of compressed layer(s) in sandwich compressed wood.
Funding source: National Natural Science Foundation of China
Award Identifier / Grant number: 32071690
Award Identifier / Grant number: 31670557
-
Author contributions: All authors have approved this version of the article and agreed to its submission in your journal.
-
Research funding: The authors acknowledge the financial support of the National Natural Science Foundation of China (grant nos. 32071690; 31670557).
-
Conflict of interest statement: The authors declare no conflicts of interest regarding this article.
-
Compliance with ethical standards: The manuscript has not been published previously and is not under consideration for publication elsewhere. In addition, the authors declare that they fulfill all the ethical responsibilities required by the Committee on Publication Ethics (COPE).
References
Bao, F. and Lv, J. (1992). A study on fluid permeability of important Chinese wood. Scientia Silver Snicae 28: 237–246.Search in Google Scholar
Cai, Z. (2008). A new method of determining moisture gradient in wood. For. Prod. J. 58: 41–45.Search in Google Scholar
Furuta, Y., Nakajima, M., Nakanii, E., and Ohkoshi, M. (2010). The effects of lignin and hemicelluloses on thermal-softing properties of water-swollen wood. Mokuzai Gakkaishi 56: 132–138, https://doi.org/10.2488/jwrs.56.132.Search in Google Scholar
Gao, Z., Huang, R., Lu, J., Chen, Z., Guo, F., and Zhan, T. (2016). Sandwich compression of wood: control of creating density gradient on lumber thickness and properties of compressed wood. Wood Sci. Technol. 50: 833–844, https://doi.org/10.1007/s00226-016-0824-2.Search in Google Scholar
Gao, Z., Huang, R., Chang, J., Li, R., Wu, Y., and Wang, Y. (2019). Sandwich compression of wood: effects of preheating time and moisture distribution on the formation of compressed layer(s). Eur. J. Wood Wood Prod. 77: 219–227, https://doi.org/10.1007/s00107-018-1377-x.Search in Google Scholar
Goring, D.A.I. (1963). Thermal soft of lignin, hemicellulose and cellulose. Pulp Pap. Mag. Can. 64: 517–527.Search in Google Scholar
Huang, R., Wang, Y., Zhao, Y., Lv, J., and Zhang, Y. (2012). Sandwich compression of wood by hygro-thermal control. Mokuzai Gakkaishi 58: 84–89, https://doi.org/10.2488/jwrs.58.84.Search in Google Scholar
Huang, R., Fujimoto, N., Sakagami, H., and Feng, S. (2021). Sandwich compression of sugi (Cryptomeria japonica) and hinoki (Chamaecyparis obtuse) wood: density distribution, surface hardness and their controllability. J. Wood Sci. 67: 1–10, https://doi.org/10.1186/s10086-021-01970-y.Search in Google Scholar
Inoue, M., Kadokawa, N., Nishio, J., and Norimoto, M. (1993). Permanent fixation of compressive deformation by hygro-thermal treatment using moisture in wood. Wood Res. 29: 54–61.Search in Google Scholar
Inoue, M., Kodama, J., Yamamoto, Y., and Norimoto, M. (1998). Dimensional stabilization of compressed wood using high-frequency heating. Mokuzai Gakkaishi 44: 410–416.Search in Google Scholar
Kamke, F.A. and Rathi, V.M. (2011). Apparatus for viscoelastic thermal compression of wood. Eur. J. Wood Wood Prod. 69: 483–487, https://doi.org/10.1007/s0v0107-010-0461-7.Search in Google Scholar
Kitamori, A., Jung, K., Mori, T., and Komatsu, K. (2010). Mechanical properties of compressed wood in accordance with the compression ratio. Mokuzai Gakkaisi 56: 67–78, https://doi.org/10.2488/jwrs.56.67.Search in Google Scholar
Kuroda, N. and Siau, J.F. (1988). Evidence of nonlinear flow in softwoods from wood permeability measurements. Wood Fiber Sci. 20: 162–169.Search in Google Scholar
Kutnar, A., Kamke, F.A., and Sernek, M. (2009). Density profile and morphology of viscoelastic thermal compressed wood. Wood Sci. Technol. 43: 57–68, https://doi.org/10.1007/s00226-008-0198-1.Search in Google Scholar
Laine, K., Rautkari, L., and Hughes, M. (2013). The effect of process parameters on the hardness of surface densified Scots pine solid wood. Eur. J. Wood Wood Prod. 71: 13–16, https://doi.org/10.1007/s00107-012-0649-0.Search in Google Scholar
Li, R., Gao, Z., Feng, S., Chang, J., Wu, Y., and Huang, R. (2018). Effects of preheating temperatures on the formation of sandwich compression and density distribution in the compressed wood. J. Wood Sci. 64: 751–757, https://doi.org/10.1007/s10086-018-1758-0.Search in Google Scholar
Li, X., Cai, Z., and Fu, F. (2010). A new X ray scanning method for measuring the internal moisture content in wood drying. Scientia Silver Snicae 46: 122–127.Search in Google Scholar
Liu, Y., Norimoto, M., and Morooka, T. (1993). The large compressive deformation of wood in the transverse direction I. Relationships between stress-strain diagram and specific gravities of wood. Mokuzai Gakkaishi 39: 1140–1145.Search in Google Scholar
Norimoto, M. (1993). Large compressive deformation in wood. Mokuzai Gakkaishi 39: 867–874.Search in Google Scholar
Penneru, A.P., Jayaraman, K., and Bhattacharyya, D. (2005). Strain analysis in bulk forming of wood. Holzforschung 59: 456–458, https://doi.org/10.1515/hf.2005.075.Search in Google Scholar
Penneru, A.P., Jayaraman, K., and Bhattacharyya, D. (2006). Viscoelastic behaviour of solid wood under compressive loading. Holzforschung 60: 294–298, https://doi.org/10.1515/hf.2006.047.Search in Google Scholar
Penneru, A.P., Bhattacharyya, D., and Jayaraman, K. (2009). Forming limits for the bulk forming of solid wood. Holzforschung 63: 479–481, https://doi.org/10.1515/hf.2009.080.Search in Google Scholar
Salmen, L. (1982). Temperature and water induced softening behavior of wood fiber based materials, PhD thesis. Sweden: The Royal Institute of Technology.Search in Google Scholar
Takamura, N. (1968). Studies on hot pressing and drying process in the production of fiberboard III. Softening of fiber components in hot pressing of fiber mat. Mokuzai Gakkaishi 14: 75–79.Search in Google Scholar
Weichert, L. (1963). Investigations on sorption and swelling of spruce, beech and compressed beech wood at temperatures between 20 °C and 100 °C. Holz Roh. Werkst. 21: 290–300, https://doi.org/10.1007/bf02610962.Search in Google Scholar
Wu, Y., Qin, L., Huang, R., Gao, Z., and Li, R. (2019). Effects of preheating temperature, preheating time and their interaction on the sandwich structure formation and density profile of sandwich compressed wood. J. Wood Sci. 65: 1–10, https://doi.org/10.1186/s10086-019-1791-7.Search in Google Scholar
Xiang, E., Feng, S., Yang, S., and Huang, R. (2020). Sandwich compression of wood: effect of superheated steam treatment on sandwich compression fixation and its mechanisms. Wood Sci. Technol. 54: 1529–1549, https://doi.org/10.1007/s00226-020-01237-7.Search in Google Scholar
Yan, J. and Wang, Y. (2014). Engineering thermodynamics, 2nd ed. Beijing: China Electric Power Press, pp. 181–182.Search in Google Scholar
© 2022 the author(s), published by De Gruyter, Berlin/Boston
This work is licensed under the Creative Commons Attribution 4.0 International License.
Articles in the same Issue
- Frontmatter
- Original Articles
- Intra-species variation in maximum moisture content, cell-wall density and porosity of hardwoods
- Fractal dimension of wood pores from pore size distribution
- Fatigue testing of wood up to one billion load cycles
- The influence of vacuum heat treatment on the pore structure of earlywood and latewood of larch
- The relationship between color and mechanical properties of heat-treated wood predicted based on support vector machines model
- Effect of water/moisture migration in wood preheated by hot press on sandwich compression formation
- Quercetin-grafted modification to improve wood decay resistance
- Organosolv delignification of birch wood (Betula pendula): DMSO/water pulping optimization
- Alkali lignin as a pH response bifunctional material with both adsorption and flocculation for wastewater treatment
- Evaluation of the mechanical properties of different parts of bending bamboo culm by nanointendation