Cellular-level chemical changes in Japanese beech (Fagus crenata Blume) during artificial weathering
-
Toru Kanbayashi
 ,
Masahiro Matsunaga
,
Masahiro Matsunaga

Abstract
Since wood chemical components can be depolymerized and modified by weathering, a better understanding of the mechanisms governing these processes in needed to develop effective protection methods for wood surfaces. Unfortunately, very little has been reported about the micro-scale chemical changes in wood, particularly hardwood, during weathering. The purpose of the present work is to determine the degradation behavior of Japanese beech (Fagus crenata Blume) under artificial weathering at the cellular-level. Herein, the structural and micro-distributional changes in wood components during weathering were investigated using micro-Raman spectral and chemical mapping analyses. The Raman spectra showed that weathering facilitated lignin degradation and modification. The degradation behavior of lignin differed depending on the type of wood tissue. The rate of lignin reduction followed a descending order: vessel element > axial parenchyma cell > wood fiber. Raman mapping determined that cellular-level lignin reduction on the surface layers differed for wood species. Although lignin degradation of cedar tracheids proceeded from both the surface and the cell lumen, the lignin in beech fibers degraded according to the depth.
1 Introduction
Wood products for outdoor purposes, especially for above-ground placement, are often subjected to weather-related damage caused by factors such as exposure to sunlight, rain, temperature, humidity, and air pollutants (Csanády et al. 2015; Evans et al. 2005; Feist and Hon 1984; Williams 2005). When multiple factors occur in combination, the chemical components in wood are rapidly depolymerized and modified, as evidenced by the discoloration, roughening, and checking effects observed on wood surfaces. Therefore, it is necessary to improve the long-term weather durability of wood products for applications in outdoor conditions.
Understanding the fundamental mechanisms governing weather-related degradation is important for developing effective wood protection processes (Evans et al. 2005). Of the many weather-related factors, sunlight is thought to wreak the most damage to wood cell walls due to the formation of free radicals as ultraviolet (UV) radiation is readily absorbed by lignin, which, in turn, promotes depolymerization (Feist and Hon 1984). It is estimated, on the basis of the absorption coefficient of lignin, that 80–95% of the degradation observed in wood due to UV irradiation results from lignin photodegradation (Norrström 1969). The observed discoloration is due to the photo-oxidation of lignin, which, in turn, promotes the formation of new chromophores, namely, o- and p-quinonoids (Lin and Kringstad 1971). When lignin is photochemically depolymerized, the low molecular weight lignin fragments are leached out of the cell walls by rain, causing surface roughening and checking (Csanády et al. 2015; Evans et al. 2005; Feist and Hon 1984; Williams 2005).
The degradation of wood by weathering occurs on its surface layer. Earlier studies estimated that the depth to which weathering degradation extended in wood varied from 200 to 2540 µm (Browne and Simonson 1957; Hon and Ifju 1978). However, later studies in which Fourier transform infrared (FT-IR) microscopy was employed have revealed that the light penetration depth and the spreading rate of the degraded layer depended on the wavelength of the light source (Kataoka et al. 2007), the exposure time to irradiation (Kataoka and Kiguchi 2001; Kataoka et al. 2004), and the density of the wood sample (Kataoka et al. 2005). Depth analysis was conducted using various techniques, including histochemical staining (Bamber and Summerville 1981; Park et al. 1996), diffuse reflectance FT-IR (DRIFTS) (Horn et al. 1994; Sudiyani et al. 2003), FT-IR photoacoustic spectroscopy (FTIR-PAS) (Yamauchi et al. 2004), tensile strength measurements (Jirous-Rajkovic et al. 2004), and color measurements (Živković et al. 2014). In our previous study, we have applied a confocal Raman microscopy, which is useful to evaluate the distribution of the wood chemical components with a high spatial resolution (Agarwal 2006; Gierlinger and Schwanninger 2006; Hänninen et al. 2011; Schmidt et al. 2009; Zhang et al. 2012), to the depth profiling analysis for photodegraded wood surfaces (Kanbayashi et al. 2018a). Additionally, we visualized the micro-distributional changes in the chemical components of wood surfaces during weathering (Kanbayashi et al. 2018b). These studies were conducted using Japanese cedar (Cryptomeria japonica D. Don), which is a softwood.
Hardwood is composed of various tissues, namely, wood fibers, vessel elements, and parenchyma cells (Fengel and Wegener 1989). These wood tissues vary in shape, size, and chemical compositions (Fergus and Goring 1970; Saka and Goring 1988). These differences are expected to influence the degradation behavior of the respective tissues. Confocal Raman microscopy has been applied to the cellular-level analysis for weathered rubber wood (Hevea brasiliensis Muell. Arg.), which is a hardwood (Olaniran et al. 2019). However, differences in the chemical changes between different types of tissues during weathering have not been reported. In this study, therefore, a topochemical analysis was conducted on weather-degraded surfaces of Japanese beech (Fagus crenata Blume), which is one of the most common and widely distributed hardwood species in Japan, and a comparative study on the cellular-level chemical changes in wood tissues was performed using confocal Raman microscopy.
2 Materials and methods
2.1 Preparation of the wood samples
Wood specimens were obtained from the air-dried Japanese beech sapwood. The specimens were cut and classified as either panels that were 140 (L, longitudinal) × 25 (R, radial) × 9 mm (T, tangential) in dimensions or small blocks that measured 10 (L) × 10 (R) × 5 mm (T) in dimensions. The radial surface of the panel samples was smoothed with a planer, whereas the small block samples were sliced with a TU-213 microtome (Yamato Kohki Industry, Saitama, Japan) into 20-µm-thick cross-sections before being subjected to the artificial weathering experiment.
2.2 Artificial weathering tests
The radial faces of the panel samples and the thin cross-section samples were exposed to artificial weathering in a Ci4000 Xenon Arc Weather-Ometer (Atlas, Chicago, USA) for up to 500 h (for the panels) and 24 h (for the thin sections). The chamber air temperature and the black panel temperature were set at 38 and 65 °C, respectively. The weathering program was continuous exposure to light with an irradiance level of 0.51 W/m2 at 340 nm and 18 min long “rain” simulations using deionized water at 2 h intervals. The thin, weathered cross-sections were kept between glass slides and coverslips using a drop of water.
2.3 Cryo-sectioning procedures
Artificially weathered panel samples were cut into small cubes that were 5 (L) × 5 (R) × 5 mm (T) in dimensions. Since the weathered surface layer was very brittle, the sectioning experiment was conducted using a Lecia CM1850 cryostat (Leica Microsystems, Wetzlar, Germany) at a temperature of −20 °C. The cube samples in water saturated conditions were embedded in Tissue-Tek® O. C. T. compound (Sakura Finetek Japan, Tokyo, Japan), flash-frozen using liquid nitrogen, and then sliced transversely with the cryostat into 20-µm-thick samples through the weathered surface. The thin sections were mounted on a 20-µm-deep Bacteria Counter A161 hemocytometer (Sunlead Glass, Saitama, Japan) with a drop of water, closed with a coverslip, and fixed with a clasp. Then, the hemocytometer was soaked overnight in distilled water to remove the O. C. T. compound.
2.4 Raman microscopy measurements
Raman spectra were recorded using a RAMANplus laser confocal Raman microscope system (Nanophoton, Osaka, Japan) equipped with an Eclipse 90i optical microscope (Nikon, Tokyo, Japan), a motorized “x, y” stage (Sigma Koki, Tokyo, Japan), and a CFI Plan Fluor 60 × water immersion objective lens (1.0 NA, Nikon). The wavelength and the intensity of the excitation laser were set to 532 nm and 25 mW, respectively. The theoretical (diffraction limited) lateral resolution of the sample was approximately 0.32 µm (0.61λ/NA), where λ is the wavelength of the laser and NA is the numerical aperture of the objective lens. The scattered Raman light was collected by using a 600-grooves/mm grating and the slit width of the spectrograph was fixed at 50 µm.
Damage caused by the laser heat was avoided, and high signal-to-noise ratio spectra were obtained by recording the Raman spectra using a 10-cycle point analysis in which each cycle consisted of a 0.1 s integration time for each spot. For our study, the 10 spectra recorded at the same position were averaged. The averaged spectra were collected at 10 different locations within a cell. Moreover, the averaged spectra from 10 adjacent cells were again averaged. All the spectra were obtained from the middle layer of the secondary wall (S2). Raman mapping experiments were performed at 0.5 µm intervals, and the spectra were recorded by averaging two cycles, each consisting of a 0.1 s integration time. All the measurement positions were located on earlywood.
The RAMAN Imager and RAMAN Viewer software (Nanophoton) were used for spectral analysis and image processing, respectively. The background of the fluorescence spectra was removed by conducting baseline correction on the raw spectral data. The Raman spectra were smoothed using the Savitzky–Golay algorithm. In the point analysis, normalization was done using the band’s intensity at 1093 cm−1, which was assigned to C–O and C–C stretching bands in the polysaccharide components (Wiley and Atalla 1987), because the intensity of this band has hardly changed during weathering. In the mapping analysis, the Raman spectra were not normalized. The spectral range was set from 900 to 1800 cm−1. The Raman bands associated with cellulose and hemicellulose are referred to collectively as “polysaccharides” in this study since these bands overlapped with each other, and most of the hemicellulose bands were not clearly visible in the Raman spectra obtained (Agarwal and Ralph 1997; Gierlinger et al. 2013). The band assignments from previous reports were summarized in Table 1.
Raman bands and their assignment to wood components.
| Raman band (cm−1) | Component | Band assignment |
|---|---|---|
| 1732 | Hemicellulose | C=O stretch |
| 1656 | Lignin | C=C stretch of coniferyl/sinapyl alcohol and γ–C=O stretch of coniferyl/sinapyl aldehyde |
| 1598 | Lignin | Aromatic ring stretch |
| 1373 | Polysaccharides | HCC, HCO, and HOC bend |
| 1329 | Lignin | Aliphatic O–H bend |
| 1150 | Polysaccharides | CC and CO stretch, HCC and HCO bend |
| 1115 | Polysaccharides | C–O and C–C stretch |
| 1093 | Polysaccharides | C–O and C–C stretch |
| 1039 | Lignin | C–O of aryl–O–CH3 and aryl–OH |
Assignments are based on previously published literature (Agarwal 1999; Agarwal et al. 2011; Kenton and Rubinovitz 1990; Socrates 2001; Wiley and Atalla 1987).
3 Results and discussion
3.1 Analysis of the photodegraded surface layer
The Raman spectra of the S2 of outermost wood fibers after exposure to prolonged weather conditions are shown in Figure 1. Most of the polysaccharide bands (i.e., 1115, 1150, and 1373 cm−1) exhibited slight changes. This is caused by the modification and/or removal of the hemicellulose. On the other hand, the lignin bands’ intensity decreased markedly as a function of the exposure time (Figure 1a). The lignin bands observed at 1039, 1329, and 1656 cm−1 were due to the C–O moiety of aryl–O–CH3 and aryl–OH groups, the aliphatic O–H bend, and the ethylenic C=C stretching in the coniferyl/sinapyl alcohol units and the γ–C=O stretching in the coniferyl/sinapyl aldehyde units, respectively (Agarwal 1999; Agarwal et al. 2011); the associated intensity of these bands decreased significantly. The residual peak at 1329 cm−1 after 500 h of exposure may be due to the presence of overlapped cellulose peak (Gierlinger and Schwanninger 2006). The intensity of the band observed at 1656 cm−1 exhibited a particularly notable reduction in its signal, which mostly disappeared after 100 h of exposure. Conversely, the intensity of the aromatic ring band observed at 1598 cm−1 (Agarwal 1999; Agarwal et al. 2011) decreased gradually, and its signal remained even after 500 h of exposure. These results indicated that even though the lignin molecular structures changed after short term exposure, the many associated aromatic moieties were hardier and relatively less prone to weather induced degradation.
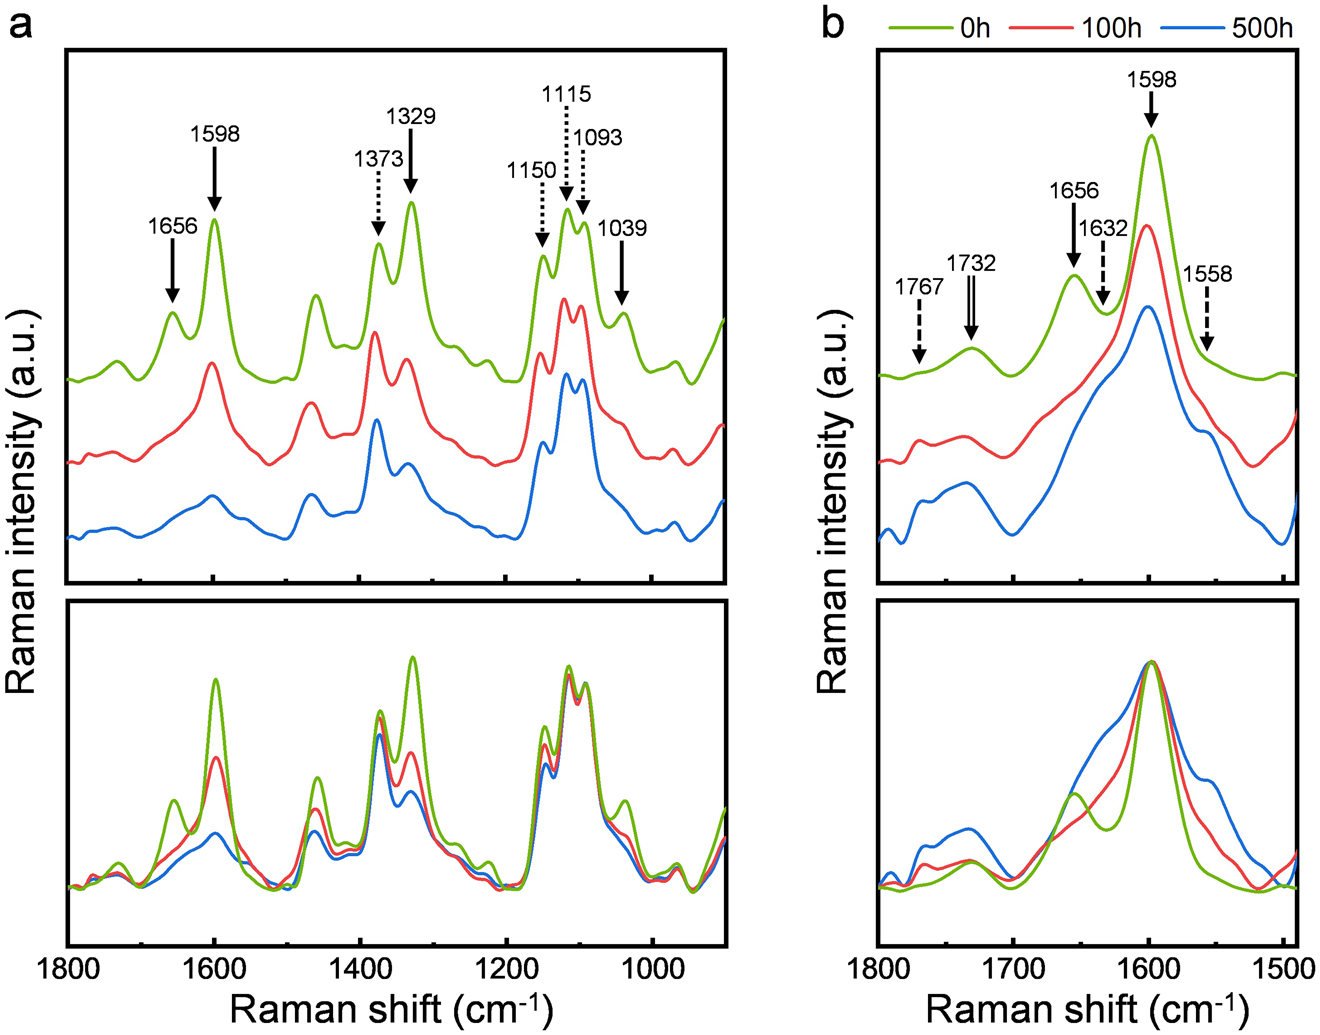
(a) Averaged Raman spectra of the S2 of outermost wood fibers after exposure to simulated weather conditions from the radial direction for specific time periods. (b) The enlarged spectra of the region between 1490 and 1800 cm−1, which was normalized for the intense aromatic band observed at 1598 cm−1. The lower section shows the baseline corrected spectra. The solid arrows represent lignin, dotted arrows represent polysaccharides, double-lined arrows represent hemicellulose, and the dashed arrows are for the new peaks.
As shown in Figure 1b, there were several pronounced changes in the band region between 1490 and 1800 cm−1 that were attributed to the characteristics of lignin. Although reductions were noted in the ethylenic C=C and γ–C=O bonds mentioned above, several new peaks were observed, in particular, the shoulder at 1558 cm−1, which was attributed to the formation of quinone-type structures known to induce yellowing in wood (Agarwal and Atalla 2000). The appearance of the shoulder at 1632 cm−1 and the new peak at 1767 cm−1 were due to the newly formed C=C of the stilbene and carbonyl groups, respectively (Agarwal and Atalla 2000; Agarwal et al. 2011). The broadening of the aromatic band at 1598 cm−1 was linked to the photochemical oxidization of the aromatic molecules. The band intensity of carbonyl C=O stretching observed at 1732 cm−1 decreased temporarily after 100 h, with a notable increase after prolonged exposure. This carbonyl band was assigned to both hemicellulose (Kenton and Rubinovitz 1990) and photo-oxidized lignin (Kanbayashi et al. 2018a). Sudiyani et al. (1999) reported that weathering promoted the destruction of the lignin–hemicellulose matrix, resulting in the leaching of hemicellulose from the cell walls. Therefore, the initial carbonyl reduction arose from the loss of hemicellulose, and the progress of the lignin degradation process resulted in the subsequently observed increase.
The distributional changes in the main polymers of the surface layer cell walls during weathering were visualized using Raman mapping (Figure 2a–f). Here the distribution of the polysaccharides and lignin was specified by the band regions of the CC and CO stretching groups between 1089 and 1164 cm−1 (Wiley and Atalla 1987; Socrates 2001), and the aromatic ring vibrations between 1570 and 1630 cm−1, respectively. The use of Raman intensity profiles based on the mapping data set facilitated easier visualization of the above-mentioned distribution patterns (Figure 2g–i).

Raman mapping of the cross-sections of the surface regions (a, b) before and (c, d) after 100 h and (e, f) 500 h of exposure to simulated weather conditions from the radial direction. The blue and red maps indicate the distribution of the polysaccharides (1089–1164 cm−1) and lignin (1570–1630 cm−1), respectively. The Raman intensity profiles of the outermost wood fibers (g) before and (h) after 100 h and (i) 500 h of exposure to simulated weather conditions along the yellow lines in the bright field images. SW, secondary wall; CML, compound middle lamella; and L, cell lumen.
During the weathering process, both the polysaccharide and lignin content in wood fibers decreased by varying degrees, and a gradual decrease in the degradation depending on the depth was observed. The reduction in the lignin content progressed expediently (Figure 2b, d, f), particularly in the compound middle lamella (CML) (Figure 2g–i, red plot); conversely, the polysaccharides showed only slight changes in all morphological regions (Figure 2a, c, e). The reduction of the polysaccharide content was mainly due to the loss of hemicellulose triggered by the UV-driven decomposition of lignin into water-soluble fragments and the subsequent leaching of hemicellulose/lignin fragments (Sudiyani et al. 1999). It is noteworthy that the lignin maps may also slightly reflect the structural change since the band intensity at 1598 cm−1 can be affected by the destruction and modification of the conjugated structures (Agarwal 1999; Agarwal and Atalla 2000).
The noted patterns of change in the lignin distribution in wood fibers were different from those observed in tracheids. For latewood tracheids in cedar wood, we previously reported that the lignin degradation process proceeded from both the exposed surface and the cell lumen (Kanbayashi et al. 2018b). Conversely, the results of this study have shown that the lignin reduction in the secondary walls of beech fibers extended according to the depth from the surface and was almost uniform at the same depth (Figure 2d, f). Previous studies demonstrated that the inhomogeneous lignin reduction observed in the latewood tracheids arose from the scraping and leaching effects of the photodegraded lignin fragments located in the cell lumen exerted by flowing water (Kanbayashi et al. 2018b). The differences of the lignin reduction behavior between latewood tracheids and wood fibers were probably ascribed to the ease with which water flowed through their respective lumina. Besides, the difference in chemical composition between tracheids and wood fibers may affect their degradation behavior. Lignin in softwood tracheids is predominantly composed of guaiacyl (G) units, while that in hardwood fibers consist of a mixture of G and syringyl (S) units (Donaldson 2001). The lignin photodegradation behavior differs for the proportion of G and S units (Reinprecht et al. 2018). However, more detailed work is necessary to solve the mechanism of lignin reduction behavior.
3.2 Comparison of weathering effects on different tissues
In this section, the effects of weathering on various wood tissues were compared by monitoring samples that had been exposed to simulated weather along the transverse direction. Figure 3 describes the Raman mapping images of the distribution of the polysaccharides and lignin obtained from the cross-section of earlywood during the weathering experiments. We noted that the polysaccharides showed only slight change, whereas lignin reduction proceeded with prolonged exposure. Even though many cell corners were delignified after 24 h of exposure, cell corners remaining relatively large amount of lignin were partially detected (as indicated by arrows) in Figure 3f. This result indicated nonuniformity in the reactions of the lignin in the cell corners after exposure to simulated weather conditions since lignin structure in cell corners differs among cell types (Saka and Goring 1988), and the photodegradability of lignin is affected by its chemical structure (Reinprecht et al. 2018). It is undeniable because of the original lignin content and the size of cell corners. The lignin content in cell corners varies considerably from place to place (Daniel et al. 1991; Tirumalai et al. 1996).

Raman mapping of the sample cross-sections (a, b) before and (c, d) after 6 h and (e, f) 24 h of exposure to simulated weather conditions from the transverse direction. The blue and red maps indicate the distribution of the polysaccharides (1089–1164 cm−1) and lignin (1570–1630 cm−1), respectively. WF, wood fiber; V, vessel element; and APC, axial parenchyma cell. The arrows represent the cell corner.
The Raman spectra acquired for the three types of tissues, namely, wood fibers, vessel elements, and axial parenchyma cells, are presented in Figure 4. The spectral features varied among the types of tissues, as shown in the spectra of the unexposed samples. Here, the lignin bands’ intensity was high in vessel elements and axial parenchyma cells, but low in wood fibers. This spectral tendency coincides with previous reports that the vessel elements and parenchyma cells are more lignified than the wood fibers (Fergus and Goring 1970; Saka and Goring 1988).

Averaged Raman spectra of (a) wood fibers, (b) vessel elements, and (c) axial parenchyma cells after specific periods of exposure to simulated weather conditions from the transverse direction. The lower section shows the baseline corrected spectra. Solid and dotted arrows indicate the peaks of lignin and polysaccharides, respectively.
Unfortunately, clear spectral data of the CML and the cell corners after weathering could not be obtained. Cogulet et al. (2016) reported that photo-irradiation led to the cleavage of the dibenzodioxocin structure in lignin and a subsequent increase in the free rotating 5–5′ linkage of the biphenyl structure. The 5–5′ free rotating linkages are fluorescence-emitting moieties (Lähdetie et al. 2013). Since the CML and the cell corners were highly lignified, their Raman signals were easily disturbed by strong fluorescence.
After 6 h of exposure, most of the lignin band intensities decreased slightly and still remained in all the tissues, whereas the ethylenic C=C and γ–C=O bonds observed at 1656 cm−1 had disappeared completely. These results indicated that these lignin structures were extremely sensitive to weathering. Prolonging the exposure for another 24 h led to a marked reduction in the intensity of the other lignin bands. However, this trend in the declining behavior was different for various types of tissues. The reduction rates of the aromatic ring band intensities observed at 1598 cm−1 from “No exposure” to “24 h exposure” were generally high and followed the order: vessel elements (73.3%) > axial parenchyma cell (57.2%) > wood fiber (45.3%). Past reports have shown that the lignin concentration in vessel elements, axial parenchyma cells, and wood fibers in Japanese beech were 27, 23, and 11%, respectively (Miyafuji et al. 2017). We noted that the lignin reduction rates of the various tissues generally followed the same pattern as that observed for their lignin content. In addition, the vessel lignin contains mainly G units while the parenchyma cell and wood fiber lignin contains a mixture of G and S units (Donaldson 2001). The proportions of G units in the vessel elements and S units in the wood fiber are particularly high in earlywood (Takabe et al. 1992). Reinprecht et al. (2018) reported that G units can be more easily photodegraded than S units. Thus, it was concluded that the susceptibility of various wood tissues to weathering is dependent on the concentration and S/G ratio of lignin in the respective tissues.
For the ray parenchyma cells, their G and S units’ proportion is close to the value of axial parenchyma cells (Fujii et al. 1987). Thus, the weathering degradation behavior of ray and axial parenchyma cells may be similar.
It is worth noting that this study was conducted on earlywood portions. The distribution of G and S units in wood fiber secondary wall is different among earlywood, latewood, and terminal zone of an annual ring (Takabe et al. 1992). Besides, that in vessel elements differs among earlywood and latewood. Additionally, G and S units are heterogeneously distributed in the longitudinal direction of a fusiform cell (Yoshinaga et al. 1997). The proportion of G and S units in the cell corner middle lamella varies among cell types (Saka and Goring 1988). The heterogeneous distribution of the G and S units can affect the cellular-level weatherability. Thus, it is necessary to examine the degradation behavior of more various morphological regions during weathering.
The presence of extractives reduced the extent of photodegradation of the other main wood components since photochemically oxidized extractives acted as energy traps; this, in turn, retarded the photodegradation of lignin (Chang et al. 2010; Pandey 2005). The concentration of extractives in the various wood tissues were shown to affect the photostability of the respective tissue. This was theorized as being one of the causes for the variations noted in the lignin degradation rates among the tissues. Unfortunately, the results of this study are based on sapwood, which has a low extractives content, and exact details on the cellular-level distribution of extractives in Japanese beech are mostly still unclear. Further investigations are needed to precisely define the relationship between the degradation behavior of various wood tissues and the extractives content of the respective tissues using not only sapwood but also heartwood.
4 Conclusions
Herein, the effects of weathering on the cell walls of Japanese beech were investigated using micro-Raman spectral and mapping techniques. Raman spectral analysis confirmed that exposure to simulated weather conditions promoted lignin deterioration and the formation of carbonyl groups and quinone- and stilbene-type structures. Additionally, the lignin’s photodegradability varied depending on the type of wood tissue, with vessel elements showing the most lignin degradation relative to parenchyma and, finally, wood fibers. Raman mapping analysis revealed that the degradation behavior of the surface cell walls was different for Japanese cedar and Japanese beech at the cellular-level. Prolonged weather exposure led to the preferential degradation of lignin in cedar tracheids from both the exposed surface and the cell lumen, whereas beech fibers degraded according to the depth from the surface. Details about the mechanisms governing weather-related degradation at the cellular-level are needed to enable further development of improved surface processing protocols for wood protection.
Funding source: Japan Society for the Promotion of Science
Award Identifier / Grant number: 20K15571
Funding source: Ministry of Education, Culture, Sports, Science and Technology
Award Identifier / Grant number: JPMXP09 S20NM0009
Acknowledgments
The authors would like to thank Dr. Shinya Hattori from the NIMS Molecule & Material Synthesis Platform for assistance in operating the laser confocal Raman microscope system.
Author contributions: All the authors have accepted responsibility for the entire content of this submitted manuscript and approved submission.
Research funding: This study was funded by the Japan Society for the Promotion of Science (JSPS) KAKENHI (no. 20K15571) and NIMS Molecule & Material Synthesis Platform in “Nanotechnology Platform Project” operated by the Ministry of Education, Culture, Sports, Science and Technology (MEXT), Japan (no. JPMXP09 S20NM0009).
Conflict of interest statement: The authors declare that they have no conflicts of interest regarding this article.
References
Agarwal, U.P. (1999). An overview of Raman spectroscopy as applied to lignocellulosic materials. In: Argyropoulos, D.S. (Ed.). Advances in lignocellulosics characterization. TAPPI Press, Atlanta GA, pp. 201–225.Suche in Google Scholar
Agarwal, U.P. (2006). Raman imaging to investigate ultrastructure and composition of plant cell walls: distribution of lignin and cellulose in black spruce wood (Picea mariana). Planta 224: 1141–1153, https://doi.org/10.1007/s00425-006-0295-z.Suche in Google Scholar
Agarwal, U.P. and Atalla, R.H. (2000). Using Raman spectroscopy to identify chromophores in lignin-lignocellulosics. In: Glasser, W.G., Northey, R.A., and Schultz, T.P. (Eds.). Lignin: historical, biological, and materials perspectives. ACS symposium series 742. American Chemical Society, Washington DC, pp. 250–264.10.1021/bk-2000-0742.ch011Suche in Google Scholar
Agarwal, U.P. and Ralph, S.A. (1997). FT-Raman spectroscopy of wood: identifying contributions of lignin and carbohydrate polymers in the spectrum of black spruce (Picea mariana). Appl. Spectrosc. 51: 1648–1655, https://doi.org/10.1366/0003702971939316.Suche in Google Scholar
Agarwal, U.P., McSweeny, J.D., and Ralph, S.A. (2011). FT-Raman investigation of milled wood lignins: softwood, hardwood, and chemically modified black spruce lignins. J. Wood Chem. Technol. 31: 324–344, https://doi.org/10.1080/02773813.2011.562338.Suche in Google Scholar
Bamber, R.K. and Summerville, R. (1981). Microscopic studies of the weathering of radiata pine sapwood. J. Inst. Wood Sci. 9: 84–87.Suche in Google Scholar
Browne, F.L. and Simonson, H.C. (1957). The penetration of light into wood. For. Prod. J. 7: 308–314.Suche in Google Scholar
Chang, T.C., Chang, H.T., Wu, C.L., Lin, H.Y., and Chang, S.T. (2010). Stabilizing effect of extractives on the photo-oxidation of Acacia confusa wood. Polym. Degrad. Stabil. 95: 1518–1522, https://doi.org/10.1016/j.polymdegradstab.2010.06.012.Suche in Google Scholar
Cogulet, A., Blanchet, P., and Landry, V. (2016). Wood degradation under UV irradiation: a lignin characterization. J. Photochem. Photobiol. B Biol. 158: 184–191, https://doi.org/10.1016/j.jphotobiol.2016.02.030.Suche in Google Scholar
Csanády, E., Magoss, E., and Tolvaj, L. (2015). Quality of machined wood surfaces. Springer International Publishing, Berlin.10.1007/978-3-319-22419-0Suche in Google Scholar
Daniel, G., Nilsson, T., and Pettersson, B. (1991). Poorly and non-lignified regions in the middle lamella cell corners of birch (Betula verrucosa) and other wood species. Int. Assoc. Wood Anat. Bull. 12: 70–83, https://doi.org/10.1163/22941932-90001206.Suche in Google Scholar
Donaldson, L.A. (2001). Lignification and lignin topochemistry ― an ultrastructural view. Phytochemistry 57: 859–873, https://doi.org/10.1016/s0031-9422(01)00049-8.Suche in Google Scholar
Evans, P., Chowdhury, M.J., Mathews, B., Schmalzl, K., Ayer, S., Kiguchi, M., and Kataoka, Y. (2005). Weathering and surface protection of wood. In: Kutz, M. (Ed.). Handbook of environmental degradation of materials. William Andrew Publishing, Norwich, pp. 277–297.10.1016/B978-081551500-5.50016-1Suche in Google Scholar
Feist, W.C. and Hon, D.N.S. (1984). Chemistry of weathering and protection. In: Rowell, R.M. (Ed.). The chemistry of solid wood. American Chemical Society, Washington DC, pp. 401–451.10.1021/ba-1984-0207.ch011Suche in Google Scholar
Fengel, D. and Wegener, G. (1989). Wood: chemistry, ultrastructure, reactions. De Gruyter, Berlin.Suche in Google Scholar
Fergus, B.J. and Goring, D.A.I. (1970). The distribution of lignin in birch wood as determined by ultraviolet microscopy. Holzforschung 24: 118–124, https://doi.org/10.1515/hfsg.1970.24.4.118.Suche in Google Scholar
Fujii, T., Shimizu, K., and Yamaguchi, A. (1987). Enzymatic saccharification on ultrathin sections and ultraviolet spectra of Japanese hardwoods and softwoods. Mokuzai Gakkaishi 33: 400–407.Suche in Google Scholar
Gierlinger, N. and Schwanninger, M. (2006). Chemical imaging of poplar wood cell walls by confocal Raman microscopy. Plant Physiol. 140: 1246–1254, https://doi.org/10.1104/pp.105.066993.Suche in Google Scholar
Gierlinger, N., Keplinger, T., Harrington, M., and Schwanninger, M. (2013). Raman imaging of lignocellulosic feedstock. In: van de Ven, T. and Kadla, J. (Eds.). Cellulose–biomass conversion. InTech, Rijeka, pp. 159–192.10.5772/50878Suche in Google Scholar
Hänninen, T., Kontturi, E., and Vuorinen, T. (2011). Distribution of lignin and its coniferyl alcohol and coniferyl aldehyde groups in Picea abies and Pinus sylvestris as observed by Raman imaging. Phytochemistry 72: 1889–1895, https://doi.org/10.1016/j.phytochem.2011.05.005.Suche in Google Scholar
Hon, D.N.S. and Ifju, G. (1978). Measuring penetration of light into wood by detection of photo-induced free radicals. Wood Sci. 11: 118–127.Suche in Google Scholar
Horn, B.A., Qiu, J., Owen, N.L., and Feist, W.C. (1994). FT-IR study of weathering effects in western redcedar and southern pine. Appl. Spectrosc. 48: 662–668, https://doi.org/10.1366/000370294774369072.Suche in Google Scholar
Jirous-Rajkovic, V., Turkulin, H., and Miller, E.R. (2004). Depth profile of UV-induced wood surface degradation. Surf. Coating. Int. B Coating. Trans. 87: 241–247, https://doi.org/10.1007/bf02699671.Suche in Google Scholar
Kanbayashi, T., Kataoka, Y., Ishikawa, A., Matsunaga, M., Kobayashi, M., and Kiguchi, M. (2018a). Depth profiling of photodegraded wood surfaces by confocal Raman microscopy. J. Wood Sci. 64: 169–172, https://doi.org/10.1007/s10086-018-1698-8.Suche in Google Scholar
Kanbayashi, T., Kataoka, Y., Ishikawa, A., Matsunaga, M., Kobayashi, M., and Kiguchi, M. (2018b). Confocal Raman microscopy reveals changes in chemical composition of wood surfaces exposed to artificial weathering. J. Photochem. Photobiol. B Biol. 187: 136–140, https://doi.org/10.1016/j.jphotobiol.2018.08.016.Suche in Google Scholar
Kataoka, Y. and Kiguchi, M. (2001). Depth profiling of photo-induced degradation in wood by FT-IR microspectroscopy. J. Wood Sci. 47: 325–327, https://doi.org/10.1007/bf00766722.Suche in Google Scholar
Kataoka, Y., Kiguchi, M., and Evans, P.D. (2004). Photodegradation depth profile and penetration of light in Japanese cedar earlywood (Cryptomeria japonica D. Don) exposed to artificial solar radiation. Surf. Coating. Int. B Coating. Trans. 87: 187–193, https://doi.org/10.1007/bf02699634.Suche in Google Scholar
Kataoka, Y., Kiguchi, M., Fujiwara, T., and Evans, P.D. (2005). The effects of within-species and between-species variation in wood density on the photodegradation depth profiles of sugi (Cryptomeria japonica) and hinoki (Chamaecyparis obtusa). J. Wood Sci. 51: 531–536, https://doi.org/10.1007/s10086-004-0685-4.Suche in Google Scholar
Kataoka, Y., Kiguchi, M., Williams, R.S., and Evans, P.D. (2007). Violet light causes photodegradation of wood beyond the zone affected by ultraviolet radiation. Holzforschung 61: 23–27, https://doi.org/10.1515/hf.2007.005.Suche in Google Scholar
Kenton, R.C. and Rubinovitz, R.L. (1990). FT-Raman investigations of forest products. Appl. Spectrosc. 44: 1377–1380, https://doi.org/10.1366/000370290789619658.Suche in Google Scholar
Lähdetie, A., Nousiainen, P., Sipilä, J., Tamminen, T., and Jääskeläinen, A.S. (2013). Laser-induced fluorescence (LIF) of lignin and lignin model compounds in Raman spectroscopy. Holzforschung 67: 531–538, https://doi.org/10.1515/hf-2012-0177.Suche in Google Scholar
Lin, Y. and Kringstad, K. (1971). Some reactions in the photoinduced discoloration of lignin. Norsk Skogindustri 25: 252–256.Suche in Google Scholar
Miyafuji, H., Komai, K., and Kanbayashi, T. (2017). Development of quantification method for lignin content in woody biomass by Raman micro-spectroscopy. Vib. Spectrosc. 88: 9–13, https://doi.org/10.1016/j.vibspec.2016.10.011.Suche in Google Scholar
Norrström, H. (1969). Light absorbing properties of pulp and pulp components. Part 2. Sulfite pulp. Sven. Papperstidning 72: 32–38.Suche in Google Scholar
Olaniran, S.O., Etienne, C., Keplinger, T., Olufemi, B., and Rüggeberg, M. (2019). Mechanical behaviour of acetylated rubber wood subjected to artificial weathering. Holzforschung 73: 1005–1016, https://doi.org/10.1515/hf-2018-0274.Suche in Google Scholar
Pandey, K.K. (2005). A note on the influence of extractives on the photo-discoloration and photo-degradation of wood. Polym. Degrad. Stabil. 87: 375–379, https://doi.org/10.1016/j.polymdegradstab.2004.09.007.Suche in Google Scholar
Park, B.S., Furuno, T., and Uehara, T. (1996). Histochemical changes of wood surfaces irradiated with ultraviolet light. Mokuzai Gakkaishi 42: 1–9.Suche in Google Scholar
Reinprecht, L., Mamoňová, M., Pánek, M., and Kačík, F. (2018). The impact of natural and artificial weathering on the visual, colour and structural changes of seven tropical woods. Eur. J. Wood Prod. 76: 175–190, https://doi.org/10.1007/s00107-017-1228-1.Suche in Google Scholar
Saka, S. and Goring, D.A.I. (1988). The distribution of lignin in white birch wood as determined by bromination with TEM-EDXA. Holzforschung 42: 149–153, https://doi.org/10.1515/hfsg.1988.42.3.149.Suche in Google Scholar
Schmidt, M., Schwartzberg, A.M., Perera, P.N., Weber-Bargioni, A., Carroll, A., Sarkar, P., Bosneaga, E., Urban, J.J., Song, J., Balakshin, B.Y., et al.. (2009). Label-free in situ imaging of lignification in the cell wall of low lignin transgenic Populus trichocarpa. Planta 230: 589–597, https://doi.org/10.1007/s00425-009-0963-x.Suche in Google Scholar
Socrates, G. (2001). Infrared and Raman characteristic group frequencies: tables and charts. John Wiley & Sons, Chichester.Suche in Google Scholar
Sudiyani, Y., Tsujiyama, S., Imamura, Y., Takahashi, M., Minato, K., and Kajita, H. (1999). Chemical characteristics of surfaces of hardwood and softwood deteriorated by weathering. J. Wood Sci. 45: 348–353, https://doi.org/10.1007/bf00833502.Suche in Google Scholar
Sudiyani, Y., Imamura, Y., Doi, S., and Yamauchi, S. (2003). Infrared spectroscopic investigations of weathering effects on the surface of tropical wood. J. Wood Sci. 49: 86–92, https://doi.org/10.1007/s100860300014.Suche in Google Scholar
Takabe, K., Miyauchi, S., Tsunoda, R., and Fukazawa, K. (1992). Distribution of guaiacyl and syringyl lignins in Japanese beech (Fagus crenata): variation within an annual ring. Int. Assoc. Wood Anat. Bull. 13: 105–112, https://doi.org/10.1163/22941932-90000561.Suche in Google Scholar
Tirumalai, V.C., Agarwal, U.P., and Obst, J.R. (1996). Heterogeneity of lignin concentration in cell corner middle lamella of white birch and black spruce. Wood Sci. Technol. 30: 99–104, https://doi.org/10.1007/bf00224961.Suche in Google Scholar
Wiley, J.H. and Atalla, R.H. (1987). Band assignments in the Raman spectra of celluloses. Carbohydr. Res. 160: 113–129, https://doi.org/10.1016/0008-6215(87)80306-3.Suche in Google Scholar
Williams, R.S. (2005). Weathering of wood. In: Rowell, R.M. (Ed.). Handbook of wood chemistry and wood composites. CRC Press, Boca Raton, pp. 139–185.Suche in Google Scholar
Yamauchi, S., Sudiyani, Y., Imamura, Y., and Doi, S. (2004). Depth profiling of weathered tropical wood using Fourier transform infrared photoacoustic spectroscopy. J. Wood Sci. 50: 433–438, https://doi.org/10.1007/s10086-003-0582-2.Suche in Google Scholar
Yoshinaga, A., Fujita, M., and Saiki, H. (1997). Cellular distribution of guaiacyl and syringyl lignins within an annual ring in oak wood. Mokuzai Gakkaishi 43: 384–390.Suche in Google Scholar
Zhang, Z., Ma, J., Ji, Z., and Xu, F. (2012). Comparison of anatomy and composition distribution between normal and compression wood of Pinus bungeana Zucc. revealed by microscopic imaging techniques. Microsc. Microanal. 18: 1459–1466, https://doi.org/10.1017/s1431927612013451.Suche in Google Scholar
Živković, V., Arnold, M., Radmanović, K., Richter, K., and Turkulin, H. (2014). Spectral sensitivity in the photodegradation of fir wood (Abies alba Mill.) surfaces: colour changes in natural weathering. Wood Sci. Technol. 48: 239–252.10.1007/s00226-013-0601-4Suche in Google Scholar
© 2021 Toru Kanbayashi et al., published by De Gruyter, Berlin/Boston
This work is licensed under the Creative Commons Attribution 4.0 International License.
Artikel in diesem Heft
- Frontmatter
- Original articles
- Ultrasound to estimate the physical-mechanical properties of tropical wood species grown in an agroforestry system
- Natural durability and improved resistance of 20 Amazonian wood species after 30 years in ground contact
- Cellular-level chemical changes in Japanese beech (Fagus crenata Blume) during artificial weathering
- Evaluation of water related properties of birch wood products modified with different molecular weight phenol-formaldehyde oligomers
- Superhydrophobic wood surface fabricated by Cu2O nano-particles and stearic acid: its acid/alkali and wear resistance
- Dynamic strength properties and structural integrity of wood modified with cyclic N-methylol and N-methyl compounds
- Indoor storage time affects the quality and quantity of volatile monoterpenes emitted from softwood timber
- The impact of acid hydrolysis conditions on carbohydrate determination in lignocellulosic materials: a case study with Eucalyptus globulus bark
- Improved chemical pulping and saccharification of a natural mulberry mutant deficient in cinnamyl alcohol dehydrogenase