Facile preparation of CeO2 microspheres with high surface area by ultrasonic spray pyrolysis
-
Shou-Feng Xue
 ,
Xue Bian
,
Xue Bian

Abstract
CeCl3 solution was used as a precursor to prepare CeO2 microspheres by ultrasonic spray pyrolysis (USP). This is a green process that allows the transformation from CeCl3 to CeO2 without consuming any precipitant. The prepared material was investigated through various analysis technologies, such as X-ray diffraction (XRD), field emission scanning electron microscopy (FESEM), transmission electron microscopy (TEM), high resolution TEM (HRTEM), energy dispersive X-ray spectroscopy (EDS), N2 adsorption-desorption and X-ray photoelectron spectroscopy (XPS). The prepared sample was confirmed as high purity CeO2 microspheres, and two different microstructures were observed. The microsphere surface area was 86.5 m2/g according to the Brunauer-Emmett-Teller method. The microsphere diameter ranged from 0.09 μm to 3.86 μm and the microsphere surface was covered by numerous nanoparticles. The observed nanoparticles ranged in size from 19 nm to 200 nm as determined from FESEM and HRTEM images. The concentrations of Ce4+, Ce3+, residual chloride and oxygen vacancy in CeO2 were studied by relative sensitivity factors based on the XPS results. Finally, the data suggested the possible formation mechanism of the CeO2 microsphere structure.
1 Introduction
The preparation of CeO2 has received increasing attention due to its unique physical and chemical properties with promising application in the fields of catalysis, solid oxide fuel cells, oxygen storage and solar cells [1], [2], [3], [4], [5]. In the rare earth metallurgy industry, the preparation of CeO2 is performed using a procedure of precipitation and roasting. CeCl3 solution and oxalate are used for the preparation of oxalate cerium, and then the obtained oxalate cerium is roasted to allow decomposition to CeO2 [6], [7]. The drawbacks of this method are the resulting serious environment problems of water pollution from the precipitation stage caused by the discharging of industry sewage with high pH value and metalions, and air pollution during the roasting of oxalate cerium because of the emission of large amounts of carbon dioxide. To address these problems, green metallurgy approaches for rare earths metallurgy have been proposed [8], [9], [10], [11]. Spray pyrolysis was developed as an effective process for the synthesis of microsphere materials, in a simple, economical, continuous process that provides uniform chemical composition and is environment friendly [12], [13], [14], [15], [16], [17]. Several cerium salts have been applied as raw materials for the preparation of CeO2 nanomaterials by ultrasonic spray pyrolysis (USP). Different morphologies of CeO2 nanopowder can be prepared by selecting raw materials of different solubility, for instance, Ce(NO3)3 and (NH4)2Ce(NO3)6 [12], [13]. Controllable preparation of CeO2 has also investigated broadly [14], [15]. However, some important problems must still be solved: for example, the prices of raw materials, Ce(NO3)3, are too high for industrial scale production, the emission of gas containing large amounts of NOx would cause serious air pollution problems, and the prepared CeO2 has low surface area. Therefore, the developing of clean technology for the synthesis of CeO2 with high surface area remains an important goal.
The goal of this work was to develop a clean technology for the preparation of CeO2 on the industrial scale. Hydrated cerium chloride was used as the raw material for the preparation of CeO2 by USP. The results showed successful preparation of CeO2 with high surface area and uniform morphology at 700°C by USP without discharge of sewage and hazardous gas. The microstructure of the produced CeO2 microspheres was studied by various analysis technologies, allowing discussion of the possible formation mechanism of the particle microstructure.
2 Materials and methods
2.1 Reagents and precursor solution
Cerium chloride heptahydrate (CeCl3·7H2O) with purity of 99.9% was used as the raw material and was supplied by Baogang Rare Earth High Technology Company Limited, Baotou City, Inner Mongolia, China. The distilled water was prepared in lab and was used as the solvent to prepare the precursor solution. The cerium oxide precursor solution was prepared by dissolving 20 g CeCl3·7H2O in 100 ml distilled water in a 500 ml beaker. The solution was vigorously stirred for 10 min until dissolved. The obtained solution was then transferred into the nebulizer and subjected to the USP process for 1 h.
2.2 Apparatus
The schematic diagram of the USP setup is shown in Figure 1. The whole USP system included three units: nebulizer unit, pyrolysis unit and collector unit. The nebulizer unit was composed of a carrier gas supplier and nebulizer. The carrier gas was supplied by an air compressor at an air pressure of 3×10⁵ Pa and a volume flow rate of 15 l/min; the nebulizer worked at ~1.7 MHz. The pyrolysis unit was a tube furnace equipped with a high purity quartz tube and the furnace temperature was precisely controlled by a program temperature controller. A bag type dust collector was used to collect the prepared powder product.

Schematic diagram of the ultrasonic spray pyrolysis of CeCl3 solution at 700°C.
(1) Air compressor. (2) Nebulizer. (3) Quartz tube. (4) Tube furnace. (5) Bag-type dust collector. (6) Wide neck bottle. (7) Vacuum pump. (8) Program temperature controller.
2.3 Characterization
The X-ray diffraction (XRD) patterns of the prepared powder were collected by an X-ray diffractometer (PANalytical XPert Pro) equipped with a CuKα radiation (λ=1.5406 Å) source and operated at 40 kV and current 40 mA in a wide range of the Bragg angle 2θ (10°< 2θ<90°) using a scanning rate of 0.02° and counting time of 20 s per each step. The micromorphology of the product was examined by field emission scanning electron microscopy (FESEM) (Hitachi S4800) under an accelerating voltage of 2.0 kV. The microstructure and chemical composition were investigated by transmission electron microscopy (TEM) (FEI Tecnai G2 F20). The TEM images and energy dispersive X-ray spectroscopy (EDS) were obtained at the operating accelerating voltage of 120 kV, and the high resolution TEM (HRTEM) images were taken at a 200 kV accelerating voltage. The element chemical valence state of the sample was identified by X-ray photoelectron spectroscopy (XPS) using a Thermo K-α spectrometer fitted with monochromatic Al-Kα radiation (step size 0.1 eV, pass energy 50 eV, spot size 400μm).
3 Results and discussion
Figure 2 shows the XRD patterns of the as-prepared product by USP of 0.05 mol/l CeCl3 solution at 700°C in air atmosphere. The position of the diffraction peaks located at 2θ values of 28.5°, 33.0°, 47.4°, 56.2°, 59.1°, 69.3°, 76.5°, 78.9° and 88.3° represent the (111), (200), (220), (311), (222), (400), (331), (420) and (422) planes of the fcc structure of ceria with the space group (PDF no: 34-0394). The crystalline size of CeO2 was also determined by using the Scherrer equation D=kλ/βcosθ, where D is the grain size, k is a constant, λ is the wavelength of the X-ray radiation, β is full-width at the half maximum intensity of the peak and θ is the diffraction angle. The mean crystalline size was estimated from the Scherrer equation as about 69 nm. The XRD results indicated that the pure nanocrystalline CeO2 phase was successful prepared by USP of CeCl3 solution.

The X-ray diffraction (XRD) patterns of the prepared CeO2 by ultrasonic spray pyrolysis of CeCl3 solution at 700°C in air atmosphere.
The morphology and microstructure of the product was investigated by FESEM. As shown in Figure 3A, the obtained sample was formed of highly dispersed sphere particles with uniform morphology. The crackle microsphere with diameter of 336 nm is labeled by a white rectangle in Figure 3A, indicating that the prepared CeO2 microspheres may have a hollow structure. As shown in Figure 3B, the high resolution FESEM image of another microsphere demonstrated that the prepared CeO2 microsphere surface was composed of numerous smaller irregular polygon particle units. The size of the irregular polygon particles ranged from 19 nm to ~200 nm, based on the SEM and TEM images (Figures 3B and 5B). Prepared CeO2 microspheres with a smooth surface and ones like golf balls with an uneven surface were also observed. The particle size distribution of prepared CeO2 microspheres was determined by counting more than 600 microspheres in the FESEM images. As shown in Figure 4, more than 90% of the prepared CeO2 microspheres had a diameter <1 μm, with an overall diameter range of 0.09~3.86 μm. The mean diameter dmean=0.64 μm and the median diameter d50=0.59 μm.

The field emission scanning electron microscopy (FESEM) images of the prepared CeO2 by ultrasonic spray pyrolysis of cerium chloride solution at 700°C in air atmosphere.
(A) Magnification of 5000 and (B) magnification of 20,000.

The particle size distribution of the prepared CeO2 by ultrasonic spray pyrolysis of CeCl3 solution at 700°C in air atmosphere.

High resolution transmission electron microscopy (HRTEM) images of CeO2 microspheres prepared at 700°C in air atmosphere.
(A) Morphology image, (B) lattice fringe image, (C) SAED patterns and (D) EDS patterns.
The TEM images of the prepared CeO2 microspheres (Figure 5A) indicated that solid structure microspheres were formed in the spray pyrolysis process, and the solid CeO2 microsphere was composed of many small crystalline particles, as can be seen from FESEM images (Figure 3B). The detailed investigation of the microstructure was performed by HRTEM operation and the zone marked by the red circle (Figure 5A) was selected for additional observation. The HRTEM images (Figure 5B) revealed that the as-prepared CeO2 microspheres were composed of nanometer crystallites about 20 nm in size. The crystalline particle size determined from the measurement of HRTEM images was significantly smaller than that estimated by the Scherrer equation. This difference was possibly caused by the aggregation and irregular shape of the crystalline particles. The fringe space ~0.31 nm, ~0.27 nm and 0.19 nm corresponded to d-spacing of (111), (200) and (220), respectively. The selected area electron diffraction (SAED) patterns shown in Figure 5C, the innermost line (111) corresponding to 0.31 nm lattice spacing was expected for the cubic structure of CeO2. As shown in Figure 5D, the EDS patterns revealed that the product was composed of Ce and O elements, and there were no peaks observed from impurities, indicating high chemical purity of the prepared product.
As shown in Figure 6A, the N2 adsorption and desorption isotherms of the CeO2 microsphere demonstrated typical type IV curves with type-H3 hysteresis loop in the relative pressure range of 0.4~1.0, suggesting the presence of mesopores according to the IUPAC classification [18]. The adsorption curve displayed a steep increase because of the monolayer adsorption at low relative pressure ranged 0–0.03, and the multilayer adsorption was beginning after the complecation of the monolayer adsorption. The prepared CeO2 microsphere showed a specific surface area of 86.5 m2/g, determined by the Brunauer-Emmett-Teller method, which was larger than that reported previously [19]. The pores were primarily in the size range of 2~5.2 nm (Figure 6B), as estimated from desorption branch data by the Barrett-Joyner-Halenda method. The diffusion of pyrolysis tail gas from the inside of the droplet to the outside was responsible for the formation of pores.

Micro-sphere CeO2 with large surface area of 86.5 m2/g and narrow pore distribution has been successful prepared by USP of CeCl3 solution.
(A) N2 adsorption-desorption curves, (B) micro-pore size distribution of CeO2 microspheres.
XPS was performed to investigate the surface chemical composition and the valence state of the elements. Figure 7 shows the XPS spectra of the prepared CeO2 microspheres. A typical full survey scan investigation spectrum of the prepared CeO2 microspheres (Figure 7A) confirmed the presence of Ce, O and Cl. The absence of Cl in the energy dispersive X-ray spectroscopy spectrum indicated that the Cl was randomly absorbed in the prepared CeO2 microsphere. Figure 7B presents the high resolution XPS spectra of Ce3d with eight fitted photoelectron peaks, where the peaks at 916.53 (U), 907.4 (U′) and 900.66 eV (U″) were assigned to the Ce4+ core level of 3d3/2, the peaks at 898.14 (U‴), 888.41 (U′‴) and 882.22 eV (U″‴) were ascribed to the binding energy of Ce4+ 3d5/2, and the two peaks at 901.93 (V) and 884.77 eV (V′) were assigned to Ce3+ 3d3/3 and Ce3+ 3d5/2, respectively [20]. The XPS results of Ce3d indicate that cerium ions with two valance states coexist in the prepared CeO2. In Figure 7C, the high resolution O1s of CeO2 displays three fitted photoelectron peaks: a peak at 529.29 eV that corresponded to the Ce-O band in CeO2, a peak at 531.11 eV that was assigned to the absorbed oxygen, and a peak at 532.35 eV that was assigned to the Ce-O band in Ce2O3 [21]. Figure 7D shows the Cl2p core levels spectra for the prepared CeO2 powder. Two peaks at 198.24 eV and 199.73 eV were observed; the first can be attributed to absorbed HCl and the latter can be ascribed to lattice Cl in CeCl3 due to the reaction of the absorbed HCl with the CeO2 microspheres.

X-ray photoelectron spectroscopy (XPS) spectrum of CeO2 microsphere prepared at 700°C.
(A) Survey spectrum, (B) Ce3d spectrum, (C) O1s spectrum and (D) Cl2p spectrum.
Quantity analysis of Ce4+, Ce3+, Cl and oxygen vacancy was carried out using relative sensitive factors (RSF) based on the XPS results. The concentration of elements (ion or atom) i in solid materials can be calculated by Eq. (1) according to the RSF principle, where Ai is the area of the photoelectron peak and Si is the element sensitive factor [22]. Therefore, the relative concentration of [Ce4+], [Ce3+] and [Cl] could be calculated by Eqs. (2–4), respectively. The results show that [Ce4+] is 82.94%, [Ce3+] is 17.06% and [Cl] is 3.24% (SCe=7.399, SCl=0.770, SO=0.711). Ce4+ was present as both CeO2 and Ce3+ in Ce2O3 in the prepared cerium oxide microspheres. Thus, the theoretical oxygen concentration of the prepared cerium oxide could be calculated by Eq. (5) and the result was 191.47%. The oxygen concentration could also be estimated from the XPS peaks area of O1s using Eq. (6) without considering the absorbed oxygen. The calculated results show that the oxygen concentration was 179.13%, which was 12.34% less than the theoretical value, suggesting 12.34% oxygen vacancy in the prepared cerium oxide:
The morphology of the prepared CeO2 microspheres was mainly dependent on the shape of the spherical micro droplets [16]. To understand the formation mechanism of the microstructure of the prepared CeO2 microspheres, the theory of solubility of solute has been proposed [12], [13], [14], [15], [16], [17]. The high solubility of solute would produce a solid particle by volume precipitation and a low solubility of solute would lead to the formation of a hollow structure due to partial precipitation. Therefore, controlled morphology could be achieved in the preparation of microsphere materials by choosing different kinds of raw materials of different solubility. The microstructure formation mechanism of CeO2 microspheres prepared by USP of CeCl3 solution was not previously reported. Moreover, related reported mechanisms [12], [13], [14], [15], [16], [17] cannot explain well the apparent coexistence of the solid and hollow structure microspheres in the process described here.
As described by Eqs. (8) and (9), the pyrolysis of a CeCl3 solution droplet experienced the evaporation of water at low temperature and the oxidation of CeCl3 microsphere particles at elevated temperature. The formation mechanism of particle microstructure was closely related to the amount of time the droplet spent in the low temperature zone of the pyrolysis furnace. Because the ideal laminar carrier gas could not be simply supplied in the present experiment setup, use of a more turbulent carrier gas will allow the droplets to pass through the pyrolysis furnace with different trajectories. These different trajectories indicated that the stay time of the droplet was variable in the furnace. The schematic illustration of the microstructure formation mechanism is shown in Figure 8. A shorter stay time of the droplet at low temperature zone would result in the formation of a hollow structure, and a longer time in the low temperature zone would lead to the formation of a solid structure:
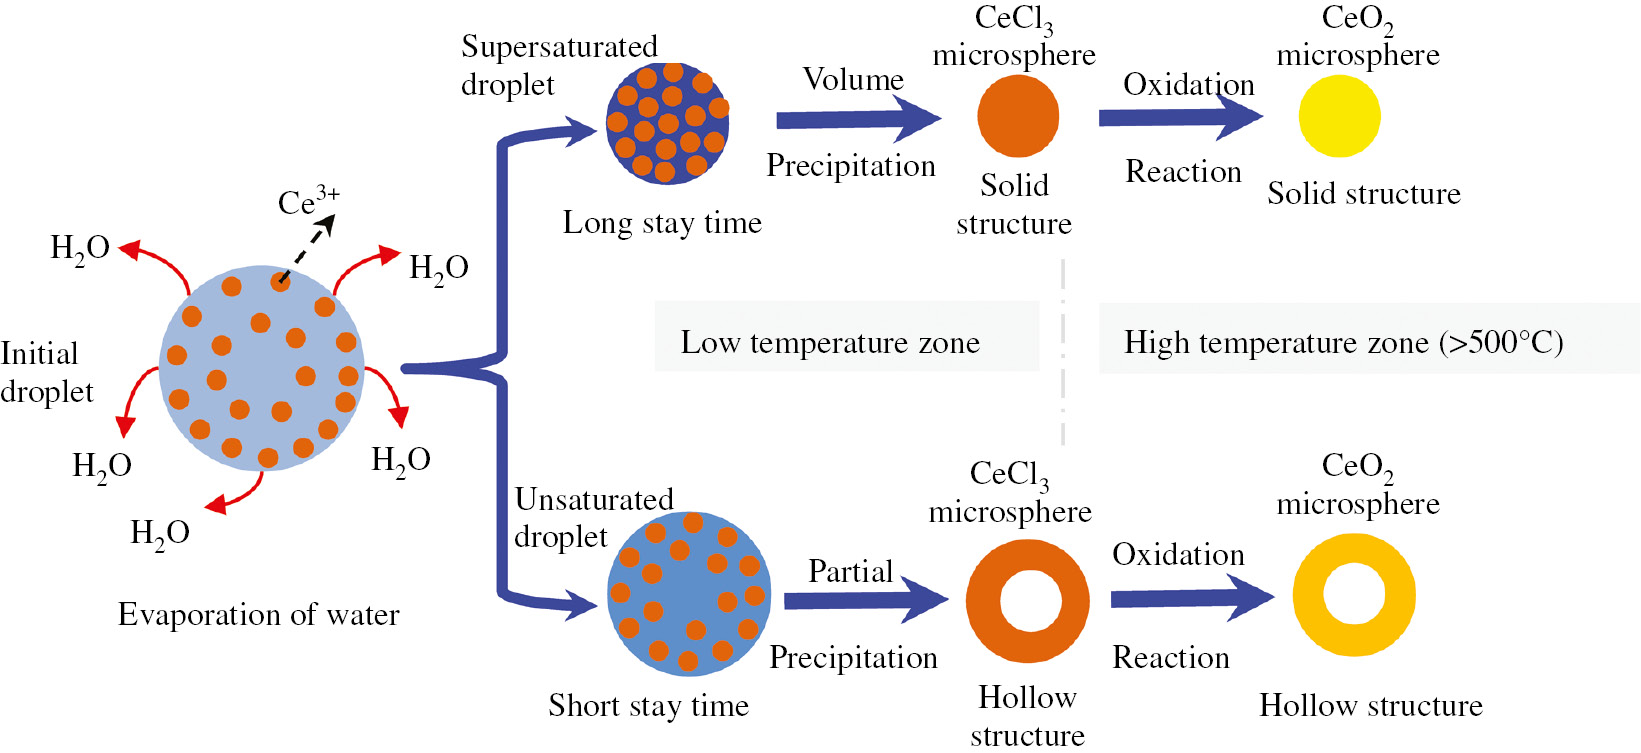
Schematic of the microstructure formation mechanism of CeO2 microsphere prepared by ultrasonic spray pyrolysis of CeCl3 solution in air atmosphere.
First, the CeCl3 solution droplet was generated by the nebulizer and was brought into the high temperature furnace by a carrier gas. As demonstrated in Figure 1, the temperature of the inlet of the furnace was about 80°C~100°C. Considering the situation of a long stay time of droplets at the low temperature zone, the first change was the evaporation of solvent from the droplet. As the water evaporated from the CeCl3 solution droplet, the diameter of the droplet decreased dramatically and the concentration of solute in the droplet increased sharply. After the supersaturated droplet formed in the low temperature zone, the volume precipitation of solute from the droplet took place and the solid CeCl3 microsphere formed [17]. If a droplet is in the low temperature zone for a short time, the droplet cannot reach the state of supersaturation, and the precipitation of solute (CeCl3) would result in the formation of hollow structure due to the partial precipitation.
After the separation of solute from the droplet, the formed CeCl3 microsphere particle was softened. The collision between the molted microspheres resulted in the formation of a CeO2 microsphere-like golf ball with uneven surface. Recrystallization of the softened CeCl3 microsphere particle at low temperature would lead to covering of the microsphere surface by nanometer crystalline particles. The formed micropores in the CeO2 microsphere described by Figure 6B could be well explained by the diffusion of evolved gas from the interior of the microsphere particle to the outside.
4 Conclusions
In summary, this is the first report of the synthesis of CeO2 microspheres with high surface area by USP. The microstructure of the synthesized samples was characterized by XRD, FEFSEM, HRTEM, N2 absorption and desorption and XPS. The particle size ranged from 0.09 μm to 3.86 μm, the micropores on the microsphere surface ranged from 2 nm to 5.2 nm, and the particle surface area was 86.5 m2/g. The concentrations of Ce4+, Ce3+ and oxygen vacancy on the surface of the prepared CeO2 microspheres were characterized. Both hollow structure and solid structure CeO2 microspheres were observed. The microstructure of the CeO2 microspheres was greatly dependent on the time the droplets were maintained in the low temperature zone in the furnace.
Acknowledgments
This work was supported by the National Natural Science Foundation of China (grant no. 51274060), National Sci-Tech Support Plan (no. 2012BAE01B02) and Basic Scientific Research Business Expenses (no. N150204019).
References
[1] Sun C, Li H, Chen L. J. Phys. Chem. Solids 2007, 68, 1785–1790.10.1016/j.jpcs.2007.05.005Search in Google Scholar
[2] Chunwei S, Wenyuan W, Xue B, Mingyuan P, Shanlin Z, Ping C. J. Rare Earths 2016, 34, 597–603.10.1016/S1002-0721(16)60067-4Search in Google Scholar
[3] Chueh WC, Hao Y, Jung W, Haile SM. Nat. Mater. 2012, 11, 155–161.10.1038/nmat3184Search in Google Scholar
[4] Imagawa H, Suda A, Yamamura K, Sun S. J. Phys. Chem. C 2011, 115, 1740–1745.10.1021/jp109878jSearch in Google Scholar
[5] Corma A, Atienzar P, García H, Chane-Ching JY. Nat. Mater. 2004, 3, 394–397.10.1038/nmat1129Search in Google Scholar
[6] Wu WY. Rare Earth Metallurgy, Chemical Industry Press: Beijing, 2005, pp 173–175.Search in Google Scholar
[7] Liu Z, Li M, Hu Y, Wang M, Shi Z. J. Rare Earths 2008, 26, 158–162.10.1016/S1002-0721(08)60057-5Search in Google Scholar
[8] Huang X, Li J, Long Z, Zhang Y, Xue X, Zhu Z. J. Rare Earths 2008, 26, 410–413.10.1016/S1002-0721(08)60107-6Search in Google Scholar
[9] Huang XW, Long ZQ, Wang LS, Feng ZY. Rare Met. 2015, 34, 215–222.10.1007/s12598-015-0473-xSearch in Google Scholar
[10] Yin S, Li S, Zhang B, Peng J, Zhang L. Hydrometallurgy 2016, 161, 160–165.10.1016/j.hydromet.2016.01.016Search in Google Scholar
[11] Yin S, Zhang L, Peng J, Li S, Ju S, Zhang L. Chem. Eng. Process: Process Intens. 2015, 91, 1–6.10.1016/j.cep.2015.03.003Search in Google Scholar
[12] Shih S-J, Wu Y-Y, Chen C-Y, Yu C-Y. J. Nanopart. Res. 2012, 14, 879.10.1007/s11051-012-0879-4Search in Google Scholar
[13] Xu H, Gao L, Gu H, Guo J, Yan D. J. Am. Ceram. Soc. 2002, 85, 139–144.10.1111/j.1151-2916.2002.tb00055.xSearch in Google Scholar
[14] Goulart C, Djurado E. J. Eur. Ceram. Soc. 2013, 33, 769–778.10.1016/j.jeurceramsoc.2012.09.029Search in Google Scholar
[15] Eslamian M, Ashgriz N. Powder Technol. 2006, 167, 149–159.10.1016/j.powtec.2006.06.016Search in Google Scholar
[16] Gurav A, Kodas T, Pluym T, Xiong Y. Aerosol Sci. Technol. 1993, 19, 411–452.10.1080/02786829308959650Search in Google Scholar
[17] Shih S-J, Wu Y-Y, Chen C-Y, Yu C-Y. Procedia Eng. 2012, 36, 186–194.10.1016/j.proeng.2012.03.029Search in Google Scholar
[18] Wang D, Shan Z, Na R, Huang W, Tian J. J. Power Sources 2017, 337, 11–17.10.1016/j.jpowsour.2016.10.115Search in Google Scholar
[19] Periyat P, Laffir F, Tofail SAM, Magner E. RSC Adv. 2011, 1, 1794.10.1039/c1ra00524cSearch in Google Scholar
[20] Benjaram M. Reddy, Pranjal S, Pankaj B, Yusuke Y, Tetsuhiko K, Martin M, Wolfgang G. J. Phys. Chem. C 2008, 112, 16393–16399.10.1021/jp806131rSearch in Google Scholar
[21] Wang L, Meng F. Mater. Res. Bull. 2013, 48, 3492–3498.10.1016/j.materresbull.2013.05.036Search in Google Scholar
[22] Chastain J, King RC, Moulder J. Handbook of X-ray Photoelectron Spectroscopy: A Reference Book of Standard Spectra for Identification and Interpretation of XPS Data, Physical Electronics: Eden Prairie, MN, 1995.Search in Google Scholar
©2018 Walter de Gruyter GmbH, Berlin/Boston
This article is distributed under the terms of the Creative Commons Attribution Non-Commercial License, which permits unrestricted non-commercial use, distribution, and reproduction in any medium, provided the original work is properly cited.
Articles in the same Issue
- Frontmatter
- In this issue
- Original articles
- Biomimetic synthesis of two different types of renewable cellulosic nanomaterials for scaffolding in tissue engineering
- Choline taurinate: a new biocompatible amino-functionalized ionic liquid as basic catalyst and extraction solvent
- Eco-friendly synthesis, characterization, and drug-likeness properties of new uracils and their biological evaluation
- Fast separation of Cu2+ and Ni2+ in sulfate solution by Lix984N extraction using a microchannel chip
- Autoclave-assisted green synthesis of silver nanoparticles using A. fumigatus mycelia extract and the evaluation of their physico-chemical properties and antibacterial activity
- Homogeneous precipitation synthesis of BaCO3 powders with a needle-like morphology
- Eco-friendly microwave-enhanced green synthesis of silver nanoparticles using Aloe vera leaf extract and their physico-chemical and antibacterial studies
- Facile preparation of CeO2 microspheres with high surface area by ultrasonic spray pyrolysis
- Characterization and low-cost, green synthesis of Zn2+ doped MgO nanoparticles
- Denitrification of water using ZnO/Cu as the photocatalyst
- Hydrodeoxygenation of fatty acid methyl ester in gas oil blend–NiMoS/alumina catalyst
- High-solids semi-continuous anaerobic digestion of corn silage in bag-type digester