Utilization of walnut shell as a feedstock for preparing high surface area activated carbon by microwave induced activation: effect of activation agents
-
Hongying Xia
Hongying Xia is an Associate Professor in Kunming University of Science and Technology, and mainly engages in microwave heating in the application of metallurgy, chemical engineering, and materials science.
Song Cheng is a Master’s Degree Candidate in Kunming University of Science and Technology, and mainly engages in microwave heating in the application of chemical engineering, and materials science.
Libo Zhang is a PhD supervisor in Kunming University of Science and Technology, and mainly engages in microwave heating in the application of metallurgy, chemical engineering, and materials science.
 und
Jinhui Peng
und
Jinhui Peng
Jinhui Pengis is a PhD supervisor in Kunming University of Science and Technology, and mainly engages in microwave heating in the application of metallurgy, chemical engineering, and materials science. He has received many awards, among which are the State Technological Invention Award, and the Natural Science Award of Kunming province.

Abstract
The present work attempts to convert walnut shell into a high surface area activated carbon by microwave heating and chemical activation. Different activation agents such as KOH, NaOH, K2CO3 and Na2CO3 were utilized to identify a suitable activation agent. The result indicated that KOH was the most suitable activation agent among those agents, with the highest porosity and surface area of activated carbon. The effect of KOH/C mass ratio on the pore structure characteristics of the activated carbon was investigated. An optimal KOH/C mass ratio of 4 was identified, beyond which the surface area as well as the pore volume were found to decrease. The surface area and the pore volume were estimated to be 3276 m2/g and 1.952 ml/g, respectively, meanwhile the microporous proportion was 77.51% under the optimized KOH/C mass ratio. The activated carbon was further characterized using Fourier transform infrared spectroscopy (FTIR) and scanning electron microscopy (SEM). The findings strongly support that the activation agent has a great effect on the preparation of activated carbon from walnut shell.
1. Introduction
Walnut shell is grown in large quantities and is a renewable source of biomass. According to statistics, more than 1 million tons of walnut shells are being produced in China annually [1]. Activated carbon can be produced from different types of materials like lignite, peat, coke, wood, sawdust and coconut shell and so on [2–5]. The properties of the activated carbon depend on the type of precursor as well as the activation methods [6]. In common opinion, advantages of activated carbon are low cost, hydrophobicity and flexibility in terms of porous texture and surface properties [7]. Activated carbon is an important material with well-developed pore structure and good mechanical characteristics, which is mainly used in environmental applications, such as water treatment, environment protection, gas filters, catalyst and catalyst support, etc. [8–12].
In principle, the methods for preparing an activated carbon can be divided into physical and chemical activation [13]. Physical activation is realized in two stages of carbonization and activation; the activation of char is performed at a high temperature (usually above 1073 K) with steam, carbon dioxide or their mixture [14–17]. Chemical activation is usually realized in one stage. The precursor is impregnated with chemical agents like KOH [18, 19], K2CO3 [20, 21], ZnCl2 [22], H3PO4 [23, 24] and activated at comparatively lower temperatures than the physical activation. Chemical activation has several advantages compared to physical activation, such as higher yields and well-controlled porosity.
The conventional heating method is surface heating, which does not ensure a uniform temperature, as the heat transfers through conduction and convection. Microwave heating is volumetric and the heat is generated from inside the material through dipole rotations and ionic conduction. Microwave heating has been proved beyond doubt to possess qualities such as fast heating, is energy efficient, easy to control, has small thermal inertia and selective heating. Application of microwave heating is increasingly being adopted for processes such as biomass conversion, activated carbon preparation and so on [25–28].
The main purpose of this work was to find the suitable activation agent for preparing walnut shell based activated carbon from KOH, NaOH, K2CO3 and Na2CO3 by microwave heating. The resultant product was characterized using the nitrogen adsorption isotherm, Fourier transform infrared spectroscopy (FTIR) and scanning electron microscopy (SEM) analysis.
2. Materials and methods
2.1 Materials
Walnut shell was obtained from Yangbi in Yunnan province of China. The starting material was manually chosen, grounded to 5–7 mm, cleaned with distilled water, dried at 110°C for 48 h and finally stored in sealed containers for next experiments. The proximate analysis of the walnut shell is shown in Table 1. The activation agent such as KOH, K2CO3, NaOH, Na2CO3 with analytical grade (Tianjin Chemicals Reagent, Tianjin, China).
Proximate analysis result of walnut shell.
| Sample | Moisture (wt.%) | Volatile matter (wt.%) | Fixed carbon (wt.%) | Ash (wt.%) |
|---|---|---|---|---|
| Walnut shells | 10.91 | 70.71 | 17.65 | 0.73 |
2.2 Carbonization of walnut shell
The carbonization of walnut shell was carried out by loading 1000 g into a high temperature conventional resistance furnace, and heating to the carbonization temperature of 600°C at a heating rate of 10°C/min and held for 2 h under N2 atmosphere (100 cm3/min). Then, the carbonized materials were cooled to room temperature with N2 atmosphere (100 cm3/min). Last, the resultant chars were crushed to particles with sizes of 600–1000 μm.
2.3 Preparation of activated carbon
The activation experiments were carried out in a self-made microwave tubular furnace with a muti-mode continuous controllable power. The microwave frequency was 2.45 GHz, while the output power could be set to a maximum of 1000 W.
Firstly, a certain weight of activation agent and char were mixed completely according to a fixed mass ratio. Secondly, these were placed in a ceramic crucible, and were heated for 15 min at the microwave power of 700 W under nitrogen atmosphere (300 cm3/min). Thirdly, the activated samples were rapidly transferred to the beaker loaded with distilled water, followed by washing with 1:1 HCl (by volume) to eliminate the residual alkali. Then, the samples were rinsed with hot distilled water until the pH was about 7. Finally, the cleaned samples were dried at 110°C for 12 h. The activated samples with high temperature were rapidly transferred to the distilled water for the gasification reaction char to produce more holes.
2.4 Characterization of activated carbon
The iodine adsorption number is an important parameter and widely used to characterize microporous material; it was calculated using the standard testing methods of the People’s Republic of China (GB/T12496.8-1999) [29] for activated carbon. The yield was defined as the weight ratio of activated carbon to char utilized for activation. The porosity of the resultant sample was characterized with N2 adsorption at 77 K using an automatic adsorption apparatus (Autosorb-1-C, Quantachrome). The surface area was calculated by the Brunauer–Emmett–Teller (BET) method. The total pore volume was determined at a relative pressure (P/P0) of 0.98. The t-plot method was applied to calculate the micropore volume and external surface area. In addition, the pore size distribution was determined by non-local density functional theory (NLDFT) method. FTIR (Nicolet 8700, Thermo Nicolet Co., USA) was applied to identify the chemical function groups of activated carbon. The microstructure was analyzed by SEM (Philips XL30ESEM-TMP).
3. Results and discussion
3.1 Effect of activation agent
3.1.1 The iodine number and yield of activated carbon
Activated carbons were prepared at a microwave power of 700 W and heating time of 15 min, with an activation agent/char mass ratio of 2 using KOH, NaOH, K2CO3 and Na2CO3. The effect of activation agent on the iodine number and yield are shown in Figures 1 and 2, respectively.
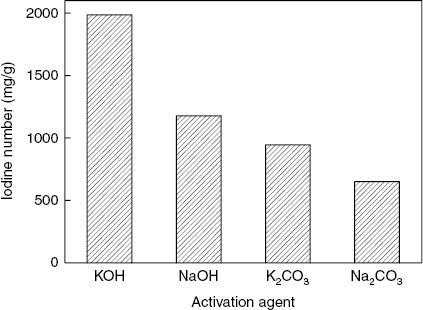
Effect of activation agent on the iodine number of activated carbon.
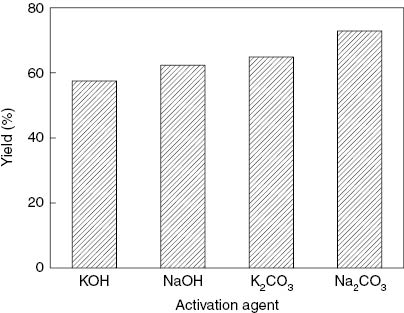
Effect of activation agent on the yield of activated carbon.
Figure 1 shows that the activation agent has a significant influence on the iodine number of activated carbon. The iodine number of activated carbon prepared by a different activation agent was of the order of KOH>NaOH>K2CO3>Na2CO3. The iodine number of activated carbon prepared by KOH activation was the highest. The iodine number was equal substantially with NaOH and K2CO3 activation, but the iodine number was the lowest obtained from Na2CO3 activation. Figure 2 shows that the yield of activated carbon doesn’t increase with the increase in iodine number for different activation agents. An increase in the porosity of the carbon made the yield of carbon reduction in turn.
During KOH and K2CO3 activation, the reactions are complicated, but generally the reactions may be as follows; in addition, there are similar reactions during NaOH and Na2CO3 activation [18, 30, 31]:
Concurrently, alkaline hydroxide activation involves the redox reduction and carbon oxidation to generate porosity. Gases such as CO2 and CO are generated by these chemical reactions, resulting in the formation of ultramicropores in mesopore walls, which can also contribute to increasing surface area and pore volume. The main difference in behavior between KOH, K2CO3 and NaOH, Na2CO3 can be explained by the different intercalation ability of K and Na with the structural order and organization of the pristine material [18].
3.1.2 Pore structure of activated carbon
The N2 adsorption isotherms of activated carbon using different activation agents are shown in Figure 3. Figure 3 shows that the isotherms of activated carbon with KOH, NaOH and K2CO3 activation can be categorized to be a type I isotherm according to the International Union of Pure and Applied Chemistry (IUPAC) classification [32]. When the relative pressure (P/P0) was below 0.1, N2 adsorption increased quickly for the activated carbon. More than 70% of nitrogen was adsorbed within the region of very low relative pressures P/P0<0.1, indicating the microporous character [33]. This type of isotherm was usually exhibited by microporous solids that include a well-developed mesopore structure. The isotherm of activated carbon obtained from Na2CO3 activation belongs to the type II isotherm. N2 adsorption increases has a similar trend at low relative pressure, and the adsorption capacity reached 53.2% of saturation adsorption capacity at the relative pressure of 0.1, indicating more mesoporous than other activation agents. From the micropore and mesopore volumes listed in Table 2, it is inferred that the mesopores account of the activated carbon obtained by Na2CO3 activation was 58% more than other activated carbons in total pore volume.
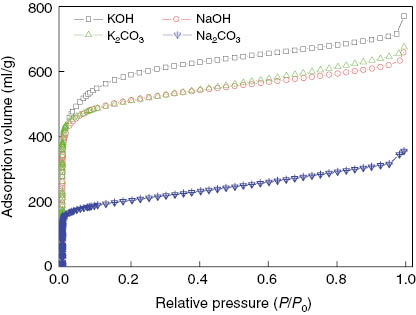
N2 adsorption isotherm of activated carbon with different activation agent.
Pore structure characteristics of activated carbon with different activation agent.
| Activation agent | SBET (m2/g) | Vtot (ml/g) | D (Å) | Vmic (ml/g) | Vmes (ml/g) | Smic (m2/g) | SExternal (m2/g) | Vmic/Vtot (%) |
|---|---|---|---|---|---|---|---|---|
| KOH | 1835 | 1.1100 | 24.2 | 0.8122 | 0.2978 | 1560 | 274.7 | 73.17 |
| NaOH | 1558 | 0.9831 | 24.77 | 0.6980 | 0.2851 | 1345 | 242.8 | 71.00 |
| K2CO3 | 1579 | 1.0170 | 25.76 | 0.6846 | 0.3324 | 1304 | 274.7 | 67.32 |
| Na2CO3 | 659.6 | 0.5353 | 32.46 | 0.2227 | 0.3126 | 235.7 | 423.9 | 41.60 |
Table 2 shows the results of the adsorption isotherms in terms of surface area, micropore volume and total pore volume. The highest surface area was1835 m2/g, corresponding to the KOH activation, with much higher pore volume compared to the other activation agents. In addition, the proportion of micropore volume to the total pore volume was much higher than with the other activation agents. The Na2CO3 activation resulted in a very low surface area of 659.6 m2/g. Based on this fact, KOH performed much better than other activation agents in terms of its ability to produce high surface area carbon. The average diameter of activated carbon doesn’t increase with the increase in Vmic/Vtot of activated carbon with different agents.
3.1.3 Pore size distribution of activated carbon
According to IUPAC classification [32], pores are divided into micropores (<20 Å), mesopores (20–500 Å) and macropores (>500 Å). Pore size distributions of activated carbon from different activation agents are presented in Figure 4. A distinct variation in the pore size distributions could be observed. The contribution of KOH is distinctly higher throughout, but for the ultramicropore range, both K2CO3 and NaOH generate a significantly higher proportion of ultramicropores.
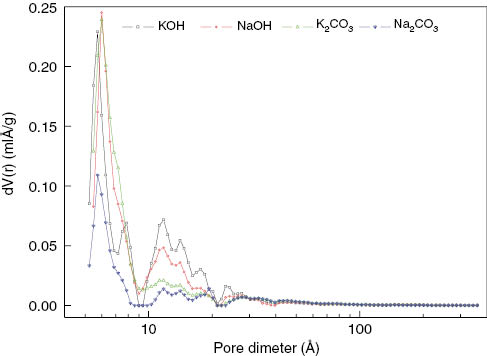
Pore size distribution of activated carbon with different activation agent.
3.2 Effect of KOH/C ratio
3.2.1 The yield of activated carbon
Figure 5 shows the effect of KOH/C mass ratio on the yield of activated carbon. We found that the KOH/C mass ratio has a great effect on the yield of activated carbon, and the yield of activated carbon decreased sharply with increase in KOH/C mass ratio from 1 to 5. With increasing the KOH/C mass ratio, the activation reaction would be strengthened and many more pores would be formed. When the KOH/C mass ratio reached 4, the carbon on the active site has almost completely reacted with KOH and has many pores. The pore would be widened and burnt off when the KOH/C mass ratio over 4.
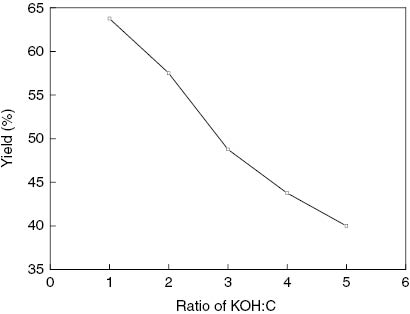
Effect of KOH/C mass ratio on the yield of activated carbon.
3.2.2 Pore structure of activated carbon
The nitrogen adsorption isotherms of activated carbon derived from walnut shell char with different KOH/C mass ratios are shown in Figure 6. The N2 adsorption isotherms of activated carbon belong to the type I. It can be observed that the adsorption volume increases sharply at low relative pressure, which indicates the process of filling the micropores. When the relative pressure reached 0.1, the adsorption amount was about 70% of saturation adsorption, indicating the microporous character. As the relative pressure continued to increase, adsorption increased slowly and the isotherm can be seen as an upwardly convex shape which indicated that adsorption was transitioned from monolayer to multi-molecular layer. The adsorption capacity continued to increase and showed a tailing at a relative pressure close to 1.
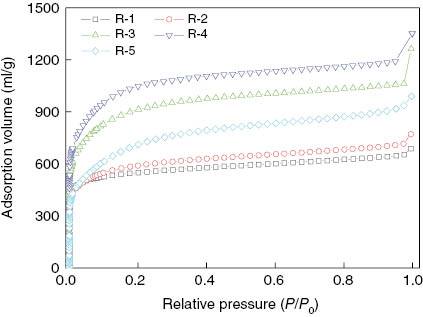
N2 adsorption isotherm of activated carbon with different KOH/C ratio.
Table 3 summarizes the pore characteristics which showed an increased surface area and total pore volume with increase in the KOH/C mass ratio. An optimal mixture ratio was observed at the KOH/C mass ratio of 4, at which the surface area was 3276 m2/g. A drop in surface area as well as pore volume was observed with KOH/C mass ratio beyond 4. The optimal mixture ratio in terms of pore volume and surface area can be attributed to the pore merger phenomena at a higher KOH/C mass ratio.
Pore structure characteristics of activated carbon with different KOH/C mass ratio.
| KOH/C mass ratio | SBET (m2/g) | Vtot (ml/g) | D (Å) | Vmic (ml/g) | Vmes (ml/g) | Smic (m2/g) | SExternal (m2/g) | Vmic/Vtot (%) |
|---|---|---|---|---|---|---|---|---|
| 1 | 1669 | 1.013 | 24.3 | 0.734 | 0.279 | 1423 | 246 | 72.46 |
| 2 | 1835 | 1.110 | 24.2 | 0.812 | 0.298 | 1560 | 275 | 73.17 |
| 3 | 2880 | 1.648 | 22.9 | 1.347 | 0.301 | 2590 | 290 | 81.74 |
| 4 | 3276 | 1.952 | 24.0 | 1.513 | 0.439 | 2939 | 337 | 77.51 |
| 5 | 2357 | 1.453 | 24.7 | 0.901 | 0.552 | 1792 | 565 | 62.00 |
Table 4 compares the surface area of various activated carbons prepared using different activation agents as reported in literature. Although it was a small sample from the large number of activated carbons reported in literature, it clearly proved the high surface area of the activated carbon prepared in this work as compared with the literature. A surface as high as 3276 m2/g was very rarely reported in literature which could form the basis for additional work on exploring the combination of walnut shell with the KOH activation agent.
Comparison surface area of activated carbon with different activation agent.
| Activating agent | Precursor | Heating method | SBET (m2/g) | References |
|---|---|---|---|---|
| KOH | Walnut shell | Microwave heating | 3276 | Present study |
| Coconut husk | Microwave heating | 1356 | [18] | |
| Isotropic petroleum pitch | Conventional heating | 2992 | [19] | |
| K2CO3 | Sisal waste | Conventional heating | 1038 | [20] |
| Edible fungi residue | Microwave heating | 684 | [21] | |
| ZnCl2 | Coffee husk | Conventional heating | 1522 | [22] |
| H3PO4 | Acacia mangium wood | Conventional heating | 1040 | [23] |
| Olive-waste cake | Conventional heating | 1020 | [24] |
3.2.3 Pore size distribution of activated carbon
Pore size distributions of activated carbon derived from walnut shell with different KOH/C mass ratios are presented in Figure 7. The pore size distributions of activated carbon were concentrated in the micropore field (5–7 Å, 12–18 Å). At the range of 10–20 Å, the pore size distributions of activated carbon increased with the KOH/C mass ratio increasing, and reached a maximum value at the KOH/C mass ratio of 4, and then decreased with increase in KOH/C mass ratio. The mesopore distributions around 20–40 Å was abundant, especially for a KOH/C mass ratio of 4. Pore volume becomes very small when pore size >40 Å. The KOH/C mass ratio of 1 seems to generate a significantly higher proportion of ultramicropores as compared with the other KOH/C mass ratio.
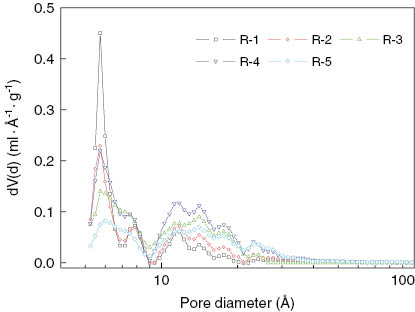
Pore size distribution of activated carbon with different KOH/C mass ratio.
3.3 FTIR analysis
It can be observed from Figure 8 that, irrespective of KOH/C mass ratio utilized the overall shapes of the spectra look similar, with the major peaks observed at 3440 cm-1, 2925 cm-1, 2860 cm-1, 1710 cm-1, 1630 cm-1, 1430 cm-1, 1360 cm-1, 1215 cm-1, 1080 cm-1 and 920–790 cm-1. An increase in width of the peak was observed with increase in KOH/C mass ratio. The wide peak located at 3340 cm-1 was assigned to the O-H stretching vibration. The band at around 2926 cm-1 can be assigned to the C-H symmetric and asymmetric vibration mode of methyl and methylene groups. The band at 1710 cm-1 indicated that there may exist a C=O functional group and the band at around 1080 cm-1 can be assigned to C=C symmetrical stretching of pyrone and the C=O of carboxylic groups. The intensity of the peak was relatively weak in the range 1200 cm-1 to 1600 cm-1, which could be attributed to lower oxygen content. The adsorption peak at 920–790 cm-1 was weakened obviously, which means C-H outer surface rocking vibration absorption was weak and carbon network structure was large.
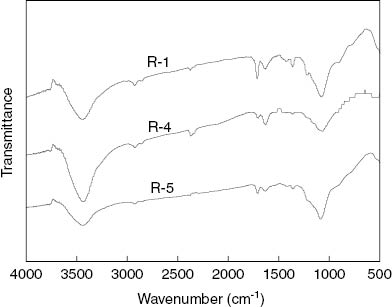
Fourier transform infrared spectroscopy (FTIR) spectra of activated carbon from walnut shell with different KOH/C ratio.
3.4 SEM analysis
Figure 9 shows the SEM image of the high surface area activated carbon derived at a KOH/C mass ratio of 4 from walnut shell char. The surface of activated carbon was smooth and had abundant pores. The pores on the surface could be macropores, which leads to branching micropores in the interiors of the activated carbon. The macropores lead the way to the tributaries which were micropores.
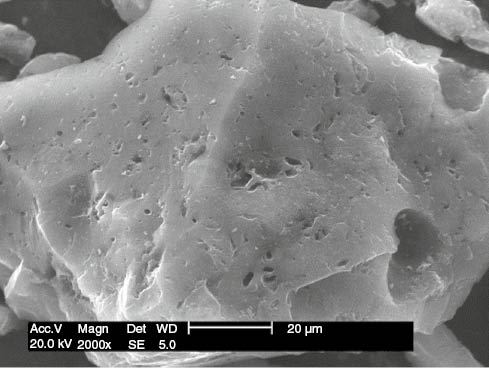
Scanning electron microscopy (SEM) image of activated carbon derived from walnut shell char.
4. Conclusion
Walnut shell, a wasted biomass, was utilized for preparing high surface area activated carbon using microwave heating and exhibited a well-developed pore structure. The results showed that the activation agent had great effects on the preparation of high surface area activated carbon, but KOH is the best activation agent among those activation agents. The effect of KOH/C mass ratio on the yield and pore structures of high surface area activated carbon was investigated and an optimum KOH/C mass ratio of 4 was obtained. The results showed that the highest surface area and total pore volume of activated carbon were 3276 m2/g and 1.952 ml/g, respectively, under the KOH activation and KOH/C mass ratio of 4. The characterization of FTIR illustrated that surface of activated carbon had abundant functional groups. SEM showed that activated carbon has a developed pore structure.
About the authors

Hongying Xia is an Associate Professor in Kunming University of Science and Technology, and mainly engages in microwave heating in the application of metallurgy, chemical engineering, and materials science.

Song Cheng is a Master’s Degree Candidate in Kunming University of Science and Technology, and mainly engages in microwave heating in the application of chemical engineering, and materials science.

Libo Zhang is a PhD supervisor in Kunming University of Science and Technology, and mainly engages in microwave heating in the application of metallurgy, chemical engineering, and materials science.

Jinhui Pengis is a PhD supervisor in Kunming University of Science and Technology, and mainly engages in microwave heating in the application of metallurgy, chemical engineering, and materials science. He has received many awards, among which are the State Technological Invention Award, and the Natural Science Award of Kunming province.
Acknowledgments
The authors would like to express their gratitude to the Specialized Research Fund for the National High Technology Research and Development Plan (no. 2015AA020201, 863 Program), National Natural Science Foundation of China (21567013), Yunnan Applied Basic Research Project (no. 2015FB129) and the Yunnan Provincial Science and Technology Innovation Talents Scheme-Technological Leading Talent (no. 2015FB129) for financial support.
References
[1] Yang J, Qiu K. Chem. Eng. J. 2010, 165, 209–217.10.1016/j.cej.2010.09.019Suche in Google Scholar
[2] Abbas HF, Wan Daud WMA. Int. J. Hydrogen Energy 2009, 34, 6231–6241.10.1016/j.ijhydene.2009.05.143Suche in Google Scholar
[3] Kubota M, Ito T, Watanabe F, Matsuda H. Appl. Therm. Eng. 2011, 31, 1495–1498.10.1016/j.applthermaleng.2011.01.036Suche in Google Scholar
[4] Gratuito MKB, Panyathanmaporn T, Chumnanklang RA, Sirinuntawittaya N, Dutta A. Bioresour. Technol. 2008, 99, 4887–4895.10.1016/j.biortech.2007.09.042Suche in Google Scholar
[5] Wang ZH, Chen Y, Zhou C, Whiddon R, Zhang YW, Zhou JH, Cen KF. Int. J. Hydrogen. Energy 2011, 36, 216–223.10.1016/j.ijhydene.2010.10.058Suche in Google Scholar
[6] Auta M, Hameed BH. Chem. Eng. J. 2011, 171, 502–509.10.1016/j.cej.2011.04.017Suche in Google Scholar
[7] Labus K, Gryglewicz S, Machnikowski J. Fuel 2014, 108, 9–15.10.1016/j.fuel.2013.10.042Suche in Google Scholar
[8] Qiang DM, Wurster DE. J. Colloid. Interface Sci. 2011, 358, 541–546.10.1016/j.jcis.2011.03.050Suche in Google Scholar
[9] Kalderis D, Bethanis S, Paraskeva P, Diamadopoulos E. Bioresour. Technol. 2008, 99, 680–6816.10.1016/j.biortech.2008.01.041Suche in Google Scholar
[10] Arami-Niya A, Wan Daud WMA, Mjalli FS, Abnisa F, Shafeeyan MS. Chem. Eng. Res. Des. 2012, 90, 776–784.10.1016/j.cherd.2011.10.001Suche in Google Scholar
[11] Su W, Zhou L, Zhou YP. Carbon 2003, 41, 861–863.10.1016/S0008-6223(03)00003-4Suche in Google Scholar
[12] Carratalá-Abril J, Lillo-Ródenas MA, Linares-Solano A, Cazorla-Amorós D. Chem. Eng. Sci. 2010, 65, 2190–2198.10.1016/j.ces.2009.12.017Suche in Google Scholar
[13] Li W, Yang KB, Peng JH, Zhang LB, Guo SH, Xia HY. Ind. Crop. Prod. 2008, 28, 190–198.10.1016/j.indcrop.2008.02.012Suche in Google Scholar
[14] Minoda A, Oshima S, Iki H, Akjba E. J. Alloy Compd. 2013, 580, 5301–5304.10.1016/j.jallcom.2013.02.085Suche in Google Scholar
[15] Belhachemi M, Rios RVRA, Addoun F, Silvestre-Albero J, Sepúlveda-Escribano A, Rodríguez-Reinoso F. J. Anal. Appl. Pyrol. 2009, 86, 168–172.10.1016/j.jaap.2009.05.004Suche in Google Scholar
[16] Ramos ME, Bonelli PR, Blacher S, Ribeiro Carrott MML, Carrott PJM, Cukierman AL. Colloids Surf., A 2011, 378, 87–93.10.1016/j.colsurfa.2011.02.005Suche in Google Scholar
[17] Suzuki RM, Andrade AD, Sousa JC, Rollemberg MC. Bioresour. Technol. 2007, 98, 1985–1991.10.1016/j.biortech.2006.08.001Suche in Google Scholar
[18] Foo KY, Hameed BH. Chem. Eng. J. 2012, 184, 57–65.10.1016/j.cej.2011.12.084Suche in Google Scholar
[19] Vilaplana-Ortego E, Lillo-Ródenas MA, Alcañiz-Monge J, Cazorla-Amorós D, Linares-Solano A. Carbon 2009, 47, 2112–2143.10.1016/j.carbon.2009.04.020Suche in Google Scholar
[20] Mestre AS, Bexiga AS, Proença M, Andrade M, Pinto ML, Matos I, Fonseca IM, Carvalho AP. Bioresour. Technol. 2011, 102, 8253–8260.10.1016/j.biortech.2011.06.024Suche in Google Scholar
[21] Xiao H, Peng H, Deng SH, Yang XY, Zhang Z, Li YW. Bioresour. Technol. 2012, 111, 127–133.10.1016/j.biortech.2012.02.054Suche in Google Scholar
[22] Oliveira LCA, Pereira E, Guimaraes IR, Vallone A, Pereira M, Mesquita JP, Sapag K. J. Hazard. Mater. 2009, 165, 87–94.10.1016/j.jhazmat.2008.09.064Suche in Google Scholar
[23] Danisha M, Hashim R, Mohamad Ibrahim MN, Sulaiman O. J. Anal. Appl. Pyrol. 2013, 104, 418–425.10.1016/j.jaap.2013.06.003Suche in Google Scholar
[24] Baccar R, Bouzid J, Feki M, Montiel A. J. Hazard. Mater. 2009, 162, 1522–1529.10.1016/j.jhazmat.2008.06.041Suche in Google Scholar
[25] Hesas RH, Arami-Niyaa A, Wan Daud WMA, Sahu JN. J. Anal. Appl. Pyrol. 2013, 104, 176–184.10.1016/j.jaap.2013.08.006Suche in Google Scholar
[26] Foo KY, Hameed BH. Bioresource Technol. 2014, 134, 166–172.10.1016/j.biortech.2013.01.139Suche in Google Scholar
[27] Mubarak M, Shaija A, Suchithra TV. Algal Res. 2015, 7, 117–123.10.1016/j.algal.2014.10.008Suche in Google Scholar
[28] Hesas RH, Arami-Niya A, Daud WMAW, Sahu JN. Chem. Eng. Res. Des. 2013, 91, 2447–2456.10.1016/j.cherd.2013.06.004Suche in Google Scholar
[29] Zheng Z, Xia H, Srinivasakannan C, Peng J, Zhang L. Chem. Eng. Process. 2014, 82, 18.10.1016/j.cep.2014.05.001Suche in Google Scholar
[30] McKee DW. Fuel 1983, 62, 170–175.10.1016/0016-2361(83)90192-8Suche in Google Scholar
[31] Cao W, Xie KC, Lv YK, Bao WD. Bioresour. Technol. 2006, 97, 110–115.10.1016/j.biortech.2005.02.026Suche in Google Scholar
[32] IUPAC. Manual of Symbols and Terminology of Colloid Surface. Butterworths: London, 1982.Suche in Google Scholar
[33] Gadkaree KP, Jaroniec M. Carbon 2000, 38, 983–993.10.1016/S0008-6223(99)00204-3Suche in Google Scholar
©2016 by De Gruyter
Artikel in diesem Heft
- Frontmatter
- In this issue
- Publisher’s note
- Happy Birthday Green Processing and Synthesis!
- Editorial
- Merging of the sciences and technologies: non-technological barriers
- Microwave energy treatment
- Microwave energy: a green synthesis and treatment solution
- Utilization of walnut shell as a feedstock for preparing high surface area activated carbon by microwave induced activation: effect of activation agents
- Optimization of drying ammonium tetramolybdate by microwave heating using response surface methodology
- Extraction of zinc from blast furnace dust in ammonia leaching system
- Kinetics of ultrasound-assisted silver leaching from sintering dust using thiourea
- Effects of roasting pretreatment on zinc leaching from complicated zinc ores
- Study on dechlorination kinetics from zinc oxide dust by clean metallurgy technology
- Microwave roasting of agglomerated flux for submerged-arc welding
- Glass-forming ability and mechanical properties of a Zr52.8Cu29.1Ni7.3Al9.8Y1 bulk metallic glass prepared by hereditary process
- Original articles
- An improved and sustainable approach for the synthesis of α,β-dibromo ketones using ceric ammonium nitrate and ammonium bromide
- Utilization of waste dried Mangifera indica leaves for extraction of mangiferin by conventional batch extraction and advance three-phase partitioning
- Research on the reduction of Guizhou oolitic hematite by hydrogen
- Sulfated metal oxides: eco-friendly green catalysts for esterification of nonanoic acid with methanol
- Application of Acacia modesta and Dalbergia sissoo gums as green matrix for silver nanoparticle binding
- Conference announcement
- Conferences 2016–2017