Correlation of PM2.5 pollution and daily mortality rate of cardiovascular and cerebrovascular diseases in Northeast China through PM2.5 sources analysis
-
Qianqi Hong


Abstract
Objective
This study aims to evaluate the relationship between PM2.5 concentration and daily mortality rate from cardiovascular and cerebrovascular diseases (CCVD) in cold regions of northern China, as well as to identify the primary sources of PM2.5.
Methods
A time series analysis model was used to calculate the exposure-response relationship between PM2.5 and CCVD mortality in Harbin. Positive matrix factorization (PMF) was employed to analyze the sources of PM2.5.
Results
After adjusting for multiple pollutant combinations, the maximum excess risk of cardio-cerebrovascular death on the day of PM2.5 exposure was 0.42% (95% CI: 0.15%-0.70%). Stratification by gender and age revealed that the elderly individuals and men were particularly susceptible to PM2.5 exposure. The source analysis identified seven major pollution sources contributing to PM2.5 in Harbin.
Conclusion
Our findings strengthen the evidence that PM2.5 is an independent risk factor for daily CCVD mortality, identify vulnerable populations that require special attention, and pinpoint the primary sources of PM2.5 in Harbin. These findings provide reference points for effectively reducing the health risks associated with PM2.5 exposure.
1 Introduction
In recent years, energy consumption has steadily increased, leading to more severe air pollution and frequent regional haze weather events. Northeast China, in particular, experiences seasonal challenges, with spring and autumn affected by sandstorms and winter marked by severe PM2.5 pollution due to coal-fired heating. Numerous epidemiological studies have shown that PM2.5 poses significant risks to human health[1,2]. Exposure to PM2.5 has been linked to higher incidence rates of respiratory diseases[3], cardio-cerebrovascular diseases[4, 5], cancer[6], and even increased mortality[7,8].
PM2.5 refers to fine particulate matter with an aerodynamic diameter of less than 2.5 μm. These particles can penetrate the respiratory barrier, penetrate the body’s bronchioles and alveoli, where they tend to remain lodged in the lungs[9]. Due to their large surface area, PM2.5 particles can easily bind with toxic compounds,such as water-soluble ions, heavy metals, and polycyclic aromatic hydrocarbons (PAHs). The toxic substances carried by PM2.5 can enter the circulatory system via inhalation or trigger inflammatory reactions in the lungs, thereby affecting the cardio-cerebrovascular system. Stafoggia demonstrated that higher PM2.5 levels were associated with an increased risk of cerebrovascular events, including both ischemic and hemorrhagic stroke[10]. Similarly, Miller et al.[11] found a 28% increased risk of stroke incidence in women (HR = 1.28; 95% CI: 1.02%, 1.61%) per 10 μg/m3 increase in PM2.5. Lin et al.[12] found a significant correlation between daily excess concentration hours (DECH) of PM2.5 and cardiovascular mortality, with mortality rate increasing by 3.0%-5.0% for every 500 μg/m3 increase in PM2.5. In a study covering 30 counties in northern, eastern, and southwestern China, Chen , et al. found that for every 10 μg/m3 increase in PM2.5 on the same day, the mortality rate from cardiovascular disease rose by 0.12% (95% CI: 0.001%, 0.250%), and the rate of acute myocardial infarction increased by 0.42% (95% CI: 0.03%, 0.81%)[13].
However, the adverse health effects of PM2.5 vary across different countries or regions, likely due to differences in population characteristics, air pollution levels, chemical composition of pollutants, and residents’ living habits[14]. Therefore, it is necessary to study the characteristics, sources, and health impact of PM2.5 components specific to each region. Such research will help identify the key pollution sources and susceptible populations, thereby aiding in reducing the future disease burden on residents.
As an inland city in northern China, Harbin experiences four distinct seasons and is characterized by its heavy industry, manufacturing, and agriculture as pillar industries. The city’s climate, environment, and industrial structure differ significantly from those of other cities, making the composition of its PM2.5 both unique and representative. To investigate the sources of PM2.5 in Harbin, data on PM2.5 composition, including water-soluble ions, heavy metals, PAHs, were analyzed using the positive matrix factorization (PMF) model.
The EPA’s PMF5.0 software, which is based on the multilinear engine (ME) algorithm, was employed to identify the optimal factor contributions and the number of contributing factors. The ME algorithm initiates the search for the factor component spectrum using a randomly generated number of factors, iterating through the conjugate gradient algorithm until the minimum Q value is ob- tained[15]. PMF has been successfully applied in many studies to identify and analyze PM sources in the atmosphere, including in cities such as New York[16], the United Kingdom[17], and Beijing[18].
This study investigated the relationship between the mass concentration of PM2.5 and the mortality rate from cardio-cerebrovascular system diseases in Harbin. Identifying the primary sources of PM2.5 is crucial for mitigating its production at the source, thereby reducing the health risks posed by PM2.5 pollution to residents.
2 Methods
2.1 Study Area
This study focused on Harbin, a city in northeastern China located between 44°04’ to 46°40’N and 125°42’ to 130°10’E, covering an area of 53 076 square kilometers. Harbin experiences a temperate continental monsoon climate, characterized by long, cold winters and short, cool summers, with distinct seasonal changes. The study specifically examined air pollution in the main urban area, establishing two PM2.5 component monitoring sites based on the annual wind direction and the dispersion of air pollutant.
According to the annual wind frequency rose chart, Daoli District is situated upwind of Harbin, while Xiangfang District is located downwind, where numerous heavy industry factories are concentrated. Consequently, Daoli District was selected as a light pollution area, and Xiangfang District as a heavy pollution area.
2.2 Meteorological factors and ambient air pollutants
The daily meteorological data for 2016 to 2018 were obtained from the Harbin Meteorological Bureau. These data includes average temperature (°C), relative humidity (%), average atmospheric pressure (hpa), precipitation (mm), average wind speed (m/s), and sunshine hours (h). The air pollution data were sourced from the National Urban Air Quality Real-Time Release Platform. Harbin has a total of 11 air pollution monitoring stations covering the entire main urban area. The primary environmental air pollutants measured include PM2.5(μg/m3), NO2(μg/m3) and SO2(μg/m3), O3(μg/m3), and CO (mg/m3).
2.3 Composition of PM2.5
Based on wind direction and population density factors in Harbin, Daoli District and Xiangfang District were selected as sampling sites for PM2.5 components. A particle sampler with a flow rate of 100 L/min, equipped with quartz fiber and glass fiber filter membranes, was used to collect PM2.5 samples. The concentrations of water-soluble ions, heavy metals, and PAHs in the PM2.5 samples were determined.
2.4 Outcome measure
The daily mortality data from 2016 to 2018 were obtained from the Harbin Center for Disease Control and Prevention. All deaths related to cardiovascular and cerebrovascular diseases (CCVD) were coded according to the International Classification of Diseases, 10th Edition (ICD 10). This study was approved by the Ethics Committee of the Harbin Center for Disease Control and Prevention (Approval No. 2023015).
2.5 Statistics analysis
The mean and standard deviation were used to describe quantitative data with a normal distribution, while the median and interquartile range were used for data with a skewed distribution. The correlation between air pollution, meteorological data, and mortality data was assessed using the Spearman correlation coefficient.
To investigate the short-term relationship between PM2.5 concentration and mortality from cardio-cerebrovascular diseases, a time series generalized linear model (GLM) based on Poisson regression was established using R3.0.1 to calculate the expose-response relationship. PM2.5 monitoring data were used as the exposure concentration, while mortality data from CCVD in Harbin from 2016 to 2018 were used as the health outcome. Assuming a Poisson distribution, a log-link function was applied. The model controlled for long-term seasonal trends, meteorological factors, and day-of-the-week effects to establish the expose-response relationship between PM2.5 pollution and CCVD mortality. The model is expressed as follows:
where E (Yt) represents the expected number of CCVD deaths on day t. Zt is the concentration level of air pollutants on day t. β is the exposure-response coefficient, indicating the increase in daily CCVD mortality associated with a unit increase in pollutant concentration. Ns represents the natural spline function, with df indicating the degree of freedom. Time is a date variable, and the appropriate df value helps control for long-term and seasonal fluctuations of mortality data. DOW is an indicator variable for ‘day of the week’. Xt represents the meteorological factor on day t, including average temperature and relative humidity.
To test the robustness of the model, a sensitivity analysis was conducted as follows: (1) The degrees of freedom (df) for the time smoothing function were sequentially varied from 6 to 8 to assess the impact of controlling for time trends on effect estimation. (2) The impact of different lag times (0-7 days) on the estimation was analyzed to determine the lag period during which PM2.5 affects CCVD mortality. (3) The health effects were reanalyzed after incorporating coexisting pollutants, and a multi-pollutant model was developed to evaluate the impact of other atmospheric pollutants on the estimation of PM2.5 health effects.
The PMF model was used to analyze the characteristics of pollutants and the contribution of various pollution sources. The dataset was represented as a data matrix X (i × j), where i is the number of samples measured and j is the number of chemical components measured. The matrix X (i × j) can be decomposed into two matrices: G (i × p) and F (p × j), where p represents the number of main pollution sources (factors), G is the pollution source contribution matrix, and F is the source component spectrum matrix. E represents the residual matrix. The PMF model can be represented as:
In this study, the EPA PMF5.0 model analysis tool was applied, using a concentration uncertainty of 10% as the initial estimate for each species. The criteria for evaluating the model included the proportion of data below the method detection limit (MDL), data loss, signal-to-noise (S/N) ratio, proportion of residuals, and r2 value. After multiple iterations, the Q value stabilized, and the species were classified as “strong”, “weak”, or “bad” based on these criteria. Following this, a reasonable number of factors were selected for modeling and analysis.
3 Results
3.1 Characteristics of meteorological factors, air pollutants and cardio-cerebrovascular system mortality
As shown in Table 1, the annual average values of meteorological factors in Harbin from 2016 to 2018 showed no significant changes, except for a slight increase in temperature. The annual average concentrations of PM2.5 were 54.12 μg/m3, 57.16 μg/m3, and 37.37 μg/m3, respectively. The daily average number of deaths from cardio-cerebrovascular diseases was 92, 93, and 89, respectively. Between 2016 and 2018, the maximum daily average concentration of PM2.5 reached 460.45 μg/m3, exceeding the Class II standard of the Environmental Air Quality Standard (GB 3095, 2012) (75 μg/m3) by more than six times. In 2016, the number of days with daily average concentrations exceeding the standard was 96 days, in 2017, it was 75 days, and in 2018, it was 43 days. T These exceedances were primarily concentrated during the heating season. Additionally, NO2 and O3 concentrations also exceeded the standard. The maximum daily average concentration of NO2 was 134.36 μg/m3, exceeding the standard (80 μg/m3) by 1.6 times, with 25 days surpassing the standard. The maximum daily average concentration of O3 was 229.73 μg/m3, exceedingthe standard (160 μg/m3) by more than 1.4 times, with 19 days exceeding the standard. However, SO2 and CO concentrations did not exceed their respective standards.
Description of meteorological data, air pollution data and CCVD data of Harbin City from 2016 to 2018
| Year | 2016 | 2017 | 2018 | Standard value | ||||||
|---|---|---|---|---|---|---|---|---|---|---|
| Mean ± SD | Min | Max | Mean ± SD | Min | Max | Mean ± SD | Min | Max | ||
| Temperature (°C) | 1.05 ± 16.36 | -33.5 | 25.3 | 5.23 ± 15.22 | -22.38 | 29.15 | 5.19 ± 15.79 | -29.4 | 30.8 | - |
| Air pressure (hpa) | 995.57 ± 9.68 | 967.4 | 1021.8 | 999.69 ± 8.95 | 977.1 | 1020 | 1000.27 ± 9.46 | 979.2 | 1025.4 | - |
| Relative humidity (%) | 67.66 ± 14.78 | 28 | 98 | 63.62 ± 14.68 | 19 | 95 | 64.05 ± 15.94 | 20.3 | 95 | - |
| Wind velocity (m/s) | 2.89 ± 1.47 | 0.2 | 9 | 2.99 ± 1.40 | 0 | 9.2 | 2.97 ± 1.20 | 0.8 | 8.1 | - |
| SO2 (μg/m3) | 27.53 ± 23.70 | 2.82 | 101.18 | 24.19 ± 20.49 | 4.73 | 107.45 | 18.81 ± 16.53 | 3.45 | 80 | 150 |
| NO2 (μg/m3) | 42.05 ± 15.9 | 16.45 | 134.36 | 42.64 ± 19.07 | 11.82 | 130.45 | 33.71 ± 13.41 | 12.91 | 91.82 | 80 |
| CO (mg/m3) | 1.14 ± 0.37 | 0.54 | 3.34 | 1.03 ± 0.58 | 0.28 | 3.65 | 0.74 ± 0.30 | 0.38 | 2.36 | 4 |
| O3 (μg/m3) | 62.97 ± 25.55 | 12.73 | 159.09 | 85.23 ± 34.22 | 27.91 | 229.73 | 75.05 ± 29.10 | 25 | 192.64 | 160 |
| PM2.5 (μg/m3) | 54.12 ± 42.84 | 8 | 211.64 | 57.16 ± 62.92 | 6.45 | 460.45 | 37.37 ± 35.57 | 4.91 | 263.55 | 75 |
| CCVD (n) | 92.04 ± 14.60 | 56 | 153 | 92.98 ± 13.77 | 60 | 135 | 89.02 ± 15.07 | 51 | 134 | - |
3.2 Correlation between air pollutants and meteorological factors
Fig. 1 shows the Spearman rank correlation coefficient analysis between atmospheric pollutants and meteorological factors. PM2.5 was found to be negatively correlated with temperature, relative humidity, wind speed, and O3, and positively correlated with SO2, NO2, CO, and atmospheric pressure.
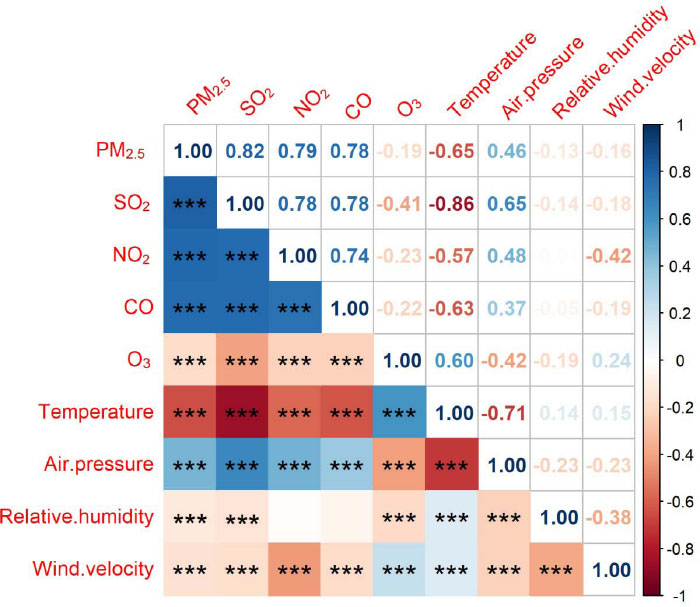
Correlation analysis between air pollutants and meteorological factors
3.3 The single factor exposure-lag-response associations of PM2.5
As shown in Table 2, there is a significant correlation between PM2.5 exposure and the number of deaths from CCVD on the day of exposure, as well as with delays of 1 day, 2 days, and 5 days. The exposure-response (ER) value with a 2-day delay reached its maximum at 0.35% (95% CI: 0.15%, 0.55%).
Association between PM2.5 and CCVD mortality with a 10mg/m3 increase in PM2.5: sex-specific, age-specific, and total analysis for Harbin city from 2016 to 2018
| lag days | Sex | Age | Total People | |||||||
|---|---|---|---|---|---|---|---|---|---|---|
| Male | Female | Age < 65 | Age ≥ 65 | |||||||
| ER | 95%CI | ER | 95%CI | ER | 95%CI | ER | 95%CI | ER | 95%CI | |
| lag0 | 0.24 | (-0.02, 0.49) | 0.37* | (0.09, 0.65) | 0.37* | (0.02, 0.71) | 0.27* | (0.03, 0.50) | 0.29* | (0.09, 0.50) |
| lag1 | 0.28* | (0.02, 0.53) | 0.15 | (-0.13, 0.44) | 0.26 | (-0.08, 0.61) | 0.21 | (-0.02, 0.45) | 0.23* | (0.02, 0.43) |
| lag2 | 0.39* | (0.14, 0.63) | 0.30* | (0.02, 0.58) | 0.28 | (-0.06, 0.62) | 0.37* | (0.15, 0.60) | 0.35* | (0.15, 0.55) |
| lag3 | 0.2 | (-0.05, 0.45) | 0.1 | (-0.18, 0.38) | 0.09 | (-0.25, 0.43) | 0.18 | (-0.05, 0.41) | 0.16 | (-0.05, 0.36) |
| lag4 | 0.27* | (0.02, 0.51) | 0.05 | (-0.22, 0.33) | -0.20 | (-0.54, 0.14) | 0.32* | (0.09, 0.54) | 0.18 | (-0.03, 0.38) |
| lag5 | 0.31* | (0.06, 0.56) | 0.29* | (0.01, 0.57) | 0.16 | (-0.18, 0.50) | 0.35* | (0.13, 0.58) | 0.30* | (0.10, 0.50) |
| lag6 | 0.20 | (-0.05, 0.45) | 0.11 | (-0.17, 0.39) | 0.15 | (-0.19, 0.49) | 0.16 | (-0.07, 0.40) | 0.16 | (-0.04, 0.37) |
| lag7 | 0.25 | (0.00, 0.50) | 0.12 | (-0.16, 0.40) | -0.04 | (-0.38, 0.31) | 0.28* | (0.05, 0.51) | 0.19 | (-0.01, 0.40) |
CI, confidence interval; ER, relative risk. *P < 0.05..
After stratifying by gender, the results revealed a significant correlation between PM2.5 exposure and the number of deaths from CCVD in males, with delays of 1 day, 2 days, 4 days, and 5 days. The ER value with a 2-day delay was at its maximum, reaching 0.39% (95% CI: 0.14%, 0.63%). In the female group, a significant correlation was found on the day of exposure, as well as with delays of 2 days and 5 days. The ER value was highest on the day of exposure, reaching 0.37% (95% CI: 0.09%, 0.65%).
After stratifying by age, the results indicated a significant correlation between PM2.5 exposure and the number of deaths from CCVD in individuals under 65 years old on the day of exposure, with an ER value of 0.37% (95% CI: 0.02%, 0.71%). For individuals aged 65 and older, significant correlations were observed on the day of exposure, as well as with delays of 2 days, 4 days, 5 days, and 7 days. The maximum ER value was observed on the day of exposure, reaching 0.37% (95% CI: 0.15%, 0.60%).
3.4 The multi-factor exposure-lag-response associations of PM2.5
PM2.5 lag days data with statistically significant results in the single-pollutant model were selected for further analysis in the multi-pollutant model, as shown in Table 3.
Association between PM2.5 and CCVD mortality with a 10mg/m3 increase in PM2.5 : single-pollutant and multi-pollutant models for Harbin city from 2016 to 2018
| Models | lag0 | lag1 | lag2 | lag5 | ||||
|---|---|---|---|---|---|---|---|---|
| ER | 95%CI | ER | 95%CI | ER | 95%CI | ER | 95%CI | |
| PM2.5 | 0.29* | (0.09, 0.50) | 0.23* | (0.02, 0.43) | 0.35* | (0.15, 0.55) | 0.30* | (0.10, 0.50) |
| PM2.5 + NO2 | 0.42* | (0.15, 0.69) | 0.20 | (-0.06, 0.47) | 0.19 | (-0.07, 0.46) | 0.29* | (0.02, 0.55) |
| PM2.5 + SO2 | 0.41* | (0.18, 0.65) | 0.27* | (0.03, 0.50) | 0.29* | (0.06, 0.53) | 0.27* | (0.03, 0.50) |
| PM2.5 + O3 | 0.29* | (0.08, 0.50) | 0.18 | (-0.02, 0.39) | 0.30* | (0.10, 0.50) | 0.29* | (0.08, 0.49) |
| PM2.5 + CO | 0.35* | (0.08, 0.63) | 0.17 | (-0.10, 0.44) | 0.18 | (-0.09, 0.44) | 0.14 | (-0.13, 0.41) |
| PM2.5 + NO2 + SO2 | 0.42* | (0.15, 0.70) | 0.21 | (-0.06, 0.47) | 0.19 | (-0.07, 0.46) | 0.28* | (0.01, 0.55) |
| PM2.5 + NO2 + CO | 0.41* | (0.12, 0.70) | 0.17 | (-0.11, 0.46) | 0.14 | (-0.14, 0.42) | 0.19 | (-0.09, 0.47) |
| PM2.5 + NO2 + O3 | 0.41* | (0.14, 0.69) | 0.15 | (-0.12, 0.42) | 0.14 | (-0.13, 0.40) | 0.27 | (0, 0.54) |
| PM2.5 + SO2 + CO | 0.39* | (0.11, 0.66) | 0.18 | (-0.09, 0.46) | 0.17 | (-0.09, 0.44) | 0.15 | (-0.12, 0.42) |
| PM2.5 + SO2 + O3 | 0.41* | (0.17, 0.65) | 0.22 | (-0.02, 0.45) | 0.24 | (0, 0.47) | 0.25* | (0.01, 0.49) |
| PM2.5 + CO + O3 | 0.35* | (0.07, 0.62) | 0.11 | (-0.16, 0.39) | 0.11 | (-0.15, 0.38) | 0.13 | (-0.14, 0.39) |
| PM2.5 + NO2 + SO2 + CO | 0.40* | (0.11, 0.69) | 0.17 | (-0.12, 0.45) | 0.14 | (-0.14, 0.42) | 0.19 | (-0.09, 0.47) |
| PM2.5 + NO2 + SO2 + O3 | 0.42* | (0.15, 0.69) | 0.16 | (-0.11, 0.43) | 0.14 | (-0.13, 0.40) | 0.27 | (0, 0.54) |
| PM2.5 + NO2 + O3 + CO | 0.41* | (0.12, 0.70) | 0.12 | (-0.17, 0.40) | 0.08 | (-0.20, 0.36) | 0.17 | (-0.11, 0.46) |
| PM2.5 + SO2 + O3 + CO | 0.38* | (0.11, 0.66) | 0.13 | (-0.14, 0.40) | 0.11 | (-0.16, 0.38) | 0.13 | (-0.14, 0.40) |
| PM2.5 + NO2 + SO2 + CO + O3 | 0.40* | (0.11, 0.69) | 0.11 | (-0.17, 0.40) | 0.08 | (-0.21, 0.36) | 0.17 | (-0.11, 0.46) |
CI, confidence interval; ER, relative risk. *P < 0.05.
On the day of PM2.5 exposure, after correcting for one or more pollutants, the impact of PM2.5 on the mortality rate from CCVD increased compared to the single-pollutant model.
For a one-day lag in PM2.5 exposure, after adjusting for SO2, the impact of PM2.5 on CCVD mortality increased compared to the single-pollutant model, with an ER value of 0.27% (0.03%-0.50%). No significant correlation with CCVD mortality was found after adjusting for other pollutants or combinations of pollutants.
For a two-day lag in PM2.5 exposure, the impact of PM2.5 on CCVD mortality was reduced compared to the single-pollutant model when adjusted for SO2 or O3, with ER values of 0.29% (95% CI: 0.06%, 0.53%) and 0.30% (95% CI: 0.10%, 0.50%), respectively. No significant correlation with CCVD mortality was found after adjusting for other pollutants or combinations of pollutants.
After five days of delayed exposure to PM2.5, the impact of PM2.5 on CCVD mortality was reduced compared to the single-pollutant model when adjusted for NO2, SO2, or O3, with ER values of 0.29% (0.02%-0.55%), 0.27% (0.03%-0.50%), and 0.29% (0.08%-0.49%), respectively. When adjusting simultaneously for SO2 and NO2, SO2 and O3, the impact of PM2.5 on CCVD mortality was further reduced compared to the single-pollutant model, with ER values of 0.28% (0.01%-0.55%) and 0.25% (0.01%- 0.49%), respectively. No significant correlation with CCVD mortality was found after adjusting for other pollutants or combinations of pollutants.
3.5 Source Apportionment of PM2.5
The classification of each species was determined based on the proportion of data below the method detection limit (MDL), as well as the criteria including missing data, signal-to-noise (S/N) values, proportion residuals, and r2 values. Species classified as “strong” include SO4 2−, NO3 −, NH4 + , As, Cd, Cr, Pb, Ni, TI, Ace, Ant, Flua, Pyr, Chr, BaA, BbF, BkF, BaP, DahA, BghiP, and IcdP. Species classified as “weak” include Cl-, Sb, Al, Be, Hg, Mn, Se, Nap, Flu, and Phe. Acy was classified as “bad”. By multiple adjustments to the number of factors through the model, the optimal number of 7 factors was determined. These 7 main sources of atmospheric PM2.5 pollution in Harbin are illustrated in Fig. 2 and Fig. 3.
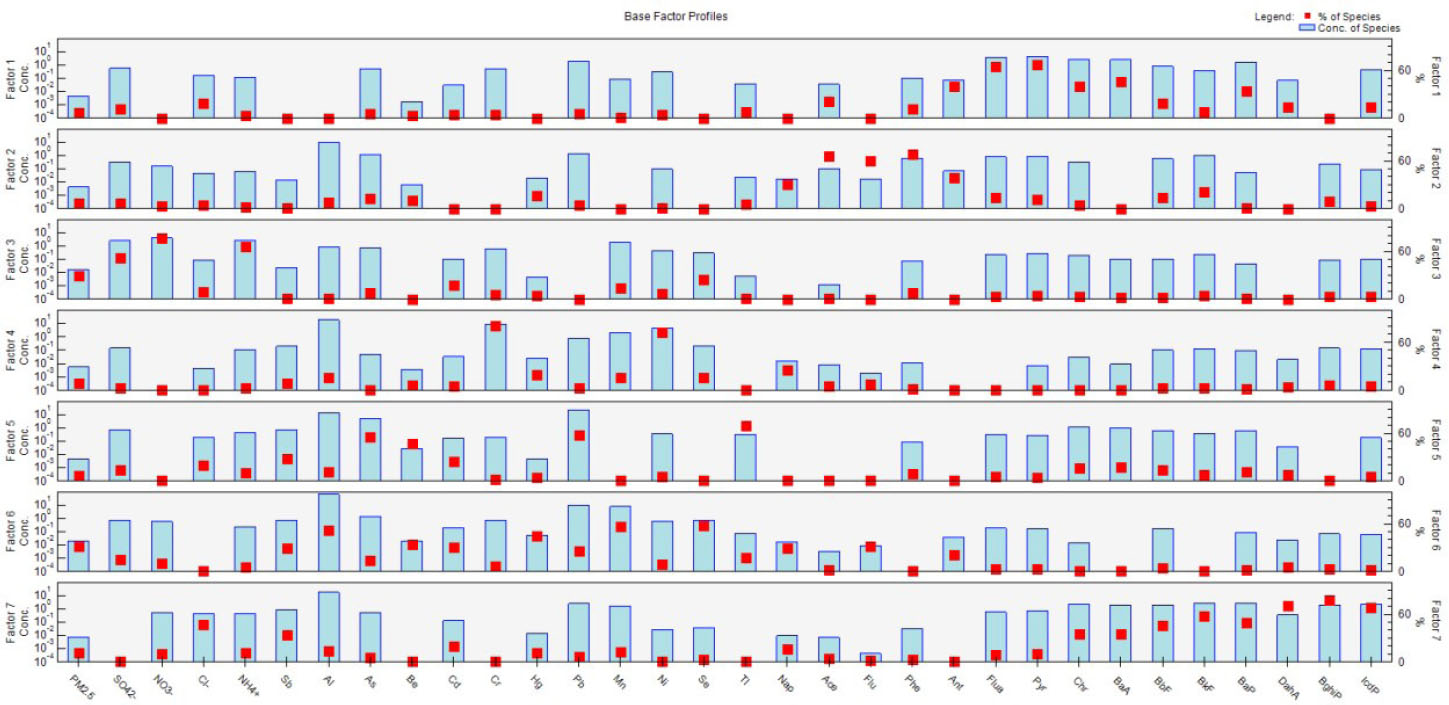
Component spectra of each factor obtained by positive matrix factorization
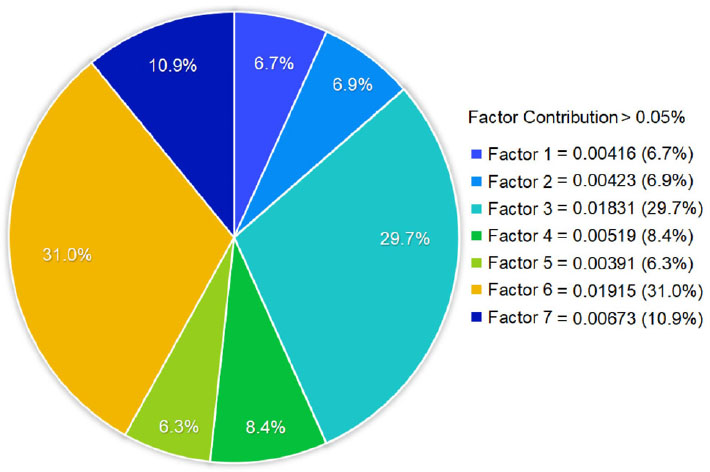
Contribution rates of each factor obtained by positive matrix factorization
In Factor 1, the characteristic elements Pyr, Flua, and BaA are identified. Pyr and BaA are both 4-ring PAHs, which generally originate from coal-fired emissions. Flua, a 3-ring PAHs, is typically associated with the industrial combustion of wood or oil[19]. Moreover, Pyr and Flua are known biomarkers of coal-fired emis- sions[20]. Thus, Factor 1 is identified as coal smoke dust, with a contribution rate of 6.7%.
In Factor 2, the characteristic elements Phe, Ace, and Flu areidentified. Phe and Flu are both 3-ring PAHs and generally originate from biomass combustion sources[21]. In the winter and spring, the burning of farmland around Harbin, particularly straw burning, can generate a large amount of Ace. Therefore, Factor 2 is identified as biomass combustion dust, with a contribution rate of 6.9%.
In Factor 3, the characteristic elements NO3 -, NH4 + , and SO4 2- are identified. These ions are all formed through the secondary conversion of their precursors. NO3 - typically originates from the conversion of nitrogen oxides emitted by motor vehicle and other combustion processes. SO42- is a secondary pollutant formed by SO2 through gas-solid conversion mechanism. NH4+ is mainly generated through the neutralization reaction of atmospheric NH3[22]. Therefore, Factor 3 is identified as secondary particles, with a contribution rate of 29.7%.
In Factor 4, the characteristic elements Cr and Ni are identified. Both Cr and Ni are heavy metals produced during metallurgical process[23, 24]. Therefore, Factor 4 is identified as smelting dust, with a contribution rate of 8.4%.
In Factor 5, the characteristic elements TI, Pb, and As are identified. TI mainly originates from industrial emissions. Pb is a metal component used in various factory processes, characterized by its low melting point, which makes it prone to dust generation during smelting[25]. As is mainly derived from decolorizing agents used in mining, metallurgy, pharmaceuticals, glass industries, as well as from various insecticides, coal burning, fertilizers, leather, and pesticides[26]. Therefore, Factor 5 is identified as industrial dust, with a contribution rate of 6.3%.
In Factor 6, the characteristic elements Mn, Se, Al, and Hg are identified. Mn, Se, and Al are representative elements of soil sources[27, 28]. Hg may originate from emissions related to activities such as cement production, mining, and the processing of mineral materials. Therefore, Factor 6 is identified as surface dust and construction dust, with a contribution rate of 31.0%.
In Factor 7, the characteristic elements BghiP, DahA, IcdP, BkF, BbF, and BaP are identified s. Research indicates that high ring PAHs (5 ring and 6 ring) are typically emitted by motor vehi- cles[29, 30]. Therefore, Factor 7 is classified as motor vehicle exhaust dust, with a contribution rate of 10.9%.
4 Discussion
This work aimed to study the relationship between PM2.5 exposure and the daily mortality rate of cardio-cerebrovascular diseases (CCVD) in Harbin. The sources of PM2.5 were analyzed using the PMF model. The study found a positive correlation between short-term PM2.5 exposure and an increased risk of CCVD mortality. This finding aligns with global burden of disease research, which identifies PM2.5 as a primary environmental risk factor contributing to premature deaths among patients with CCVD[31]. The source analysis reveals the principal sources of PM2.5 in Harbin. , highlighting that, as a heavy industrial city in a northern cold region, t Harbin’s PM2.5 composition differs from that of other cities.
In this study, we found that on the day of PM2.5 exposure, the risk of death from CCVD increased by 0.29% (95% CI: 0.09%, 0.50%) for every 10 μg/m3 increase in PM2.5 concentration in the single-pollutant model. In the multi-pollutant model, after adjusting for NO2 and SO2, the impact of PM2.5 concentration on CCVD mortality was most pronounced, with an excess risk (ER) value of 0.42% (95% CI: 0.15%, 0.70%). Liu et al.[32] found that in Shenyang city from 2013 to 2016, cardiovascular disease mortality increased by 0.4% (95% CI: 0.22%, 0.59%) for every 10 μg/m3 increase in PM2.5 concentration. Wang, et al.[33] reported a summary estimate of a 1.4% (95% CI: 0.9%, 1.9%) higher risk of cerebrovascular mortality per 10 μg/m3 increase in PM2.5. The present study indicates that the adverse effects of PM2.5 in Harbin are somewhat different from those reported in these studies. These differences may be attributed to variations in study periods, air pollution composition, and residents’ living habits.
In the age-specific analysis, the excess risk of death from CCVD were highest among individuals younger than 65 years of age on the day of PM2.5 exposure. Specifically, the risk of death from CCVD increased by 0.37% for every 10 μg/m3 rise in PM2.5 concentration (95% CI: 0.02%, 0.71%). For those aged 65 years or older, the excess risk reached its peak two days after PM2.5 exposure, with a 0.37% increase in CCVD mortality for every 10 μg/m3 increase in PM2.5 concentration (95% CI: 0.15%, 0.60%). For individuals e under 65 years of age, PM2.5 exposure led to an immediate increase in CCVD mortality only on the day of exposure. In contrast, for those aged 65 and older, PM2.5 exposure resulted in elevated CCVD mortality both on the day of exposure and with a delayed effect over the following days. Thus, while PM2.5 exposure may cause more rapid onset of y damage in individuals under 65, the duration of its harmful effects is shorter. Conversely, in those aged 65 and above, there is a lag in the onset of damage, but the harmful effects persist longer. This difference may be attributed to the faster metabolism in young individuals, allowing for quicker recovery from pollution-induced damage to the CCVD caused by pollution. In contrast, the slower metabolism and age-related decline in cardio-cerebrovascular function in older adults result in delayed and prolonged damage that the body cannot repair as efficiently[34].
In the sex-specific analysis, the excess risk of death from CCVD in women was highest on the day of PM2.5 exposure, with an increase of 0.37% (95% CI: 0.09%, 0.65%) for every 10 μg/m3 increase in PM2.5 concentration. For men, the greatest excess risk occurred with a 2-day lag, with the risk increasing by 0.39% (95% CI: 0.14%, 0.63%) for every 10 μg/m3 increase in PM2.5 concen-tration. This indicates that PM2.5 exposure has a shorter duration of impact on women compared to men, and the maximum excess risk is lower for women. This disparity may be attributed to the differences in behavior, exposure patterns (such as diet and smoking), and biological factors (such as hormone differences)[35].
The source analysis using PMF on water-soluble ions, heavy metals, and polycyclic aromatic hydrocarbons in PM2.5 in Harbin identified the following key contributors to PM2.5 pollution, ranked from highest to lowest:
Surface dust and construction dust: Harbin, as a northern inland city, experiences strong winds in spring and autumn, a dry climate, and sandstorms, which contribute to significant surface dust pollution. Additionally, recent urban development, including shantytown renovations and extensive construction projects such as buildings, bridges, and roads, has led to severe construction dust pollution.
Secondary particles: These particles result from the secondary conversion of precursors such as SO2, NOx, and NH3. Their substantial proportion in PM2.5 components in Harbin reflects the high levels of secondary particulate formation, driven by the combustion of coal during winter heating, vehicle emissions, and ammonia fertilizer use in surrounding farmland. These precursors undergo various chemical reactions to form secondary particles.
Motor vehicle exhaust dust: The dominance of gasoline and diesel vehicles in Harbin contributes significantly to motor vehicle exhaust dust. During winter, the incomplete combustion of fuel exacerbates the emission of intermediate combustion products, resulting in severe exhaust pollution compared to summer.
Smelting dust: The presence of a metal smelting research institute near the sampling site results in heavy metal ions from smelting being adsorbed onto PM2.5 particles, leading to a higher contribution rate of smelting dust in the monitoring results.
Biomass combustion dust: The burning of straw in surrounding farmland, particularly during winter and spring, generates biomass combustion dust. However, increased enforcement of bans on straw burning since 2017 has led to a reduction in pollution from this source.
Coal smoke and dust: The combustion of coal for winter heating contributes to significant coal smoke and dust pollution. Although heating companies have implemented dust removal facilities and particulate matter collection devices, insufficient policy implementation has limited the effectiveness of these measures.
Industrial dust: Industrial activities, including the production processes of heavy industries and pharmaceuticals, contribute to industrial dust entering the atmosphere.
Overall, these findings highlight the diverse sources of PM2.5 pollution in Harbin, reflecting the city’s unique environmental and industrial characteristics.
There are several limitations in our research. Firstly, the PM2.5monitoring data used in this study are derived from outdoor air pollution measurements. This approach may not fully capture the impact of indoor pollution sources, such as household heating, cooking, and smoking, which can also significantly affect cardiovascular health. Secondly, this study focuses on the short-term effects of PM2.5 exposure. Previous research has indicated that long-term exposure to PM2.5 can result in a mortality rate that is up to ten times higher than that associated with short-term exposure[36]. This study does not address the long-term health impacts, which limits the comprehensiveness of the findings. Finally, The study does not explore the mechanisms through which different PM2.5 components contribute to health damage. The specific roles and relative contributions of various PM2.5 compo-nents to mortality are still not well understood. Identifying and quantifying the harmful effects of individual components remains a challenge for future research.
5 Conclusions
Our research indicates that PM2.5 exposure in Harbin has a more pronounced impact on CCVD among male residents compared to females. Additionally, elderly individuals, as a particularly vulnerable group, require enhanced protective measures. Source composition analysis reveals that the primary contributors to PM2.5 pollution in Harbin are surface dust and construction dust. To mitigate these issues, the following measures are recommended:
Expand green spaces: Increase tree planting in the outskirts of Harbin to reduce wind and sand intrusion, which can help minimize surface dust.
Enhance construction dust management: Implement stricter regulations and better practices for managing dust on construction sites to reduce construction-related air pollution.
By addressing these key areas, we can improve air quality and better protect public health, particularly among the most affected demographics.
Funding statement: This work was supported by the National Natural Science Foundation of China (No. 82273613). This work was supported by the Research project of Health Commission of Heilongjiang Province (No. 20231212010393).
-
Author contributions
Hong Q Q and Wang C conceived the study design. Hong Q Q, Zhao Y and Wang J did the data acquisition. Hong Q Q, Deng L X, Cao J J and Sun H Y did the statistical analysis. Hong Q Q and Wang C wrote the manuscript. All authors approved the submitted draft.
-
Ethical approval
This study was approved by the Ethics Committee of the Harbin Center for Disease Control and Prevention (Approval No. 2023015).
-
Informed consent
Not applicable.
-
Conflict of interest
All authors did not have any competing interest to declare.
-
Data availability statement
The data are available from the corresponding author on reasonable request.
References
[1] Bu X, Xie Z, Liu J, et al. Global PM2.5-attributable health burden from 1990 to 2017: Estimates from the Global Burden of disease study. Environ Res, 2021; 197: 111123.10.1016/j.envres.2021.111123Suche in Google Scholar PubMed
[2] Abbas I, Verdin A, Escande F, et al. In vitro short-term exposure to air pollution PM2.5-0.3 induced cell cycle alterations and genetic instability in a human lung cell coculture model. Environ Res, 2016; 147: 146-158.10.1016/j.envres.2016.01.041Suche in Google Scholar PubMed
[3] Xing Y F, Xu Y H, Shi M H, et al. The impact of PM2.5 on the human respiratory system. J Thorac Dis, 2016; 8(1): E69-74.Suche in Google Scholar
[4] Martinelli N, Olivieri O, Girelli D. Air particulate matter and cardiovascular disease: a narrative review. Eur J Intern Med, 2013; 24(4): 295-302.10.1016/j.ejim.2013.04.001Suche in Google Scholar PubMed
[5] Cao Y, Han X, Zhao X, et al. Pathogenesis and preventive measures of environmentrelated cardiovascular disease in Northern China. Frigid Zone Medicine, 2022; 2(3): 140.10.2478/fzm-2022-0021Suche in Google Scholar
[6] Yeh H L, Hsu S W, Chang Y C, et al. Spatial analysis of ambient PM2.5 exposure and bladder cancer mortality in Taiwan. Int J Environ Res Public Health, 2017; 14(5): 508.10.3390/ijerph14050508Suche in Google Scholar PubMed PubMed Central
[7] Wu J, Zhu J, Li W, et al. Estimation of the PM2.5health effects in China during 2000-2011. Environ Sci Pollut Res Int, 2017; 24(11): 10695-10707.10.1007/s11356-017-8673-6Suche in Google Scholar PubMed
[8] Shi T X, Dong H, Yang Y J, et al. Association between PM2.5 air pollution and daily resident mortality in Guangzhou urban area in winter. Journal of Environment and Health, 2015; 32(6): 477-481.Suche in Google Scholar
[9] Churg A, Brauer M. Human lung parenchyma retains PM2.5. Am J Respir Crit Care Med, 1997; 155(6): 2109-2111.10.1164/ajrccm.155.6.9196123Suche in Google Scholar PubMed
[10] Stafoggia M, Cesaroni G, Peters A, et al. Long-term exposure to ambient air pollution and incidence of cerebrovascular events: results from 11 European cohorts within the ESCAPE project. Environ Health Perspect, 2014; 122(9): 919-925.10.1289/ehp.1307301Suche in Google Scholar PubMed PubMed Central
[11] Miller K A, Siscovick D S, Sheppard L, et al. Long-term exposure to air pollution and incidence of cardiovascular events in women. N Engl J Med, 2007; 356(5): 447-458.10.1056/NEJMoa054409Suche in Google Scholar PubMed
[12] Lin H, Wang X, Qian Z M, et al. Daily exceedance concentration hours: a novel indicator to measure acute cardiovascular effects of PM2.5 in six Chinese subtropical cities. Environ Int, 2018; 111: 117-123.10.1016/j.envint.2017.11.022Suche in Google Scholar PubMed
[13] Chen C, Zhu P, Lan L, et al. Short-term exposures to PM2.5 and cause-specific mortality of cardiovascular health in China. Environ Res, 2018; 161:188-194.10.1016/j.envres.2017.10.046Suche in Google Scholar PubMed
[14] Atkinson R W, Butland B K, Anderson H R, et al. Long-term Concentrations of nitrogen dioxide and mortality: a meta-analysis of cohort studies. Epidemiology, 2018; 29(4): 460-472.10.1097/EDE.0000000000000847Suche in Google Scholar PubMed PubMed Central
[15] Liu G R, Peng X, Wang R K, et al. A new receptor model-incremental lifetime cancer risk method to quantify the carcinogenic risks associated with sources of particle-bound polycyclic aromatic hydrocarbons from Chengdu in China. J Hazard Mater, 2015; 283: 462-468.10.1016/j.jhazmat.2014.09.062Suche in Google Scholar PubMed
[16] Li Z, Hopke P K, Husain L, et al. Sources of fine composition in New York City. Atmospheric Environment, 2004; 38(38): 6521-6529.10.1016/j.atmosenv.2004.08.040Suche in Google Scholar
[17] Qin Y, Oduyemi K. Atmospheric aerosol source identification and estimates of source contributions to air pollution in Dundee. Atmospheric Environment, 2003; 37(13): 1799-1809.10.1016/S1352-2310(03)00078-5Suche in Google Scholar
[18] Xia W W, Liang B, Chen L, et al. Atmospheric wet and dry depositions of polycyclic aromatic compounds in a megacity of Southwest China. Environ Res, 2022; 204(Pt D): 112151.10.1016/j.envres.2021.112151Suche in Google Scholar PubMed
[19] Shi J W, Peng Y, Li W F, et al. Characterization and source identification of PM 10-bound polycyclic aromatic hydrocarbons in urban air of Tianjin, China. Aerosol & Air Quality Research, 2010; 10(5): 507-518.10.4209/aaqr.2010.06.0050Suche in Google Scholar
[20] Li W, Peng Y, Shi J, et al. Particulate polycyclic aromatic hydrocarbons in the urban Northeast Region of China: profiles, distributions and sources. Atmospheric Environment, 2011; 45(40): 7664-7671.10.1016/j.atmosenv.2011.04.004Suche in Google Scholar
[21] Jenkins B M, Jones A D, Turn S Q, et al. Emission factors for polycyclic aromatic hydrocarbons from biomass burning. Environmental Science & Technology, 1996; (8): 30.10.1021/es950699mSuche in Google Scholar
[22] Hsu Y C, Lai M H, Wang W C, et al. Characteristics of water-soluble ionic species in fine (PM2.5) and coarse particulate matter (PM10-2.5) in Kaohsiung, southern Taiwan. J Air Waste Manag Assoc, 2008; 58(12): 1579-1589.10.3155/1047-3289.58.12.1579Suche in Google Scholar PubMed
[23] Song Y, Xie S, Zhang Y, et al. Source apportionment of PM2.5in Beijing using principal component analysis/absolute principal component scores and UNMIX. Sci Total Environ, 2006; 372(1): 278-286.10.1016/j.scitotenv.2006.08.041Suche in Google Scholar PubMed
[24] Gladtke D, Volkhausen W, Bach B. Erratum to “estimating the contribution of industrial facilities to annual PM10 concentrations at industrially influenced sites”. Atmospheric Environment, 2009; 43(40): 6454.10.1016/j.atmosenv.2009.11.001Suche in Google Scholar
[25] Taylor M P, Isley C F, Glover J. Prevalence of childhood lead poisoning and respiratory disease associated with lead smelter emissions. Environ Int, 2019; 127: 340-352.10.1016/j.envint.2019.01.062Suche in Google Scholar PubMed
[26] Pokorná P, Hovorka J, Krouzek J, et al. Particulate matter source apportionment in a village situated in industrial region of Central Europe. J Air Waste Manag Assoc, 2013; 63(12): 1412-1421.10.1080/10962247.2013.825215Suche in Google Scholar PubMed
[27] Begum B A, Hopke P K. Identification of haze-creating sources from fine particulate matter in Dhaka aerosol using carbon fractions. J Air Waste Manag Assoc, 2013; 63(9): 1046-1057.10.1080/10962247.2013.784716Suche in Google Scholar PubMed
[28] Kara M, Hopke P K, Dumanoglu Y, et al. Characterization of PM using multiple site data in a heavily industrialized region of Turkey. Aerosol and Air Quality Research, 2015; 15(1): 11-27.10.4209/aaqr.2014.02.0039Suche in Google Scholar
[29] Venkataraman C, Friedlander S X X. Source Resolution of fine particulate polycyclic aromatic hydrocarbons using a receptor model modified for reactivity. Air Repair, 1994; 44(9):1103-1108.10.1080/10473289.1994.10467306Suche in Google Scholar
[30] Marr L C, Kirchstetter T W, Harley R A, et al. Characterization of polycyclic aromatic hydrocarbons in motor vehicle fuels and exhaust emissions. Environmental Science & Technology: ES&T, 1999; (18): 33.10.1021/es981227lSuche in Google Scholar
[31] Rajagopalan S, Al-Kindi S G, Brook R D. Air pollution and cardiovascular disease: JACC State-of-the-Art Review. J Am Coll Cardiol, 2018; 72(17): 2054-2070.10.1016/j.jacc.2018.07.099Suche in Google Scholar PubMed
[32] Liu M, Xue X, Zhou B, et al. Population susceptibility differences and effects of air pollution on cardiovascular mortality: epidemiological evidence from a time-series study. Environ Sci Pollut Res Int, 2019; 26(16): 15943-15952.10.1007/s11356-019-04960-2Suche in Google Scholar PubMed
[33] Wang Y, Eliot M N, Wellenius G A. Short-term changes in ambient particulate matter and risk of stroke: a systematic review and meta-analysis. J Am Heart Assoc, 2014; 3(4): e000983.10.1161/JAHA.114.000983Suche in Google Scholar PubMed PubMed Central
[34] Dirgawati M, Hinwood A, Nedkoff L, et al. Long-term exposure to low air pollutant concentrations and the relationship with all-cause mortality and stroke in older men. Epidemiology, 2019; 30: S82-S89.10.1097/EDE.0000000000001034Suche in Google Scholar PubMed
[35] Clougherty J E. A growing role for gender analysis in air pollution epidemiology. Cien Saude Colet, 2011; 16(4): 2221-2238.10.1590/S1413-81232011000400021Suche in Google Scholar
[36] Pope C A, 3rd, Burnett R T, Thurston G D, et al. Cardiovascular mortality and long-term exposure to particulate air pollution: epidemiological evidence of general pathophysiological pathways of disease. Circulation, 2004; 109(1): 71-77.10.1161/01.CIR.0000108927.80044.7FSuche in Google Scholar PubMed
© 2024 Qianqi Hong, Yang Zhao, Jing Wang, Hongyan Sun, Lanxin Deng, Jingjing Cao, Cheng Wang, published by De Gruyter on behalf of Heilongjiang Health Development Research Center
This work is licensed under the Creative Commons Attribution 4.0 International License.
Artikel in diesem Heft
- Frontmatter
- Original Article
- Correlation of PM2.5 pollution and daily mortality rate of cardiovascular and cerebrovascular diseases in Northeast China through PM2.5 sources analysis
- Small ubiquitin-like modifiers inhibitors lower blood pressure via ERK5/KLF2-dependent upregulation of the eNOS/NO pathway
- GDF11 restores the impaired function of EPCs-MA by promoting autophagy: GDF11 ameliorates endothelial progenitor cell aging by promoting autophagy
- ISG15 promotes M5-induced hacat cell proliferation through Wnt signaling in psoriasis
- Identification of hub genes and pathways in mouse with cold exposure
- The function and effect on prognosis of ANXA2 in gastric cancer peritoneal metastasis patients in cold region
- Arthroscopic patellar denervation with microfracture for treating patellofemoral arthritis in cold weather conditions: a retrospective clinical analysis